2619
Neuromelanin-sensitive MRI using deep learning reconstruction (DLR) denoising: comparison of DLR patterns1Department of Diagnostic Radiology and Nuclear Medicine, Graduate School of Medicine, Kyoto University, Kyoto, Japan, 2Canon Medical Systems Corporation, Otawara, Japan, 3Department of Real World Data Research and Development, Graduate School of Medicine, Kyoto University, Kyoto, Japan, 4Department of Advanced Medical Imaging Research, Graduate School of Medicine, Kyoto University, Kyoto, Japan
Synopsis
We applied four patterns of deep learning reconstruction (DLR) denoising methods to 1 NEX neuromelanin-sensitive MR images. DLR with denoising intensity coefficient of 1.0 and edge enhancement off provided the best image quality among the four types of DLR, and it was significantly better than or as good as 5 NEX images. ROC analyses using images with all DLR patterns showed good AUCs for diagnosis of Parkinson’s disease. This DLR denoising method can improve image quality of neuromelanin-sensitive MRI with good diagnostic ability to differentiate patients with Parkinson’s disease from healthy controls.
Introduction
Neuromelanin-sensitive MR imaging (NM-MRI) has been developed to visualize the substantia nigra (SN) and locus coeruleus (LC). Previous studies have proven that this imaging can help diagnose Parkinson’s disease (PD) by showing decreased contrast ratios of the SN or LC.1-6 However, it usually requires relatively long scan time. Recently, deep learning reconstruction (DLR) method for image noise reduction has been developed, which can reduce acquisition time without spoiling image quality.7 The aims of this study were: 1) to compare the image quality of 1 number of excitation (NEX) NM-MRI without DLR and with four patterns of DLR, and 5 NEX NM-MRI; and 2) to evaluate diagnostic ability for PD using 1 NEX NM-MRI with DLR.Methods
SubjectsThis prospective study was approved by the institutional review board. We enrolled 10 healthy volunteers (1 male and 9 females; age, 35.3 ± 9.4 years) and 15 patients with PD (7 males and 8 females; age, 67.4 ± 10.4 years).
MR image acquisition and denoising with DLR
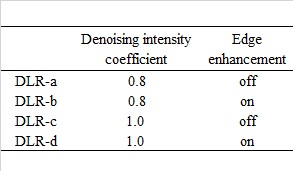
MR imaging was performed at a 3T MR scanner (Vantage Galan 3T / ZGO, Canon Medical Systems, Otawara, Japan) with a 32-channel head coil. We acquired NM-MR images (2D gradient echo pulse sequence with MTC preparation) with 1 NEX. Scan with 5 NEX was also performed for healthy volunteers. The parameters were as follows: TR/TE, 460/2.7 ms; 15 slices; slice thickness/gap, 3/0 mm; in-plane resolution, 0.55×0.55 mm2; matrix, 416×416; FOV, 230×230 mm2; flip angle, 40°; bandwidth, 244.1 Hz/pixel; MTC pulses, 300°, 1.2 kHz off resonance; and acquisition time, 3 minutes 12 seconds for 1 NEX and 15 minutes 58 seconds for 5 NEX. Denoising was applied to 1 NEX images using DLR algorithm (Advanced Intelligent Clear-IQ Engine [AiCE], Canon Medical Systems).7 The four patterns of DLR used in this study are provided in Table 1.
Image analysis and statistical analysis
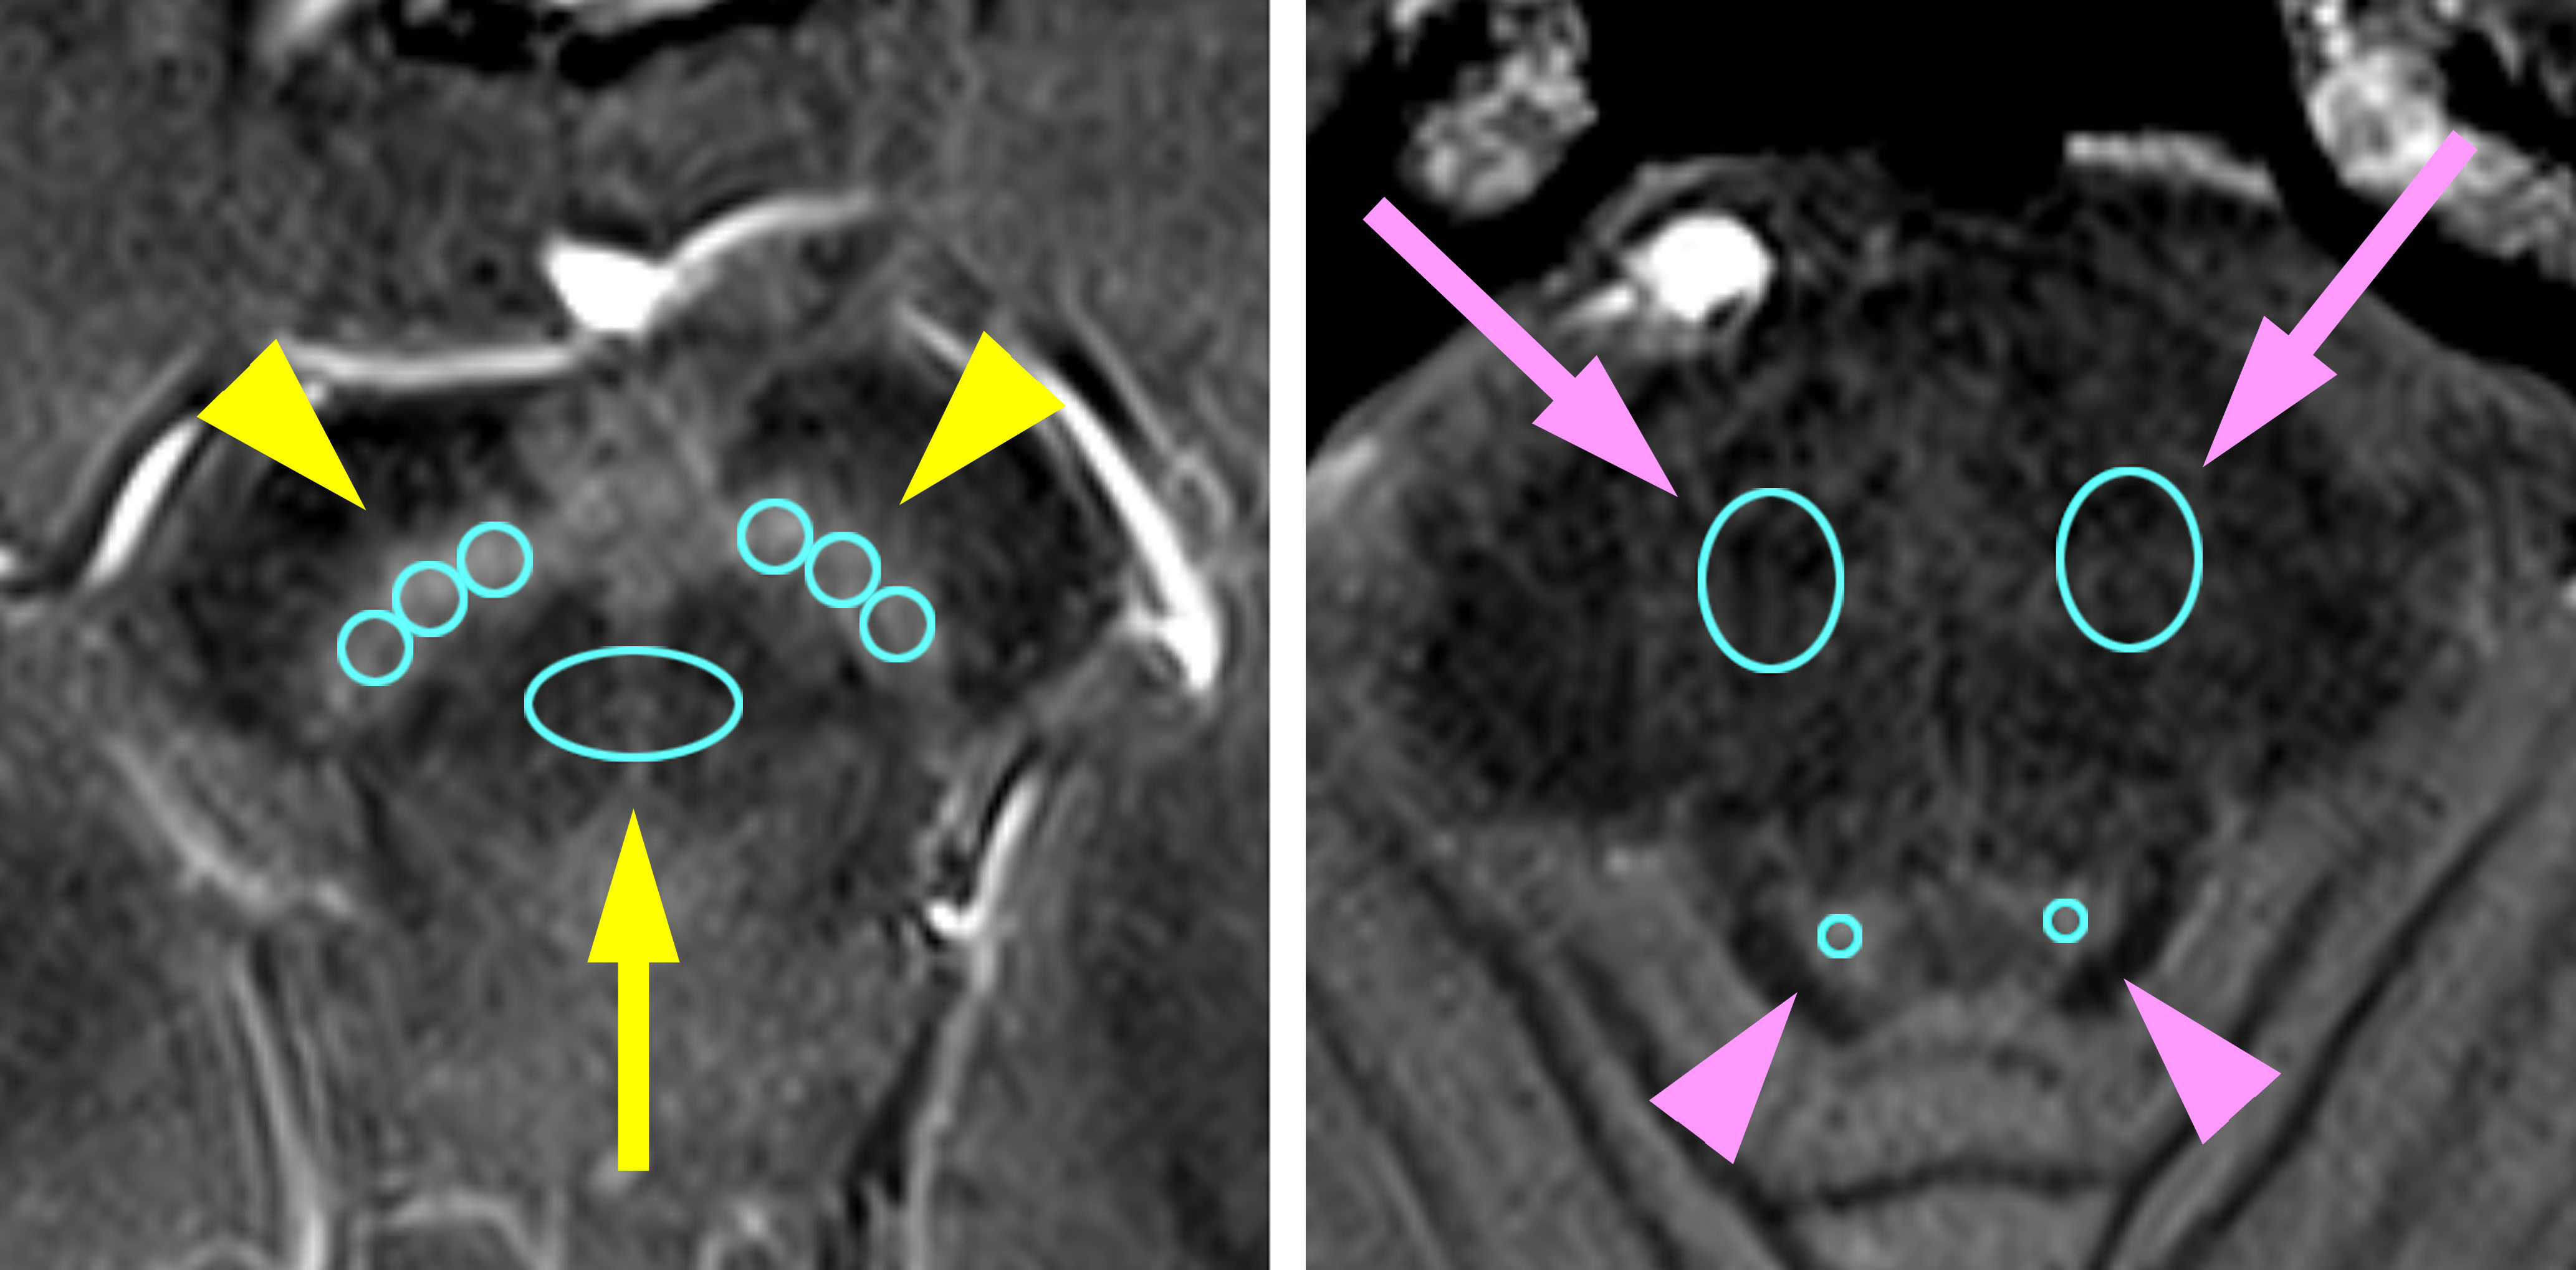
All the images were analyzed using ImageJ (National Institutes of Health, Bethesda, MD). ROIs of the SN, superior cerebellar peduncle (SCP), LC and pons were manually placed on the slices where the SN or LC was most clearly delineated (Figure 1). The shape and size of ROIs were the same in all the images. The SCP and pons were used as background areas for the SN and LC, respectively.
1. Image quality
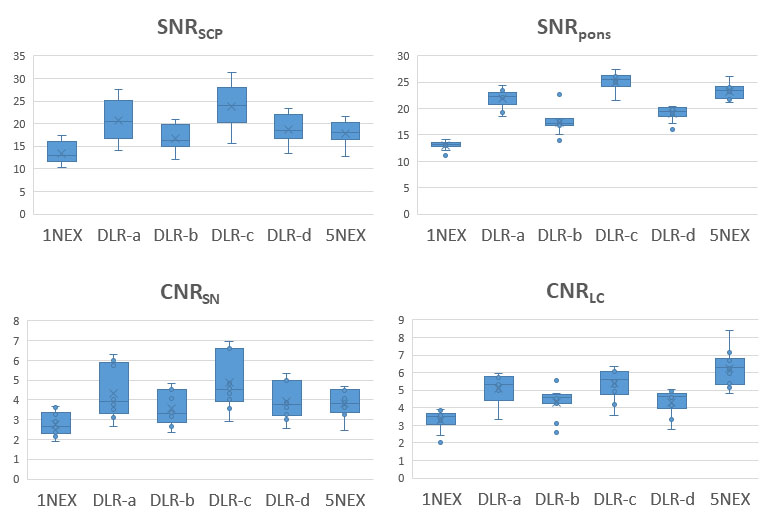
We evaluated image quality using images of healthy volunteers by calculating SNRSCP, SNRpons, CNRSN and CNRLC. They were defined as follows: SNRSCP = mean SISCP / SD of SISCP, SNRpons = mean SIpons / SD of SIpons, CNRSN = (mean SISN – mean SISCP) / SD of SISCP, and CNRLC = (mean SILC – mean SIpons) / SD of SIpons, where SI is signal intensity and SD is standard deviation. SNRs and CNRs were compared among 1 NEX without DLR, 1 NEX with DLR-a to DLR-d, and 5 NEX images using ANOVA with Bonferroni correction. P < 0.05 was considered statistically significant.
2. Diagnostic ability
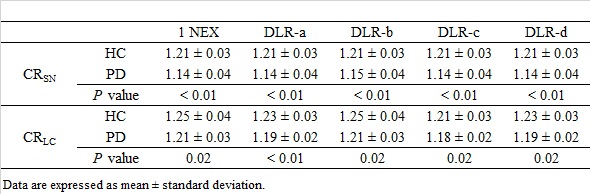
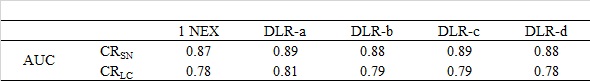
We calculated contrast ratios (CRs) as follows: CRSN = mean SISN / mean SISCP and CRLC = mean SILC / mean SIpons. We compared CRs between healthy control (HC) and PD groups using the Mann-Whitney U test, and performed receiver operating characteristic (ROC) analyses for differentiating patients with PD from HCs using images of 1 NEX without DLR and with DLR-a to DLR-d.
Results
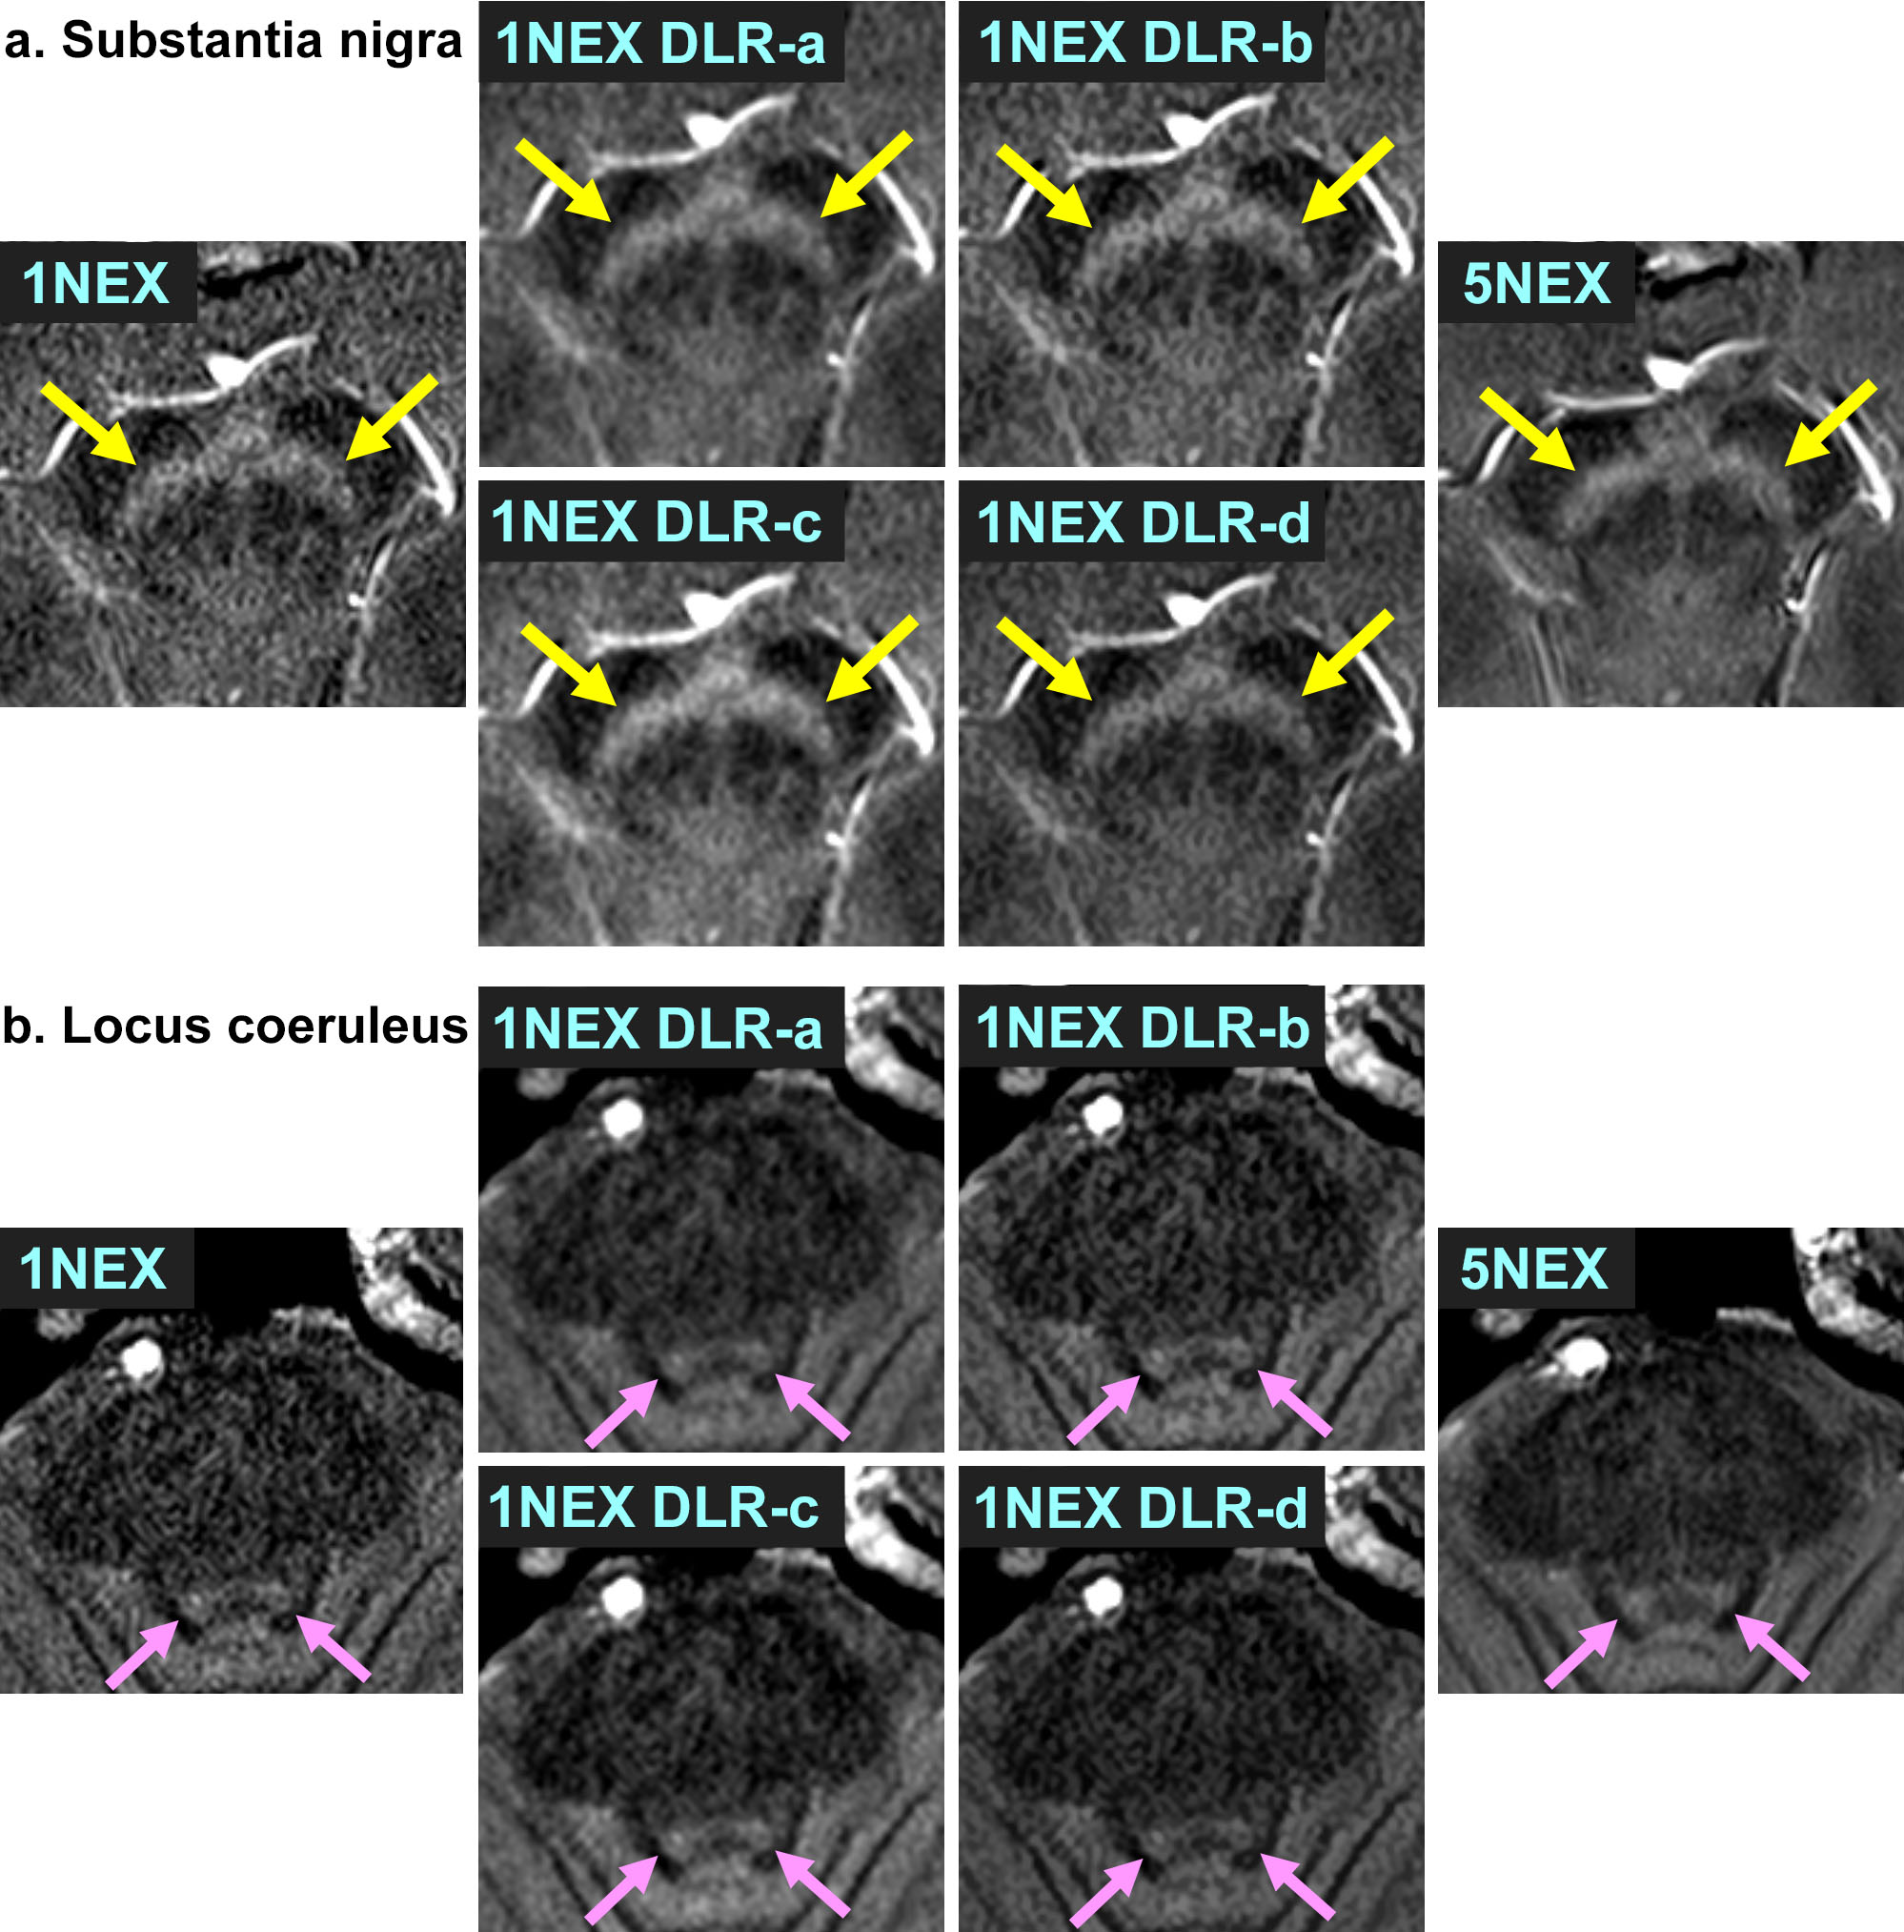
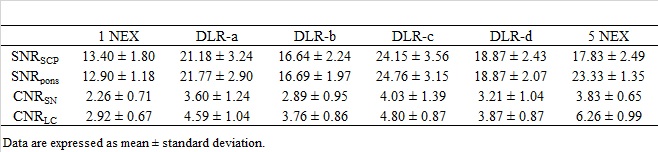
1. Image qualityImages of the SN and LC with 1 NEX without DLR, 1 NEX with DLR, and 5 NEX of a healthy volunteer are shown in Figure 2. The results of SNRs and CNRs are shown in Table 2 and Figure 3. DLR-c achieved the highest values among the four DLR patterns. SNRs and CNRs of DLR-c were significantly higher than those of 1 NEX without DLR. SNRSCP of DLR-c was significantly higher than that of 5 NEX. There was no significant difference in SNRpons, CNRSN and CNRLC between DLR-c and 5 NEX.
2. Diagnostic ability
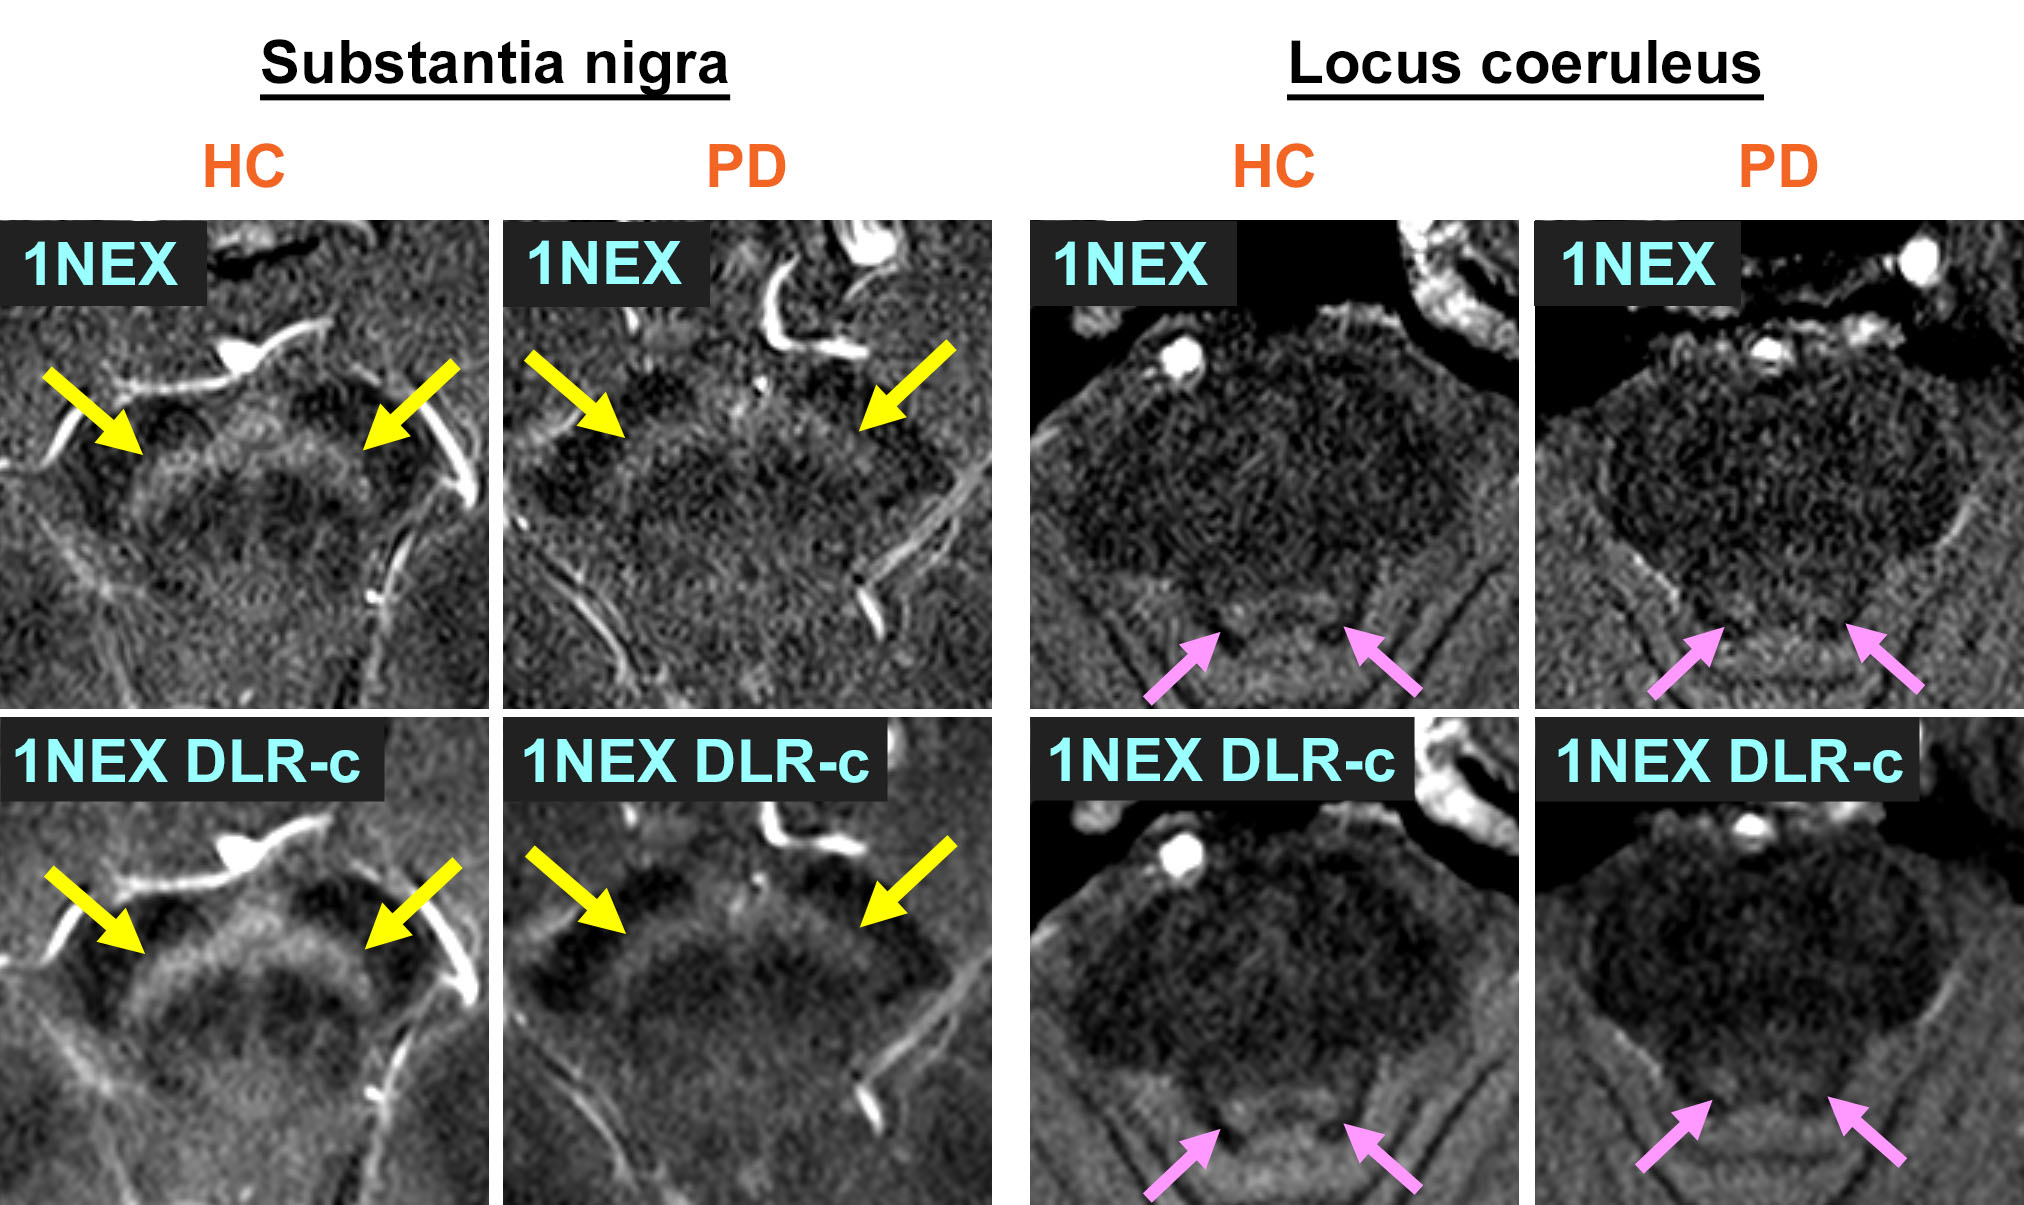
Figure 4 represents 1NEX images without DLR and with DLR-c of a HC and a patient with PD. The patient with PD shows decreased contrast of the SN and LC compared to the HC. The CRs of HCs were significantly higher than those of patients with PD for in all types of images (Table 3). All the images demonstrated good areas under the curve (AUCs) of ROC analyses (Table 4).
Discussion
We compared NM-MR images using DLR noise reduction with various parameters. Among the four patterns of DLR, DLR-c (denoising intensity coefficient, 1.0; edge enhancement, off) showed the best image quality. The SNRs and CNRs of DLR-c were significantly higher than or as high as 5 NEX images. The graphs in Figure 3 suggest that SNRs and CNRs become higher when images are reconstructed with higher denoising intensity coefficient and without edge enhancement. We also revealed that the images with all DLR patterns provided good diagnostic ability for PD. Our results suggest that this DLR technique enables scan time reduction of NM-MRI with good image quality and diagnostic ability.Conclusion
Among our four patterns of DLR for NM-MRI, DLR-c provided the best image quality. The reconstructed images showed good diagnostic ability for differentiation between patients with PD and HCs.Acknowledgements
No acknowledgement found.References
1. Sasaki M, Shibata E, Ohtsuka K, et al. Visual discrimination among patients with depression and schizophrenia and healthy individuals using semiquantitative color-coded fast spin-echo T1-weighted magnetic resonance imaging. Neuroradiology, 2010 Feb;52(2):83-9.
2. Cassidy CM, Zucca FA, Girgis RR, et al. Neuromelanin-sensitive MRI as a noninvasive proxy measure of dopamine function in the human brain. Proc Natl Acad Sci USA. 2019 Mar 12;116(11):5108-5117.
3. Trujillo P, Petersen KJ, Cronin MJ, et al. Quantitative magnetization transfer imaging of the human locus coeruleus. Neuroimage. 2019 Oct 15;200:191-198.
4. Nakane T, Nihashi T, Kawai H, et al. Visualization of neuromelanin in the substantia nigra and locus ceruleus at 1.5T using a 3D-gradient echo sequence with magnetization transfer contrast. Magn Reson Med Sci 2008;7(4):205-210.
5. Schwarz ST, Xing Y, Tomar P, et al. In vivo assessment of brainstem depigmentation in Parkinson disease: potential as a severity marker for multicenter studies. Radiology 2017;283(3):789-798.
6. Huddleston DE, Langley J, Sedlacik J, et al. In vivo detection of lateral-ventral tier nigral degeneration in Parkinson's disease. Hum Brain Mapp. 2017 May;38(5):2627-2634.
7. Kidoh M, Shinoda K, Kitajima M, et al. Deep Learning Based Noise Reduction for Brain MR Imaging: Tests on Phantoms and Healthy Volunteers. Magn Reson Med Sci. 2020 Aug 3;19(3):195-206.
Figures