2608
Discriminative Ensemble Average Propagator radial profiles along fixels of the centrum semiovale
Gabrielle Grenier1, François Rheault1,2, and Maxime Descoteaux1
1Sherbrooke Connectivity Imaging Lab (SCIL), Université de Sherbrooke, Sherbrooke, QC, Canada, 2Electrical Engineering, Vanderbilt University, Nashville, TN, United States
1Sherbrooke Connectivity Imaging Lab (SCIL), Université de Sherbrooke, Sherbrooke, QC, Canada, 2Electrical Engineering, Vanderbilt University, Nashville, TN, United States
Synopsis
The Ensemble Average Propagator (EAP) encapsulates the angular and radial information of the diffusion magnetic resonance imaging (MRI) process and can highlight complex characteristics of the underlying tissue microstructure. Here, by sampling EAP values along different radii of the 3-way crossing of the centrum semiovale, we discriminate the orientations of the corticospinal tract from the arcuate fasciculus and the corpus callosum. This process finds microstructure signatures of fiber elements (fixels) of interest. Better tractometry as well as better local direction selection in tractography algorithms could be achieved with this information.
Introduction
The Ensemble Average Propagator (EAP) describes the water diffusion in the white matter using diffusion MRI diffusion acquisitions. Under the narrow pulse assumption, the EAP represents the inverse Fourier transform of the diffusion signal attenuation1, 2, giving access to the radial and angular information of the diffusion signal3. Hence, one can extract a radial EAP profile along any orientation inside the voxel, also called fixel (fiber element)4. Indeed, white-matter anomalies caused by demyelination or brain damage can affect the radial part of the diffusion signal5, 6. Moreover, recent works have attempted to use the EAP features for streamline-based iterative tractography7, 8. In this work, a method is proposed to discriminate bundles by searching for fixel differences highlighted by the EAP radial profiles reconstructed with the Mean Apparent Propagator (MAP) MRI9. We show that the curves of the EAP sampled along a direction can discriminate the 3-way crossing of three well-known bundles (corpus callosum - CC, corticospinal tract - CST, arcuate fasciculus - AF) in the centrum semiovale region of interest.Methods
We selected two healthy brain databases. Ten subjects are randomly sampled from the HCP datasets, with a spatial resolution of 1.25mm isotropic, 90 directions for each shell b=1000,2000,3000 mm²/s and 18 b=0 images10. To test the method on usual multi-shell acquisitions, the 13 subjects of Penthera 3T are used, which has spatial resolution of 1.8mm isotropic, 7 b=0 images, 3 shells at b=300, 1000, 2000 mm²/s with respectively 8, 32, 60 directions11. Tractoflow12 is applied to process the DWI acquisitions. Two regions of interest in the centrum semiovale, shown in Figure 1, of three crossing bundles (AF, CC, CST) are selected based on the tractography outputs from Bundle Specific Tractography (BST)13. To obtain the average direction of a fixel, a track orientation density imaging14 is applied in the ROIs from the BST streamlines (Figure 2). The MAP MRI reconstruction is used to compute the EAP profile along that direction as shown in Figure 3. The anisotropic basis is selected for a better signal fitting with a laplacian regularization, a positivity constraint and the expansion order of the basis is set at 615. For the given angles corresponding to the orientation of a fixel, EAP values are computed for radii starting at 0mm (center of a voxel) to 0.025mm. The mean EAP profile and the standard deviation (Figure 4) of a bundle is then computed, for all the subjects, with the results obtained from all the fixels corresponding to the bundle.Results
Figure 4 A-B shows that, for the 10 subjects of the HCP data, the CST has a mean EAP profile (blue curve) that stands out from the AF’s (green curve) and the CC’s (red curve) for both right and left ROIs between 3 and 12 μm. However, the difference for the right ROI (Figure 4B) is not as pronounced as the left (Figure 4A) one where the curve and the standard deviation along the curve are completely exterior of the AF and CC ones. The AF standard deviation around 5 μm is more important than the other two bundles. For both datasets, the difference of the CST EAP profile is more meaningful for the left ROI and the CC and AF EAP profile are very similar. Nonetheless, the Penthera 3T dataset (Figure 4C-D) is less conclusive than the HCP one. Indeed, the mean CST EAP profile is higher but it is not as visible due to the bigger standard deviation.Discussion
The advantage of the EAP reconstruction from multi-shell diffusion acquisitions is to have both radial and angular information of the diffusion signal. However, most EAP applications marginalize this probability function depending on the radius, usually by using an ODF or metrics such as return-to-the-origin probability (RTOP), return-to-the-axis probability (RTAP) and return-to-the-plane probability (RTPP)16. This potentially rich radial information is lost and some benefits of the multi-shell acquisitions too17. This work proposes to use the angular and radial information of the diffusion process by comparing the EAP profile between bundles with the MAP MRI method which is feasible and could turn out to be viable for clinical applications18. This preliminary study suggests that the CST has a different EAP profile than the CC and AF, probably due to its microstructure features. However, more realistic and clinically feasible acquisitions seem to smooth out this discriminative difference as seen with the Penthera 3T datasets, which may suggest that higher b-values are necessary for the EAP to capture more microstructural differences. Also, the high standard deviation of the AF could mean a more important sensitivity to the direction of the sampled EAP values or a heterogeneity of the underlying associative fiber tracts traversing the same fixel in this potential bottleneck19.Conclusion
Using the radial information of the EAP without marginalizing it gives additional information helping discriminate fixels of different bundles for potential applications such as tractography or tractometry. For both high quality and usual multi-shell datasets, the results of this method are promising.Acknowledgements
The authors would like to thank the Fonds de recherche du Québec – Nature et technologies (FRQNT) and Natural Sciences and Engineering Research Council of Canada (NSERC). We also thank the Université de Sherbrooke institutional chair in neuroinformatics for their support and wethank NSERC Discovery grant from Pr Descoteaux.References
- Stejskal, E. O., & Tanner, J. E. (1965). Spin diffusion measurements: spin echoes in the presence of a time‐dependent field gradient. The journal of chemical physics, 42(1), 288-292.
- Callaghan, P. T. (1993). Principles of nuclear magnetic resonance microscopy. Oxford University Press on Demand.
- Descoteaux, M., Deriche, R., Le Bihan, D., Mangin, J. F., & Poupon, C. (2011). Multiple q-shell diffusion propagator imaging. Medical image analysis, 15(4), 603-621.
- Raffelt, D. A., Smith, R. E., Ridgway, G. R., Tournier, J.-D., Vaughan, D. N., Rose, S., Henderson, R., & Connelly, A. (2015). Connectivity-Based Fixel Enhancement: Whole-Brain Statistical Analysis of Diffusion MRI Measures in the Presence of Crossing Fibres. NeuroImage.
- Cohen, Y., & Assaf, Y. (2002). High b‐value q‐space analyzed diffusion‐weighted MRS and MRI in neuronal tissues–a technical review. NMR in Biomedicine: An International Journal Devoted to the Development and Application of Magnetic Resonance In Vivo, 15(7‐8), 516-542.
- King, M. D., Houseman, J., Roussel, S. A., Van Bruggen, N., Williams, S. R., & Gadian, D. G. (1994). q‐Space imaging of the brain. Magnetic resonance in medicine, 32(6), 707-713.
- Merlet, S., Philippe, A. C., Deriche, R., & Descoteaux, M. (2012, October). Tractography via the ensemble average propagator in diffusion mri. In International Conference on Medical Image Computing and Computer-Assisted Intervention (pp. 339-346). Springer, Berlin, Heidelberg.
- Girard, G., Fick, R., Descoteaux, M., Deriche, R., & Wassermann, D. (2015, June). AxTract: microstructure-driven tractography based on the ensemble average propagator. In International Conference on Information Processing in Medical Imaging (pp. 675-686). Springer, Cham.
- Özarslan, E., Koay, C. G., Shepherd, T. M., Komlosh, M. E., İrfanoğlu, M. O., Pierpaoli, C., & Basser, P. J. (2013). Mean apparent propagator (MAP) MRI: a novel diffusion imaging method for mapping tissue microstructure. NeuroImage, 78, 16-32.
- Sotiropoulos, S. N., Jbabdi, S., Xu, J., Andersson, J. L., Moeller, S., Auerbach, E. J., ... & Feinberg, D. A. (2013). Advances in diffusion MRI acquisition and processing in the Human Connectome Project. Neuroimage, 80, 125-143.
- Paquette, M., Gilbert, G., Descoteaux, M. (2019). Penthera 3t. https://doi.org/10.5281/zenodo.2602049.
- Theaud, G., Houde, J. C., Boré, A., Rheault, F., Morency, F., & Descoteaux, M. (2020). TractoFlow: A robust, efficient and reproducible diffusion MRI pipeline leveraging Nextflow & Singularity. NeuroImage, 116889.
- Rheault, F., St-Onge, E., Sidhu, J., Maier-Hein, K., Tzourio-Mazoyer, N., Petit, L., & Descoteaux, M. (2019). Bundle-specific tractography with incorporated anatomical and orientational priors. NeuroImage, 186, 382-398.
- Dhollander, T., Emsell, L., Van Hecke, W., Maes, F., Sunaert, S., & Suetens, P. (2014). Track orientation density imaging (TODI) and track orientation distribution (TOD) based tractography. NeuroImage, 94, 312-336.
- Garyfallidis E, Brett M, Amirbekian B, Rokem A, van der Walt S, Descoteaux M, Nimmo-Smith I and Dipy Contributors (2014). DIPY, a library for the analysis of diffusion MRI data. Frontiers in Neuroinformatics, vol.8, no.8
- Zucchelli, M., Brusini, L., Méndez, C. A., Daducci, A., Granziera, C., & Menegaz, G. (2016). What lies beneath? Diffusion EAP-based study of brain tissue microstructure. Medical image analysis, 32, 145-156.
- Aja-Fernández, S., de Luis-García, R., Afzali, M., Molendowska, M., Pieciak, T., & Tristán-Vega, A. (2020). Micro-structure diffusion scalar measures from reduced MRI acquisitions. Plos one, 15(3), e0229526.
- Avram, A. V., Sarlls, J. E., Barnett, A. S., Özarslan, E., Thomas, C., Irfanoglu, M. O., ... & Basser, P. J. (2016). Clinical feasibility of using mean apparent propagator (MAP) MRI to characterize brain tissue microstructure. NeuroImage, 127, 422-434.
- Maier-Hein, K. H., Neher, P. F., Houde, J. C., Côté, M. A., Garyfallidis, E., Zhong, J., ... & Reddick, W. E. (2017). The challenge of mapping the human connectome based on diffusion tractography. Nature communications, 8(1), 1-13.
Figures
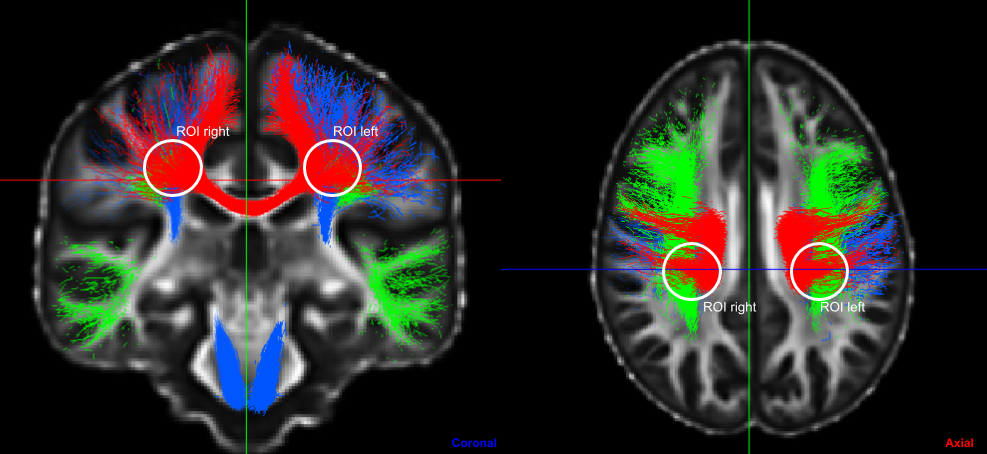
Figure 1 - Coronal and axial view of the template from BST (Bundle-Specific Tractography) and circled centrum semiovale ROIs containing three crossing fibers: arcuate fasciculus (AF) in green, corpus callosum (CC) in red and corticospinal tract (CST) in blue.
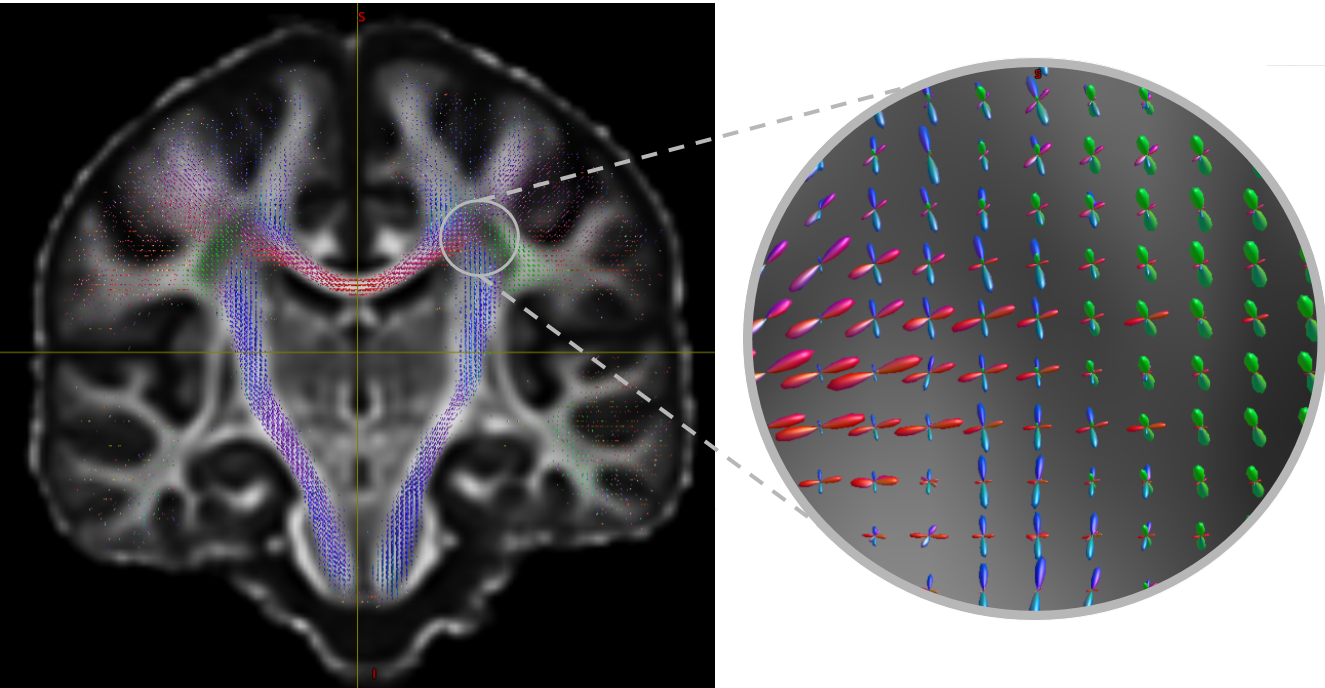
Figure 2 - Coronal view of the TODI results for the BST template with a zoom on the left centrum semiovale region with colors matching the anatomy.
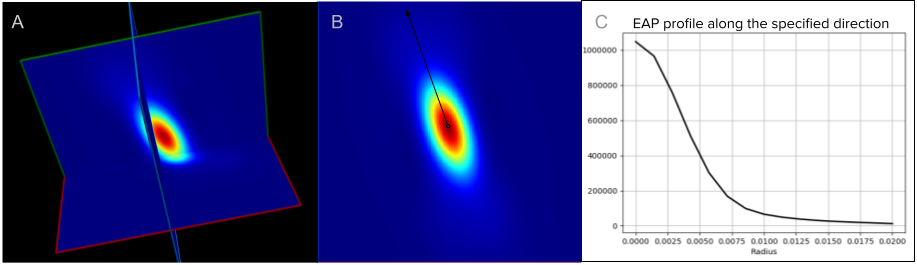
Figure 3 - Example of EAP reconstruction with MAP MRI of a single fiber population voxel of one subject from the HCP dataset. (A) 3D of the EAP reconstruction. (B) A 2D slice of the EAP. The black axis represents the orientation of the fiber population in the voxel (fixel). (C) Graph of the EAP profile computed from the angles of the fixels’ orientation at different radii in mm starting at 0mm to 0.020mm in this example.
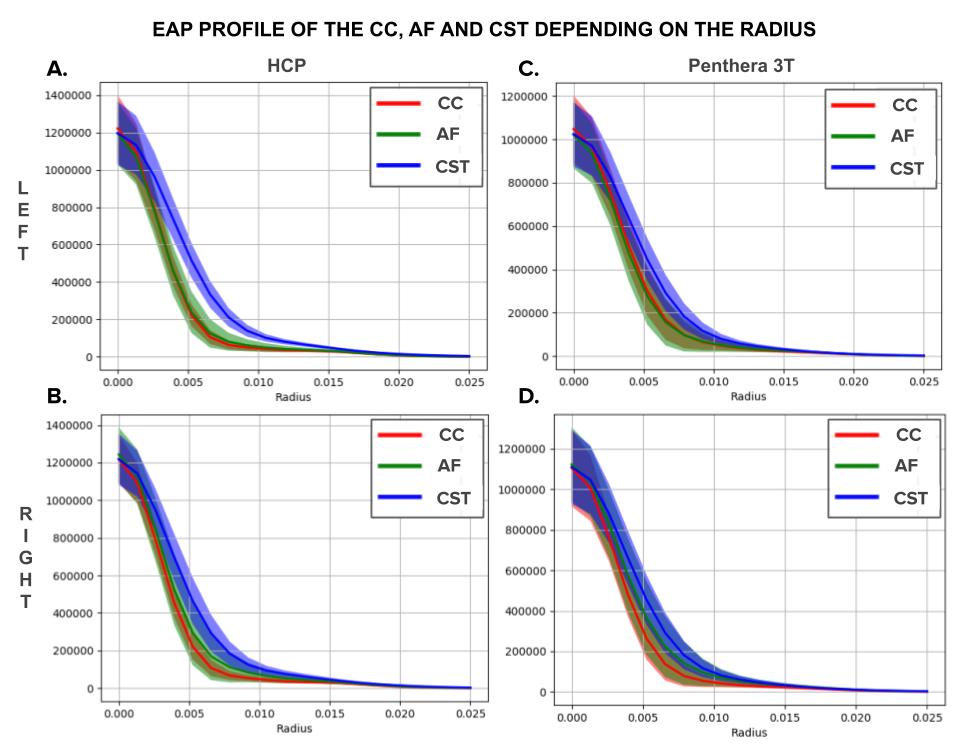
Figure 4 - Columns: EAP profiles of the three bundles depending on the database (HCP and Penthera 3T). Rows: EAP profiles depending on the region of interest (left or right).