2606
Augmented T1 weighted (aT1W) contrast imaging1UIH America, Inc., Houston, TX, United States, 2United Imaging Healthcare, Shanghai, China
Synopsis
In this work, we propose a robust and effective method of an accentuated T1 weighted (aT1W) method. By dividing T1W images by proton density weighted (PDW) images, both obtained using GRE but with different flip angles, the resultant aT1W images offer improved level of T1 contrast. By adopting the multi-dimensional integration (MDI) technique, aT1W images have high signal-to-noise ratio (SNR) despite the use of division operation.
Introduction
Recently a T1W enhanced contrast (T1WE) method was proposed in the context of multi-contrast imaging1,2. By scanning a 3D GRE sequence with two flip angles (e.g. 6° and 24°), both PDW and T1W images can be obtained. And by defining a T1WE signal as the signal difference between these T1W and PDW signals, T1 contrast can be enhanced1,2. However, spatial inhomogeneity in both transmitting (B1t) and receiving (B1r) RF fields are still in effect after subtraction, affecting the uniformity of resultant images. The T1WE images are calculated based on coil-combined images, with both the subtraction and coil-combination (e.g. sum-of-square) leading to compromise in SNR. Last but not the least, signal subtraction can lead to erroneous image contrast depending on the choice of flip angles.In this work, we propose an augmented T1W (aT1W) technique to achieve computationally enhanced T1 contrast while addressing all the above issues of T1WE. By using division instead of subtraction, as well as incorporating the multi-dimensional integration (MDI) method3, the aT1W images offers improved and robust T1 contrast, as well as superior image SNR over arbitrary scanning parameters.
Methods
The ISS signal of a GRE sequence is4:$$S(\alpha)=C\frac{(1-E_{1})\sin(\alpha)}{1-E_{1}\cos(\alpha)}e^{-TE/T_2^*} [1]$$
Where α is the flip angle, C the coil sensitivity, TE/TR the echo/repetition times, and $$$E_{1}=e^{-TR/T_1}$$$. For simplicity, the baseline signal is assumed to be 1 and ignored. We define the aT1W signal as:
$$S_{aT1W}\equiv\frac{S(\alpha_{2})}{S(\alpha_{1})}=\frac{sin(\alpha_{2})}{sin(\alpha_{1})}\bullet\frac{1-E_{1}\cos(\alpha_{1})}{1-E_{1}\cos(\alpha_{2})} [2]$$
Notice that the terms of coil sensitivity and the T2* decay, i.e. C and $$$e^{-TE/T_2^*}$$$, are both cancelled out in Eq.2, indicating SaT1W is independent of coil sensitivity and echo time. To incorporate the MDI strategy for SaT1W calculation on multi-channel GRE data, one can construct and solve the following optimization problem3:
$$ min_{S_{aT1W}}\sum_1^{N_{c}} \parallel S(\alpha_{2})-S(\alpha_{2})\bullet S_{aT1W}\parallel _2^2 [3]$$
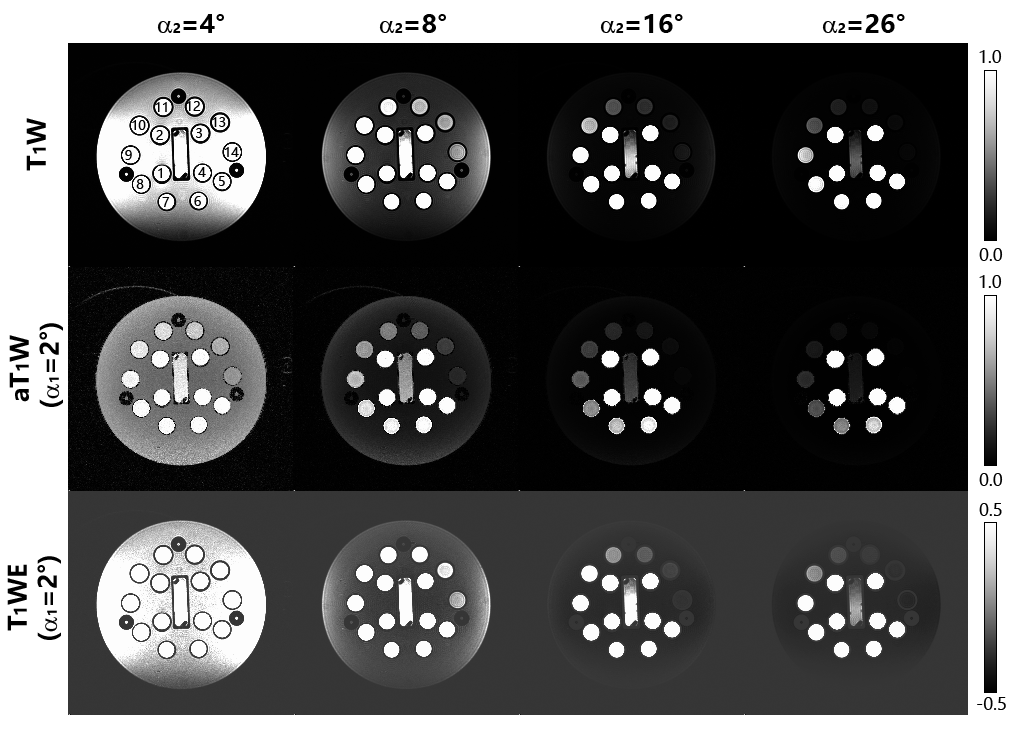
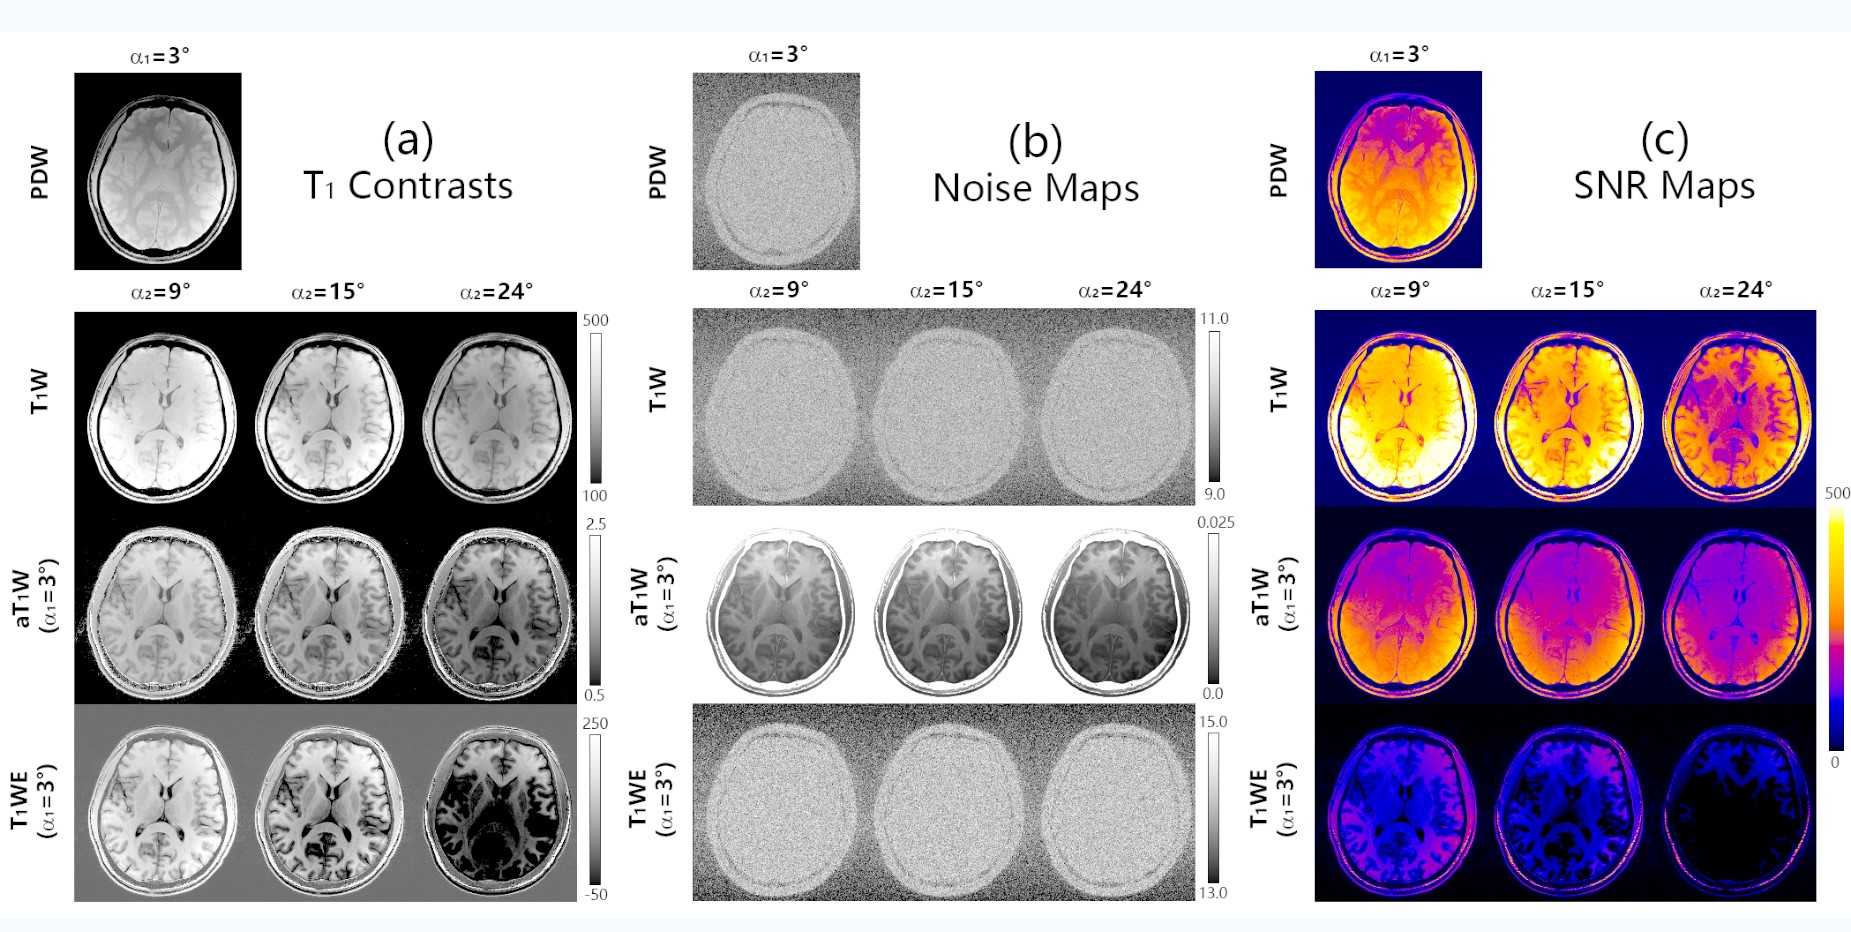
A quantitative phantom (CaliberMRI, Colorado, USA) was used for well-controlled T1 properties. Phantom T1W data were acquired using 3D GRE on a 3T system (uMR 790, UIH, Shanghai, China), with a 24-channel head coil. Key scanning parameters included TE/TR =4.9/12.1ms, α1=2° and α2 = 4°/8°/16°/26°. With local IRB permission, five healthy volunteers were recruited for brain scans with written consents and passing MRI safety screening. Similarly, single-echo 3D GRE was scanned with: TR/TE=12.1/5.5ms, α1=3° and α2=9°/15°/24°, 1mm isotropic voxels with matrix size of 224×190×96 for full brain coverage. Noise propagation maps and SNR maps were also determined for T1W, aT1W and T1WE, as described above. SNR and noise propagation from k-space to the final T1W/aT1W/T1WE images was evaluated in a Monte Carlo manner.
Results
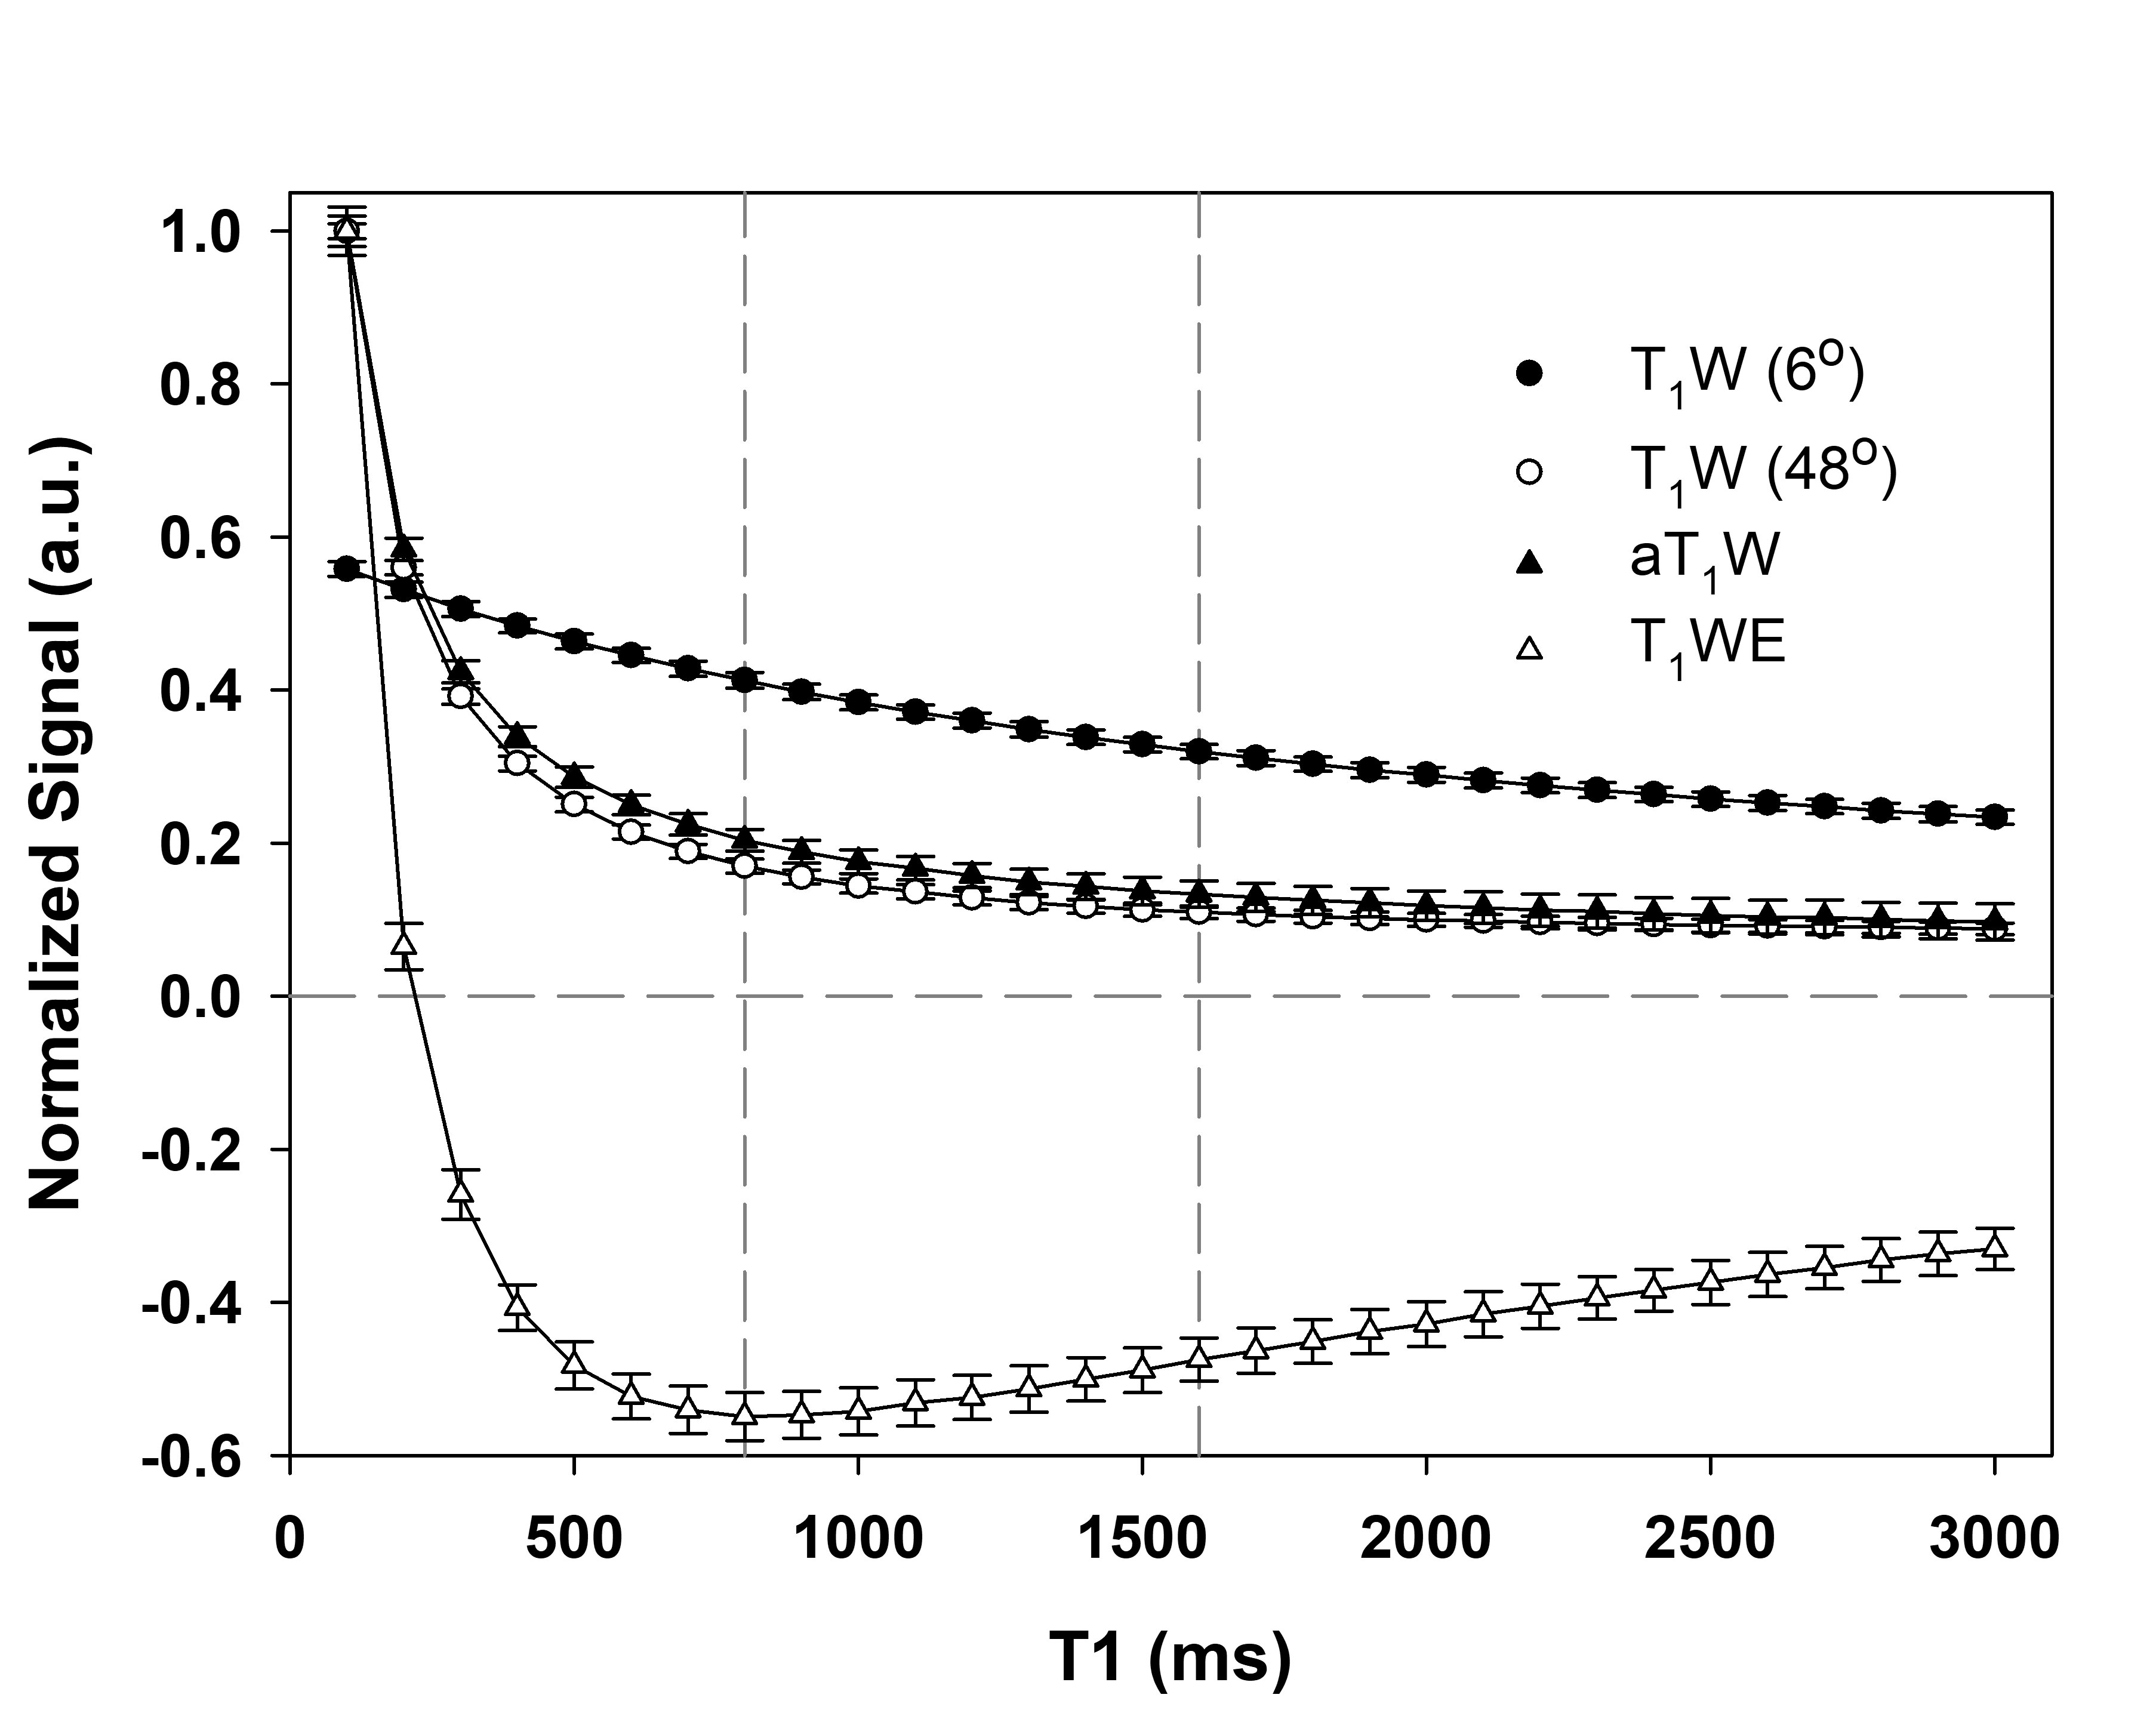
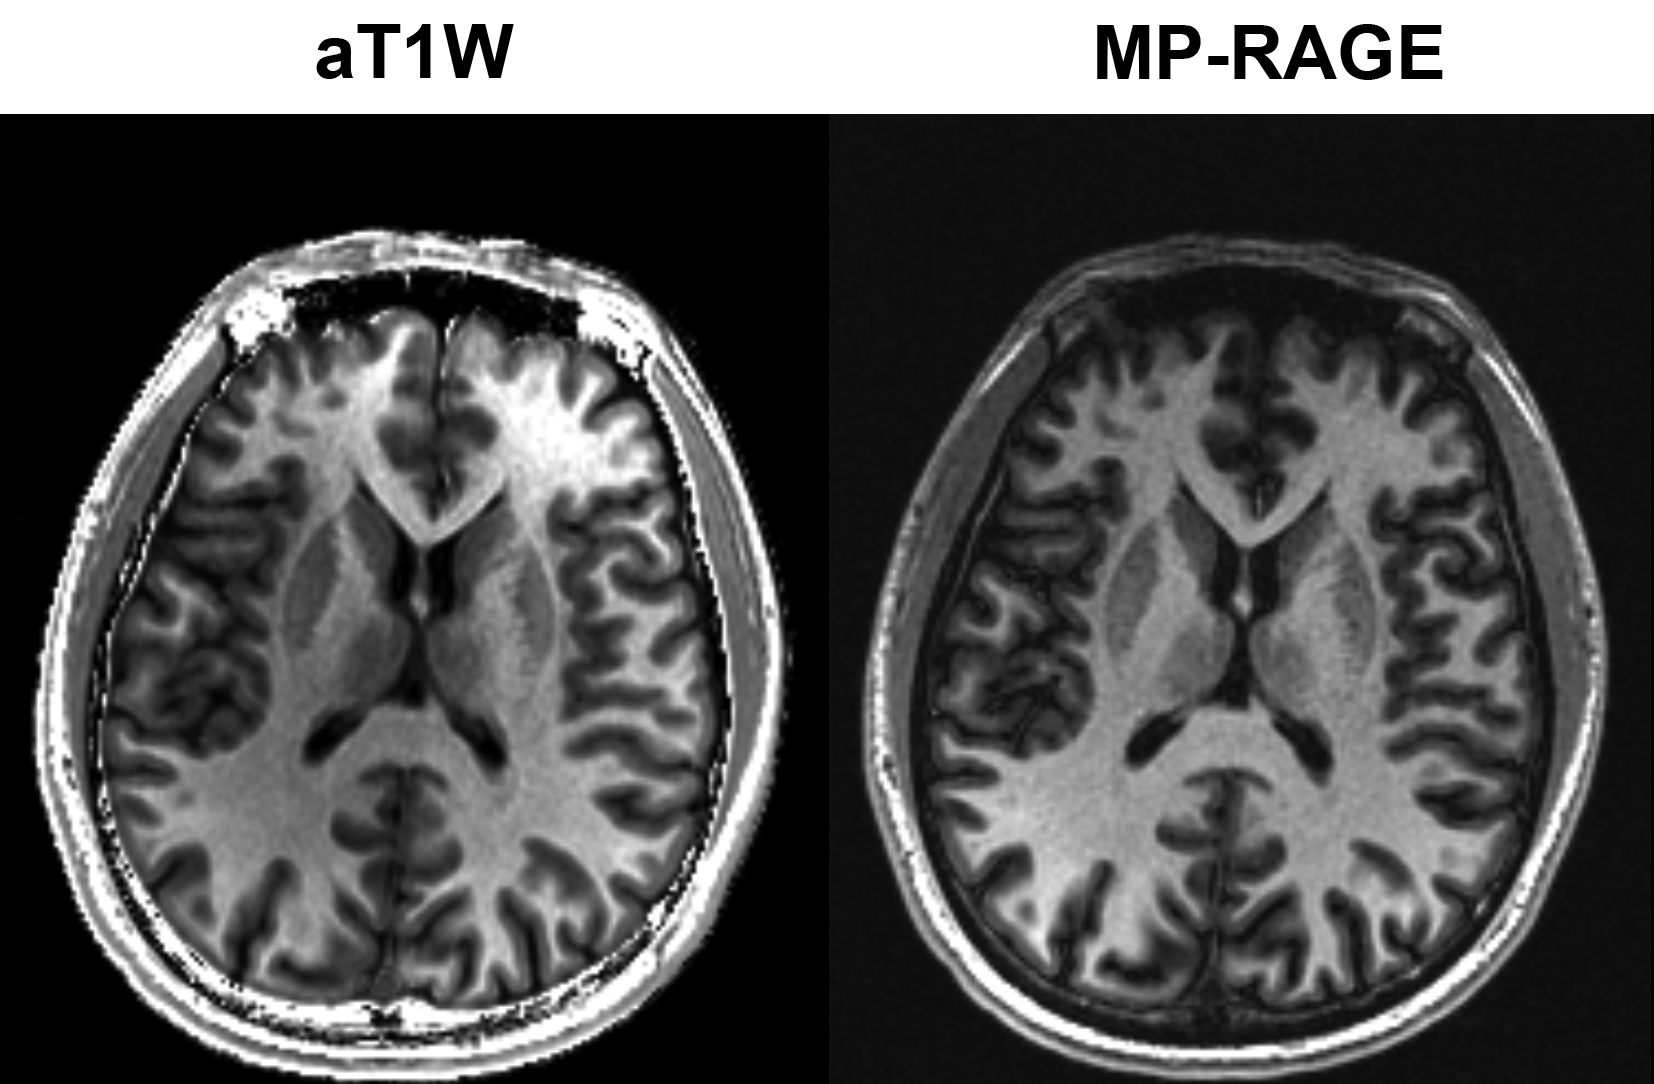
Fig.1 shows simulated signal curves as function of T1, where aT1W curve was located between PDW and T1W curves. Both aT1W and T1W curves were monotonic, while the T1WE curve was non-monotonic. Fig.2 shows phantom images, where 2° flip angle (i.e. α1) yielded PDW images and higher flip angles (i.e. α2) for T1W images. Fig.3 shows the T1 contrast comparison of brain scans, with additional comparison on noise propagation and SNR maps. For both phantom and brain scans, higher α2 led to stronger contrasts for all results. aT1W image remained homogeneous regardless for all α2 results, while T1W and T1WE images were non-uniform. Also, there were zero or even negative values in T1WE images. It is more clearly shown in Fig.3 that the SNR maps of aT1W were insensitive to the choice of flip angles, while those of T1W and T1WE varied by flip angles. Fig.4 indicates that aT1W images has very similar T1 contrast to T1 FLAIR.Discussion & Conclusion
The reasons for the proposed aT1W method to achieve improved T1 contrast are two-fold: yielding pure T1 weighting effects via removal of non-T1 effects, and SNR boost via the complex signal MDI processing strategy4. The intrinsic aT1W contrast (i.e. $$$\frac{1-E_{1}\cos(\alpha_{1})}{1-E_{1}\cos(\alpha_{2})}$$$) is no stronger than the intrinsic T1W contrast (i.e. $$$\frac{1-E_{1}}{1-E_{1}\cos(\alpha_{2})}$$$) as indicated in Fig.1. However, GRE signals are also modulated by proton density, T2* relaxation, and receiver coil sensitivity and B1 fields. Such non-T1 effects are all present in T1W and T1WE signals while being mostly removed in aT1W signals. Therefore, the observed contrast improvement in aT1W stems from the removal of non-T1 effects, including PD, T2* and coil sensitivity effects, thus revealing pure T1 weightings. Both aT1W and T1W signals are monotonic to produce correct T1 contrast regardless of scanning parameters. However, T1WE signals display non-monotonic behaviors, depending on T1 values and the flip angle α2. Although offering exceptional contrasts in short T1 ranges, the T1WE contrast quickly diminishes and even become negative at longer T1 values. Therefore, restriction on the choice of flip angles and employing B1 field correction3 will be required for T1WE, which poses limitations on potential applications. As MDI is most fit for use with division operation3, it can be directly applied for calculation of aT1W for SNR boost and efficient computation.In conclusion, we have proposed an aT1W contrast based on simple division operation. With the use of MDI technique, aT1W images offer improved and homogeneous T1 contrast, high SNR and consistent performance over arbitrary imaging parameters. It can be beneficial in the context of multi-contrast imaging techniques, as well as any clinical application involving T1 contrast.
Acknowledgements
No acknowledgement found.References
1. Chen Y, Liu S, Wang Y, Kang Y, Haacke EM. STrategically Acquired Gradient Echo (STAGE) imaging, part I: Creating enhanced T1 contrast and standardized susceptibility weighted imaging and quantitative susceptibility mapping. Magn Reson Imaging 2018;46:130-139.
2. Wang Y, Chen Y, Wu D, Wang Y, Sethi SK, Yang G, Xie H, Xia S, Haacke EM. STrategically Acquired Gradient Echo (STAGE) imaging, part II: Correcting for RF inhomogeneities in estimating T1 and proton density. Magn Reson Imaging 2018;46:140-150.
3. Haacke EM, Brown R, Thompson M, Venkatesan R. Magnetic resonance imaging. Physical principles and sequence design. New York: Wiley-Liss; 1999. 32-45 p.
4. Yongquan Y, Jingyuan L. MR Relaxivity Mapping using multi-dimensional integrated (MDI) complex signal ratio. 2019; Montreal. p 1356.
Figures