2595
Feasibility of Arterial Spin Labeling for Detection of Longitudinal Changes in Perfusion in Elderly and Frontotemporal Dementia Patients1Lawson Health Research Institute, London, ON, Canada, 2Department of Medical Biophysics, Western University, London, ON, Canada, 3Fraunhofer Institute for Medical Image Computing MEVIS, Bremen, Germany, 4Department of Clinical Neurological Sciences, Western University, London, ON, Canada
Synopsis
Recent advances in the understanding of frontotemporal dementia (FTD) and subsequently, the development of novel disease modifying treatments, has stimulated the need for tools to assess treatment efficacy. While perfusion imaging by arterial spin labeling (ASL) is an attractive approach, its sensitivity to detect longitudinal changes in perfusion in dementia patients remains unknown. Longitudinal variability in perfusion was assessed on a voxel-by-voxel basis over a month. Power analysis revealed ASL has the sensitivity to longitudinal changes as low as 7-8%. These results highlight the potential of ASL for detecting longitudinal changes in FTD populations.
Introduction
Frontotemporal dementia (FTD) is a devastating neurodegenerative disease characterized by rapid decline in behavioural, language and motor abilities1. Recent advances in the understanding of FTD genetics and pathophysiology and subsequently, the development of novel disease modifying treatments, has stimulated the need for tools to assess the efficacy of these therapies2. While structural imaging and functional imaging by FDG-PET are clinically used for diagnostic purposes, structural changes are subtle at the early stages and PET imaging is expensive and access limited3–5. Perfusion imaging by arterial spin labeling (ASL) is an attractive alternative given the intrinsic coupling between blood flow and brain activity6. In fact, studies have demonstrated that these functional changes precede structural changes, and furthermore, it can differentiate presymptomatic carriers from healthy controls3,7. However, there is limited work that assesses its sensitivity to detect longitudinal changes in perfusion. Establishing a baseline perfusion change that can be accurately detected would help delineate changes in perfusion are related to physiological processes and sources of variability, such as transit time errors and day-to-day fluctuations in perfusion. Accordingly, the aim of this study was to quantify longitudinal variability in perfusion on a voxel-by-voxel basis over a month. This length of time was selected since it is long enough to resemble a typical clinical trial, but short enough that disease-related perfusion changes would be minimal.Methods
Data were acquired from 12 healthy controls (63 ± 9 yrs, 8M/4F), and 6 patients (70 ± 10, 4M/2F) on a Siemens Biograph mMR scanner. The patient group included individuals from a variety of FTD subtypes. To minimize day-to-day variability in global perfusion, scans were scheduled around the same time of day and participants were instructed to refrain from caffeine 8 hours prior to the scan. ASL data (PCASL-GRASE8, TR/TE: 4500/22.14ms, post-labeling delay: 2s, labeling duration: 1.8s, voxel size: 4x4x4mm3) were acquired during 2 scanning sessions separated by approximately 4 weeks (25 ± 4 days). During the first session, the ASL scan was repeated twice to measure within-session reproducibility. A third scan was collected during the second session to assess between-session variability. A calibration (M0) image was acquired with TR = 7s. ASL data were motion corrected and smoothed by a 6mm gaussian filter. Perfusion was calculated using a one compartment model using the oxasl pipeline in FSL9. The degree of similarity among same-day (within-session), month separated (between-session) and between-subject measurements were characterized by the coefficient of variation (CV). To assess the effect of day-to-day fluctuations in perfusion, variability was assessed using absolute and relative (normalized to whole brain CBF) perfusion. Power analysis was performed to determine the minimum detectable difference in a longitudinal study.Results
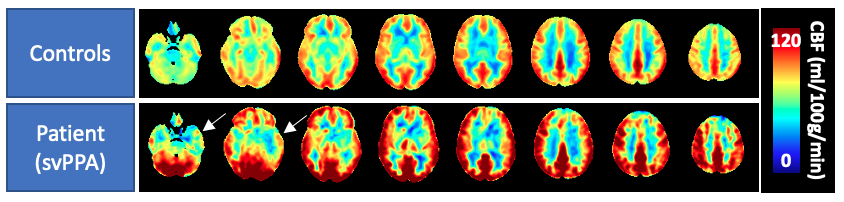
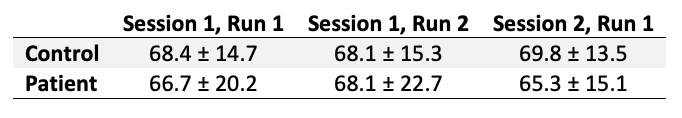
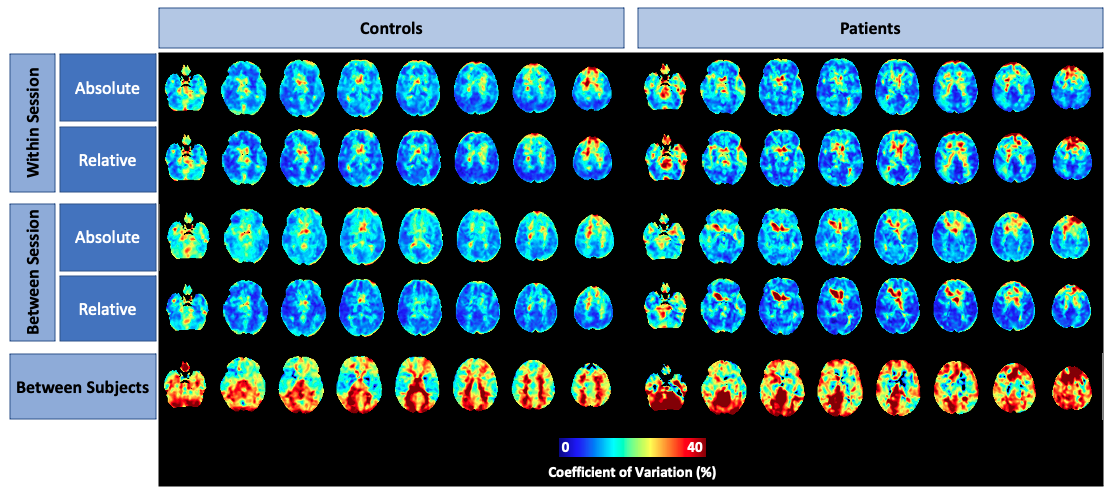
Perfusion averaged among healthy controls and one exemplary patient showed the expected regional variation (Figure 1). Grey matter perfusion acquired during the 3 scanning sessions is summarized in Figure 2. Voxel-by-voxel CV maps for patients and controls are shown in Figure 3. Absolute within- and between-session variability in grey matter were 14.2 and 15.9% in controls and 14.4 and 15.1% in patients. Following intensity normalization, the values changed to 13.2 and 12.4% in controls and 14.9 and 13.2% patients.Discussion/Conclusion
This work demonstrated the sensitivity of ASL for longitudinal monitoring in elderly populations. In both patients and controls, differences in repeat measures of perfusion was small: same-day and month-separated grey matter perfusion measurements were within 2% of each other (Figure 2). Additionally, variability measurements in patients and controls were similar, with both showing increased variability in white matter and CSF regions. The increased asymmetry in between-subject variability in patients relative to controls highlights variability among patients due to the heterogeneity of FTD. Between-session variability was not substantially greater than within-session variability, as indicated by grey matter estimates. In general, intensity normalization reduced grey matter CV; however, this effect was modest. Voxel-by-voxel power analysis revealed that with a sample size of 20, ASL has the sensitivity to detect an ~8% and ~7% using absolute and relative perfusion, respectively. This is comparable to previous studies including those involving younger participants 10–12. Future studies will involve comparing regional variability between patients and controls as well as assessing the effects of transit time errors.Acknowledgements
This work is supported by: Frederick Banting and Charles Best Canada Graduate Doctoral Award, Canadian Institutes of Health Research Grant and Alzheimer’s Drug Discovery Foundation Grant.References
1. Josephs, K. A. Frontotemporal dementia and related disorders: Deciphering the enigma. Ann. Neurol. 64, 4–14 (2008).
2. Logroscino, G. et al. Promising therapies for the treatment of frontotemporal dementia clinical phenotypes: from symptomatic to disease-modifying drugs. Expert Opin. Pharmacother. 20, 1091–1107 (2019).
3. Olm, C. A. et al. Arterial spin labeling perfusion predicts longitudinal decline in semantic variant primary progressive aphasia. J. Neurol. 263, 1927–1938 (2016).
4. Verfaillie, S. C. J. et al. Cerebral perfusion and glucose metabolism in Alzheimer’s disease and frontotemporal dementia: two sides of the same coin? Eur. Radiol. 25, 3050–9 (2015).
5. Gossye, H., Van Broeckhoven, C. & Engelborghs, S. The use of biomarkers and genetic screening to diagnose frontotemporal dementia: Evidence and clinical implications. Front. Genet. 10, 1–18 (2019).
6. Alsop, D. C. et al. Recommended implementation of arterial spin-labeled perfusion MRI for clinical applications: A consensus of the ISMRM perfusion study group and the European consortium for ASL in dementia. Magn. Reson. Med. 73, 102–116 (2015).
7. Mutsaerts, H. J. M. M. et al. Cerebral perfusion changes in presymptomatic genetic frontotemporal dementia: a GENFI study. Brain 142, 1108–1120 (2019).
8. Günther, M., Oshio, K. & Feinberg, D. a. Single-shot 3D imaging techniques improve arterial spin labeling perfusion measurements. Magn. Reson. Med. 54, 491–498 (2005).
9. Chappell, M. A., Groves, A. R., Whitcher, B. & Woolrich, M. W. Variational Bayesian Inference for a Nonlinear Forward Model. IEEE Trans. Signal Process. 57, 223–236 (2009).
10. Cohen, A. D. et al. Longitudinal Reproducibility of MR Perfusion Using 3D Pseudocontinuous Arterial Spin Labeling With Hadamard- Encoded Multiple Postlabeling Delays. (2019). doi:10.1002/jmri.27007
11. Ssali, T. et al. Mapping Long-Term Functional Changes in Cerebral Blood Flow by Arterial Spin Labeling. PLoS One 11, e0164112 (2016).
12. Kilroy, E. et al. Reliability of two-dimensional and three-dimensional pseudo-continuous arterial spin labeling perfusion MRI in elderly populations: Comparison with 15o-water positron emission tomography. J. Magn. Reson. Imaging 39, 931–939 (2014).
Figures