2594
Ultra-High Field Sodium MRI in Alzheimer’s Disease Reveals Stage-dependent Metabolic Alterations Associated with Tau-pathology
Alexa Haeger1,2,3, Michel Bottlaender1,4, Julien Lagarde4,5,6, Renata Porciuncula Baptista1, Cécile Rabrait-Lerman1, Volker Luecken2,3, Jörg Bernhard Schulz2,3, Alexandre Vignaud1, Marie Sarazin4,5,6, Kathrin Reetz2,3, Sandro Romanzetti2,3, and Fawzi Boumezbeur1
1BAOBAB, CNRS, Paris-Saclay University, CEA-NeuroSpin, Gif-sur-Yvette, France, 2Department of Neurology, RWTH Aachen University, Aachen, Germany, 3JARA-BRAIN Institute of Molecular Neuroscience and Neuroimaging, Forschungszentrum Jülich GmbH, Julich, Germany, 4BioMaps, CNRS, Inserm, Paris-Saclay University, CEA-SHFJ, Orsay, France, 5Neurology of Memory and Language, GHU Paris Psychiatrie & Neurosciences, Sainte-Anne Hospital, Paris, France, 6Université de Paris, Paris, France
1BAOBAB, CNRS, Paris-Saclay University, CEA-NeuroSpin, Gif-sur-Yvette, France, 2Department of Neurology, RWTH Aachen University, Aachen, Germany, 3JARA-BRAIN Institute of Molecular Neuroscience and Neuroimaging, Forschungszentrum Jülich GmbH, Julich, Germany, 4BioMaps, CNRS, Inserm, Paris-Saclay University, CEA-SHFJ, Orsay, France, 5Neurology of Memory and Language, GHU Paris Psychiatrie & Neurosciences, Sainte-Anne Hospital, Paris, France, 6Université de Paris, Paris, France
Synopsis
Deficits in brain cells’ homeostasis and metabolism are suspected to occur ahead of the atrophy observed throughout the brain of AD patients with potential interactions between Amyloid/Tau deposits and the Na/K-pump activity leading to increased cerebral sodium concentrations. Yet this increase remains to be confirmed. We present a multimodal imaging study combining structural 1H-MRI, quantitative 23Na MRI at 7T in association with Tau- and Amyloid-PET. We show that total sodium concentration is increased in multiple brain regions in AD compared to cognitively healthy controls, and that these changes are more strongly correlated with local Tau- than Amyloid-loads.
Introduction
Previous research on Alzheimer’s disease (AD) has hinted at potential interactions between Amyloid and Tau deposits with the Na+/K+-ATPase activity, leading to pathological alterations of brain cells’ homeostasis and metabolism in AD. Markedly, post mortem [1] and pioneering in vivo 23Na MRI studies [2] have indicated increased cerebral sodium concentrations in AD. Yet this increase in total sodium concentration (TSC) remains to be confirmed. In this multimodal neuroimaging study, we examined 17 AD patients and 22 matched control subjects using quantitative 23Na MRI at 7 Tesla, and investigated the associations between local TSC vs Tau and Amyloid loads assessed by PET, as well as clinical parameters reflecting disease state.Methods
Our AD and aged-matched control cohorts are described in Table 1. Diagnosis of AD was stated in accordance to the international diagnostic criteria of the NIA-AA-research framework including AD-typical CSF biomarker profile indicative for AD [3] and/or positive Amyloid retention on Pittsburgh Compound B-PET (PiB-PET). All AD patients underwent a lumbar puncture as part of the diagnostic process. All subjects received cognitive assessment, including the Mini Mental State Examination (MMSE) and the Montreal Cognitive Assessment (MoCA), obtained on the day of the 23Na MRI session.MRI acquisitions were performed using a 7T Magnetom scanner (Siemens Healthineers, Erlangen, Germany). The 1H MRI session was performed using a 1Tx/32Rx head coil (Nova Medical, USA) and included the acquisition of a T1-weighted anatomical reference (MP2RAGE sequence, 750 µm isotropic resolution) [4].
The 23Na MRI session was performed using a dual-resonance 1H/23Na radiofrequency birdcage coil (Rapid Biomedical, Germany). The 23Na MRI protocol consisted in the acquisition of two UTE images at two different flip-angles (FA1/FA2=25/55°,TE/TR = 0.5/20 ms; 3 mm isotropic resolution, 12 min acquisition time each) with a TPI k-space encoding scheme [5]. 23Na images were reconstructed offline in MATLAB (MathWorks, Natick, USA) using non-uniform FFT using a Kaiser-Bessel kernel interpolation as well as density compensation and Hamming filtering steps. The two images were then combined to obtain quantitative TSC maps using our Variable-Flip-Angle (VFA) method [6]. Additionally, 23Na B1-maps were estimated using the double angle method from two UTE images (FA1/FA2=60/120°,TE/TR = 0.5/80 ms; 6 mm isotropic resolution) and considered to correct our 23Na M0 images for residual B1 inhomogeneities. Our processing pipeline is schematized in Figure 1 and consisted in (i) quantification using 4 external 50 ml calibration NaCl phantoms, (ii) rigid co-registration, segmentation and parcellation of the anatomical reference using ANTs [7] and the Hammersmith Segmentation Atlas [8] and (iii) correction from partial volume using the PET-PVC toolbox [9].
Amyloid- and Tau-PET acquisitions were performed on a high resolution tomograph (HRRT, Siemens Healthineers) within 11.8±5.6 months (mean±SD) from the 7T MRI session using [11C]-PIB and [18F]-Flortaucipir respectively. Image acquisitions were performed 40–60 minutes after injection of 341 ± 68 MBq of [11C]-PiB, and 80–100 minutes after injection of 377 ± 7 MBq of [18F]-Flortaucipir (mean ± SD). Both Tau and Amyloid-PET were available for 15 out of 17 AD patients while Amyloid-PET data were acquired for 18 out of 22 controls. For both PET scans, Standard Uptake Value ratio (SUVr) parametric maps were created using BrainVisa software [10] using the cerebellar grey matter signal value as an internal reference.
As for TSC values (Figure 2B), regional Tau- and Amyloid-loads were averaged over our 25 different ROIs. For regional volume calculation, each ROI volume was corrected for total intracranial volume (TIV) (Figure 2A).
To investigate group differences on a structural and metabolic level, permutation analyses (n = 2000 permutations) were performed with BROCCOLI [11], including age, gender as well as TIV as covariates. The resulting t-values were reported at a corrected p < 0.05 level of significance (Figure 3). Correlation matrices (Figure 4) between TSC and Tau/Amyloid loads were computed by integrating both left and right values for each ROI, using Pearson’s correlation coefficient r. Results were reported at an uncorrected p < 0.05 level of significance.
Results and discussion
Our TSC values are consistent with previously reported physiological tissue sodium concentrations in grey and white matter areas, especially for our control cohort [12-15]. AD patients showed increased TSC levels in distinct cerebral regions that are typically affected by AD pathology in comparison to cognitively healthy control subjects. This validates our hypothesis of a [Na+] imbalance accompanying the neurodegenerative process in AD patients, confirming post-mortem [1] and preliminary in vivo observations [2]. Correlation matrices between TSC and regional Tau and Amyloid loads revealed larger associative patterns in AD patients between Tau and TSC compared to Amyloid-load, leading to the assumption that Tau-load might be a more direct mediator of metabolic alterations in brain cells affected by AD as reflected by the large sodium increase observed using 23Na MRI.Conclusion
This study hints at the potential of TSC as a metabolic imaging biomarker and might motivate the collection of larger datasets, which could help in the evaluation of disease progression as well as in the development of new therapeutic concepts for AD.Acknowledgements
This work could not have been possible without the efforts of the SENIOR team (Christine Baron, Valérie Berland, Nathalie Blancho, Séverine Desmidt, Christine Doublé, Chantal Ginisty, Véronique Joly-Testault, Laurence Laurier, Yann Lecomte, Claire Leroy, Christine Manciot, Stephanie Marchand, Gaelle Mediouni, Xavier Millot, Ludivine Monassier, Séverine Roger & Catherine Vuillemard) at the UNIACT team of NeuroSpin (7T MR Imaging) and Service Hospitalier Frédéric Joliot in Orsay (PET Imaging). We would further like to thank all the participants for their great engagement in this study and all the efforts they made. We are also indebted to AVID Radiopharmaceuticals, Inc., for their support in supplying the AV- 1451 precursor and chemistry production advice. AH received a rotation stipend of RWTH Aachen University Hospital. This research project has been supported by the START-Program of the Faculty of Medicine, RWTH Aachen (121/18). AH received a travel grant by Alzheimer Forschung Initiative e. V. (T1804). KR and SR were partly funded by the German Federal Ministry of Education and Research (BMBF 01GQ1402). The project was supported by the French Ministry of Health grant (PHRC-2013-0919), CEA, Institut de recherches internationales Servier, France-Alzheimer, Fondation pour la recherche sur Alzheimer and from the Leducq Foundation (large equipment Equipement de Recherche et Plateformes Technologiques program, NEUROVASC7T project).References
- Graham SF, Nasarauddin M Bin, Carey M, McGuinness B, Holscher C, Kehoe PG, et al. Quantitative measurement of [Na+] and [K+] in postmortem human brain tissue indicates disturbances in subjects with Alzheimer’s disease and dementia with Lewy bodies. Journal of Alzheimer’s Disease 2015; 44: 851–857.
- Mellon EA, Pilkinton DT, Clark CM, Elliott MA, Witschey WR, Borthakur A, et al. Sodium MR Imaging Detection of Mild Alzheimer Disease: Preliminary Study. American Journal of Neuroradiology 2009; 30: 978–984.
- Jack CR, Bennett DA, Blennow K, Carrillo MC, Dunn B, Haeberlein SB, et al. NIA-AA Research Framework: Toward a biological definition of Alzheimer’s disease. Alzheimer’s & Dementia 2018; 14: 535–562.
- Marques JP, Kober T, Krueger G, van der Zwaag W, Van de Moortele PF, Gruetter R. MP2RAGE, a self bias-field corrected sequence for improved segmentation and T1-mapping at high field. NeuroImage 2010; 49: 1271–1281.
- Boada FE, Christensen JD, Gillen JS, Thulborn KR. Three-dimensional projection imaging with half the number of projections. Magnetic Resonance in Medicine 1997; 37: 470–477.
- Coste A, Boumezbeur F, Vignaud A, Madelin G, Reetz K, Le Bihan D, et al. Tissue sodium concentration and sodium T1 mapping of the human brain at 3 T using a Variable Flip Angle method. Magnetic Resonance Imaging 2019; 58: 116–124.
- Avants BB, Tustison NJ, Song G, Cook PA, Klein A, Gee JC. A reproducible evaluation of ANTs similarity metric performance in brain image registration. NeuroImage 2011; 54: 2033–2044.
- Hammers A, Allom R, Koepp MJ, Free SL, Myers R, Lemieux L, et al. Three-dimensional maximum probability atlas of the human brain, with particular reference to the temporal lobe. Human Brain Mapping 2003; 19: 224–247.
- Thomas BA, Cuplov V, Bousse A, Mendes A, Thielemans K, Hutton BF, et al. PETPVC: A toolbox for performing partial volume correction techniques in positron emission tomography. Physics in Medicine and Biology 2016; 61: 7975–7993.
- http://brainvisa.info.
- Eklund A, Dufort P, Villani M, Laconte S. BROCCOLI: Software for fast fMRI analysis on many-core CPUs and GPUs. Frontiers in neuroinformatics 2014; 8: 24.
- Romanzetti S, Mirkes CC, Fiege DP, Celik A, Felder J, Shah NJ. Mapping tissue sodium concentration in the human brain: A comparison of MR sequences at 9.4 Tesla. NeuroImage 2014; 96: 44–53.
- Mirkes CC, Hoffmann J, Shajan G, Pohmann R, Scheffler K. High-resolution quantitative sodium imaging at 9.4 Tesla. Magnetic Resonance in Medicine 2015; 73: 342–351.
- Shah NJ, Worthoff WA, Langen KJ. Imaging of sodium in the brain: A brief review. NMR in Biomedicine 2016; 29: 162–174.
- Thulborn K, Lui E, Guntin J, Jamil S, Sun Z, Claiborne TC, et al. Quantitative sodium MRI of the human brain at 9.4 T provides assessment of tissue sodium concentration and cell volume fraction during normal aging. NMR in biomedicine 2016; 29: 137–43.
Figures
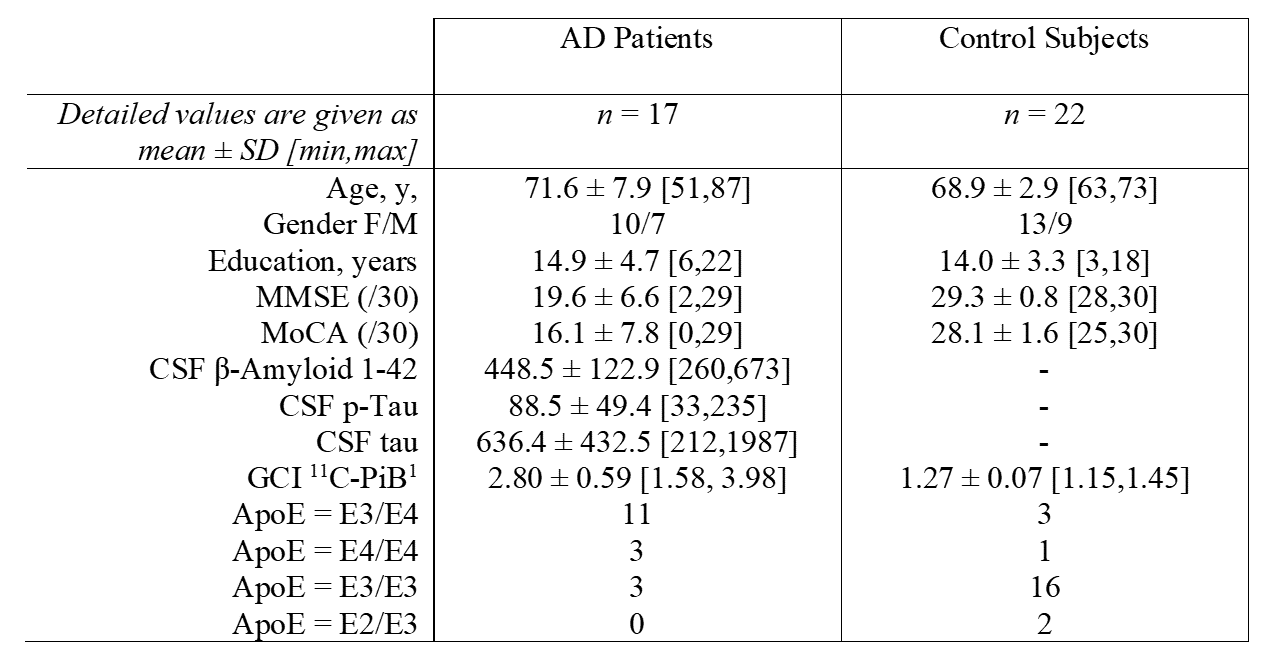
Table 1. Demographic data of the study sample. Mean ± SD [min,max]; altered n if applicable. Max. MMSE score
(/30); max. MoCA score (/30); CSF cut-off values total Tau: 450 pg/ml,
phospho-Tau: 60 pg/ml, β-Amyloid 1-42: 500 pg/ml (before
February, 2019: Elisa Inno-test; after: cut-off at 650 pg/ml with Lumipulse by
Fujirebio). 1n = 15/17 for patients, n = 18/22 for control subjects.
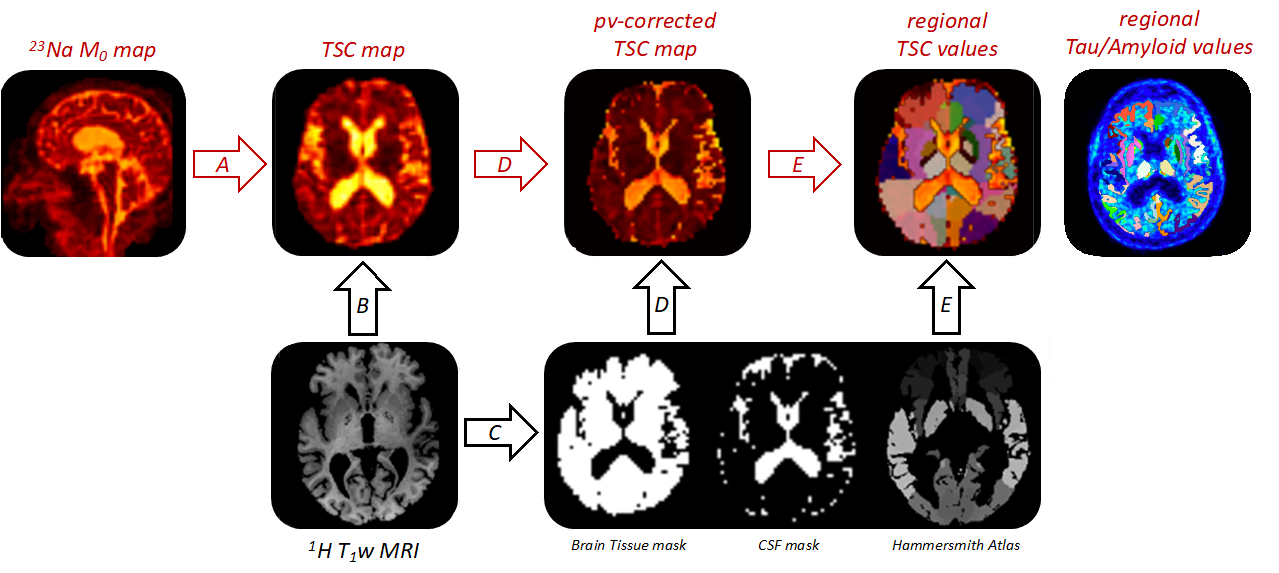
Figure 1. Overview
of the processing pipeline. TSC maps are obtained from the 23Na
M0-images via a 4-point calibration (A);
co-registered to their T1-weigthed anatomical reference
(B); parallely CSF, WM, GM segmentation masks + Hammersmith atlas parcellation
are calculated (C) and transformed into the original 23Na-MRI space
and regional TSC values are extracted from pv-corrected TSC images as well as
Tau/Amyloid_loads from the PET images (D then E).
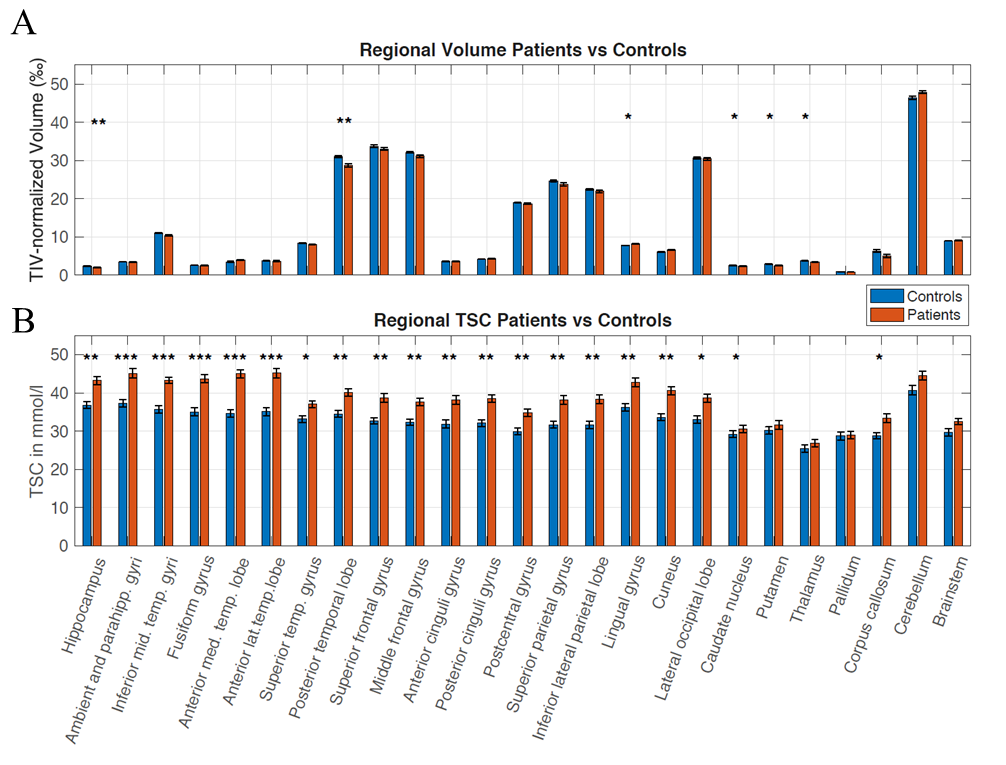
Figure 2. (A) Regional TIV-normalized
volumes (in ‰) and (B) mean TSC (in mmol/l) for AD patients (red) and controls (blue), revealing increased TSC in most brain areas. Errors bars correspond to
the Standard Error of the Mean. Significant differences are marked as * p <
0.05, ** < 0.01, *** < 0.001 after Bonferroni-Holm correction
for multiple comparisons.
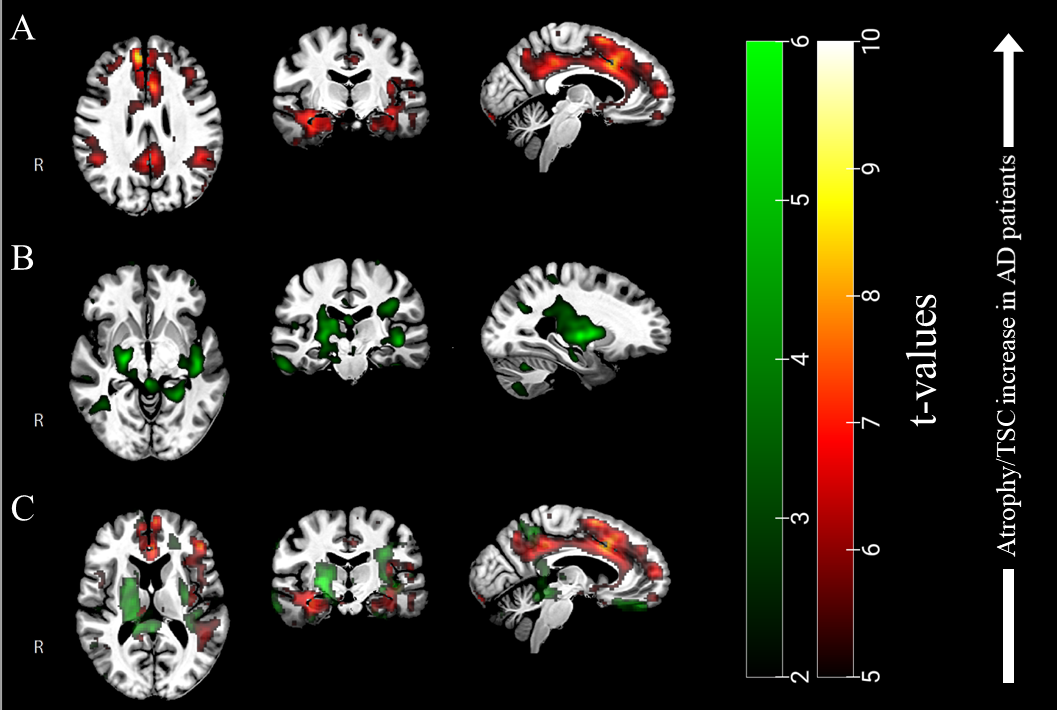
Figure 3. (A) T-values resulting
from voxel-based permutation analyses of our TSC maps (AD > Controls) and (B) atrophy clusters in green (Controls
> AD), overlaid to our group template. (C) From the overlay of both TSC and
atrophy clusters, one can appreciate the differences between both pathological patterns.
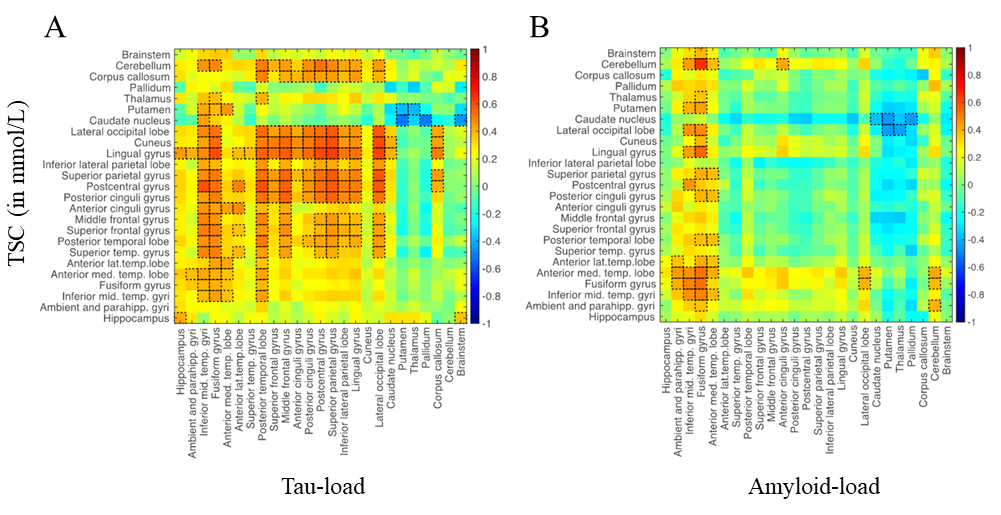
Figure 4. Correlation matrices between TSC versus local Tau
load (A) and versus local Amyloid load (B). Notable correlations
are reported at an uncorrected p < 0.05 level of significance and are framed
in black.