2593
Functional connectivity-based prediction of Autism on site harmonized ABIDE dataset1Symbiosis Centre for medical image analysis, Symbiosis international university, Pune, India, 2Martinos Center for Biomedical Imaging, Massachusetts General Hospital, Boston, MA, United States, 3Department of Electrical and Computer Engineering, Auburn University, Auburn, AL, United States
Synopsis
Functional MRI connectivity based analysis that ranges between simple univariate methods to complex deep-learning pipelines has been employed to differentiate autistic patients from healthy controls on benchmark datasets such as ABIDE. However, the variability induced via multi-site acquisition of data may perturb the underlying prediction model with undesirable consequences. We illustrate that statistical elimination of scanner effects using COMBAT harmonization yields better results and also facilitates in gaining insights into the discriminative connectivity patterns that emerge post harmonization and which correlate with clinical markers.
Introduction
Autism Spectrum Disorder (ASD) is a developmental non-focal brain disorder that is clinically characterized by impaired social communication, restricted interests and repetitive behaviour 1 and can be diagnosed in early years of life. Autism Brain Imaging Data Exchange (ABIDE) is a large-scale imaging dataset (about 1000 subjects) of MRI data pooled from multiple sites. It has provided a platform to gain a deeper understanding of autism, its phenotypes and variability in severity. Moreover, the dataset facilitates as an open-access benchmarking instrument for novel ML based algorithms that are being developed to identify autism from neuroimaging.Prediction tasks on connectomes are non-trivial and a cautious effort is required in engineering the most distinctive features as the differences are subtle and capturing these in a diverse population is challenging. Despite the promise that neuroimaging markers facilitate, multiple fMRI studies have reported systemic scanner differences which are not accounted for during post-processing and analysis, and in turn may perturb the multi-variate model 2. The objective of the study is to differentiate autistic patients from healthy controls using connectome data and precisely identify the brain sub-networks influencing the predictions during classification. We also aim at analysing the effects of harmonization on fMRI data by comparing the results over pre harmonized and post harmonized datasets.
Methods
ABIDE is an open access, multisite image repository comprising structural and functional scans of ASD and matched typically developing (TD) controls 3. We included rs-fMRI and T1 structural brain images that were acquired over 18 sites for 432 ASD and 556 TDs in our dataset. Data pre-processing followed a standard pipeline using Data Processing Assistant for Resting-State fMRI Toolbox (DPARSF) which is based on SPM. We used Functional connectivity (FC) as the feature to classify the ASD group from the TD group. Mean time series were extracted for each subject from 200 homogenous regions of interest (ROIs) which are defined using the Craddock CC200 functional parcellation atlas. Each value in the FC matrix was calculated using the Pearson correlation coefficient of two corresponding time series. Owing to the symmetricity, the FC matrix was vectorized by removing the upper triangle and absolute values were used.To evaluate for site-harmonization impacts on the predictive power of classification models, we employed COMBAT named for 'combating batch effects when combining batches’ 4 based on empirical Bayes method and has been used to harmonize diffusion tensor imaging data and brain connectivity data.
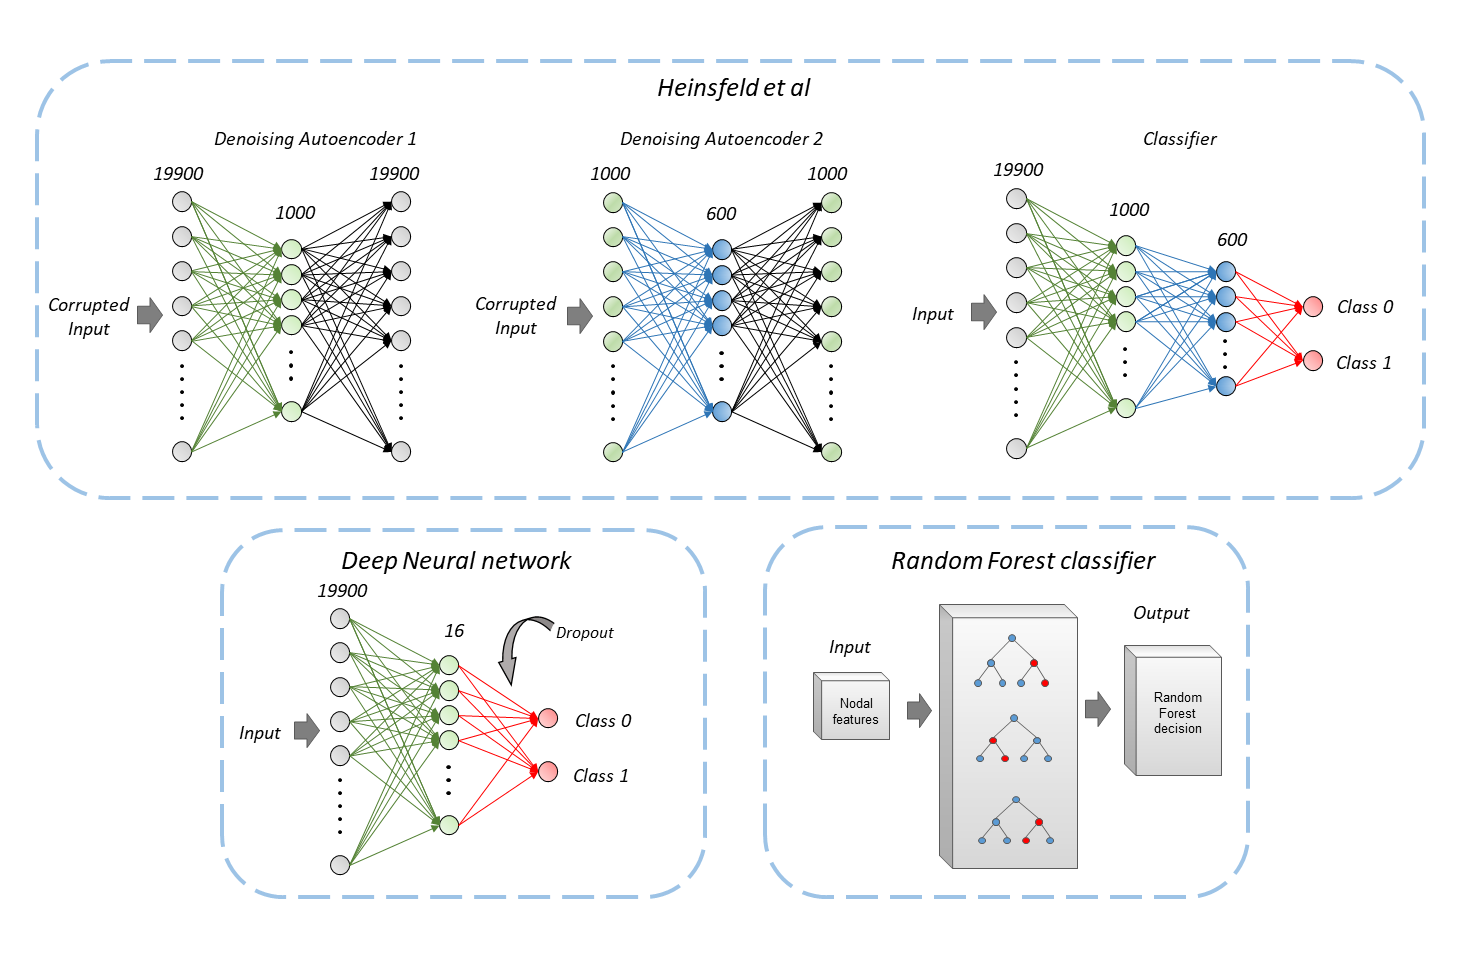
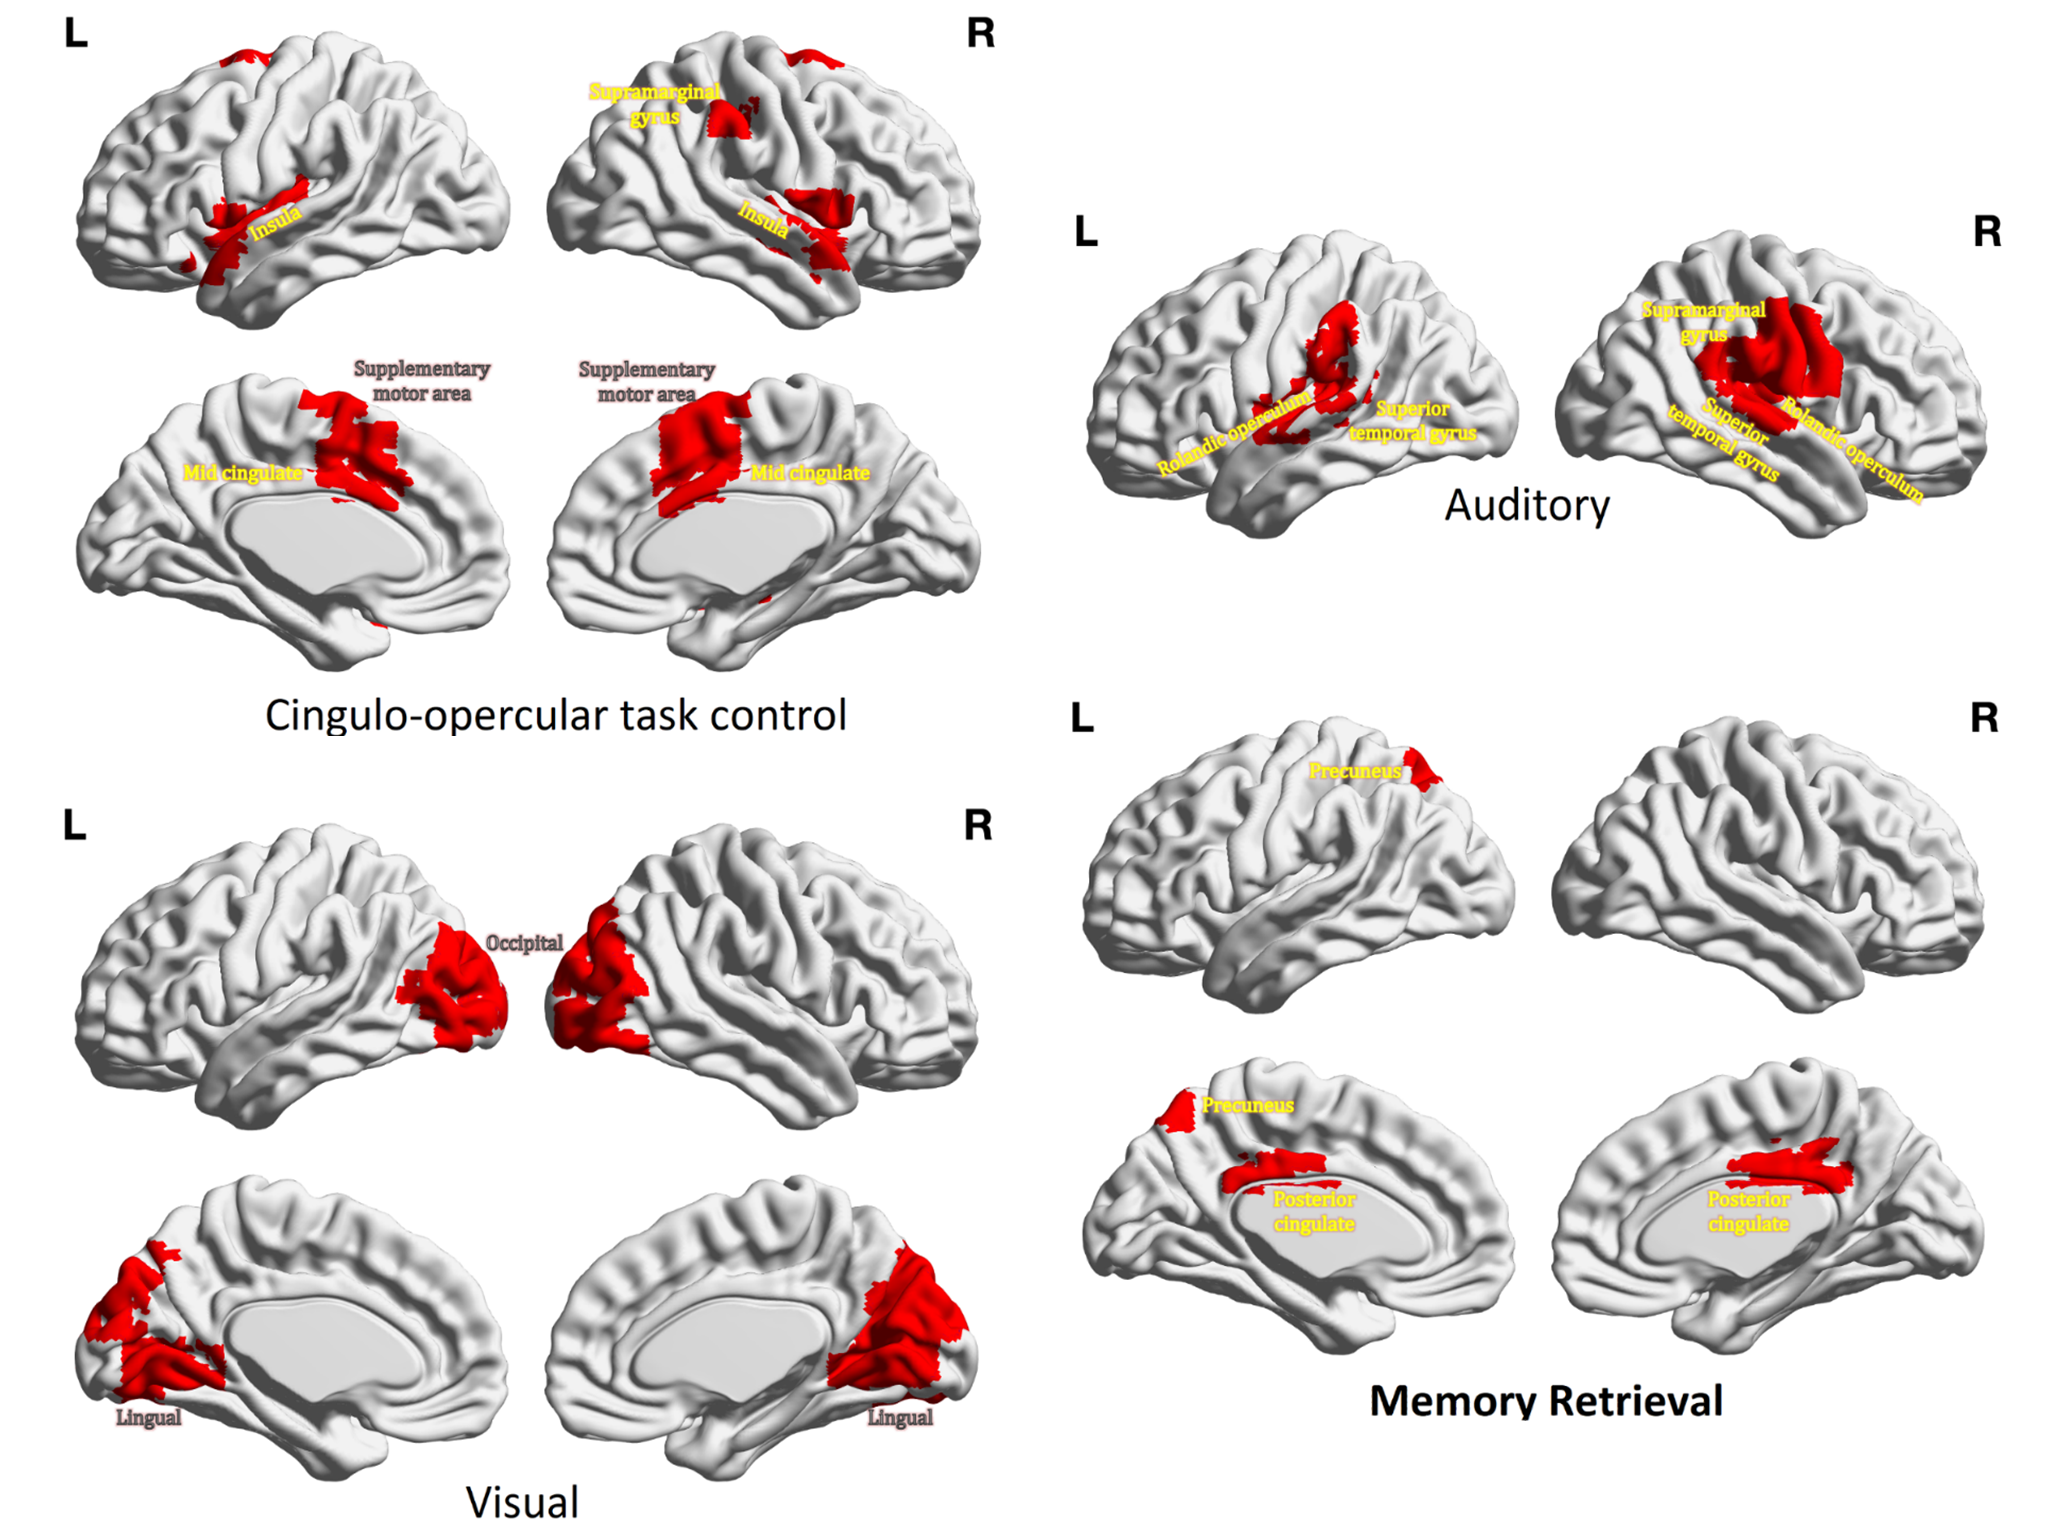
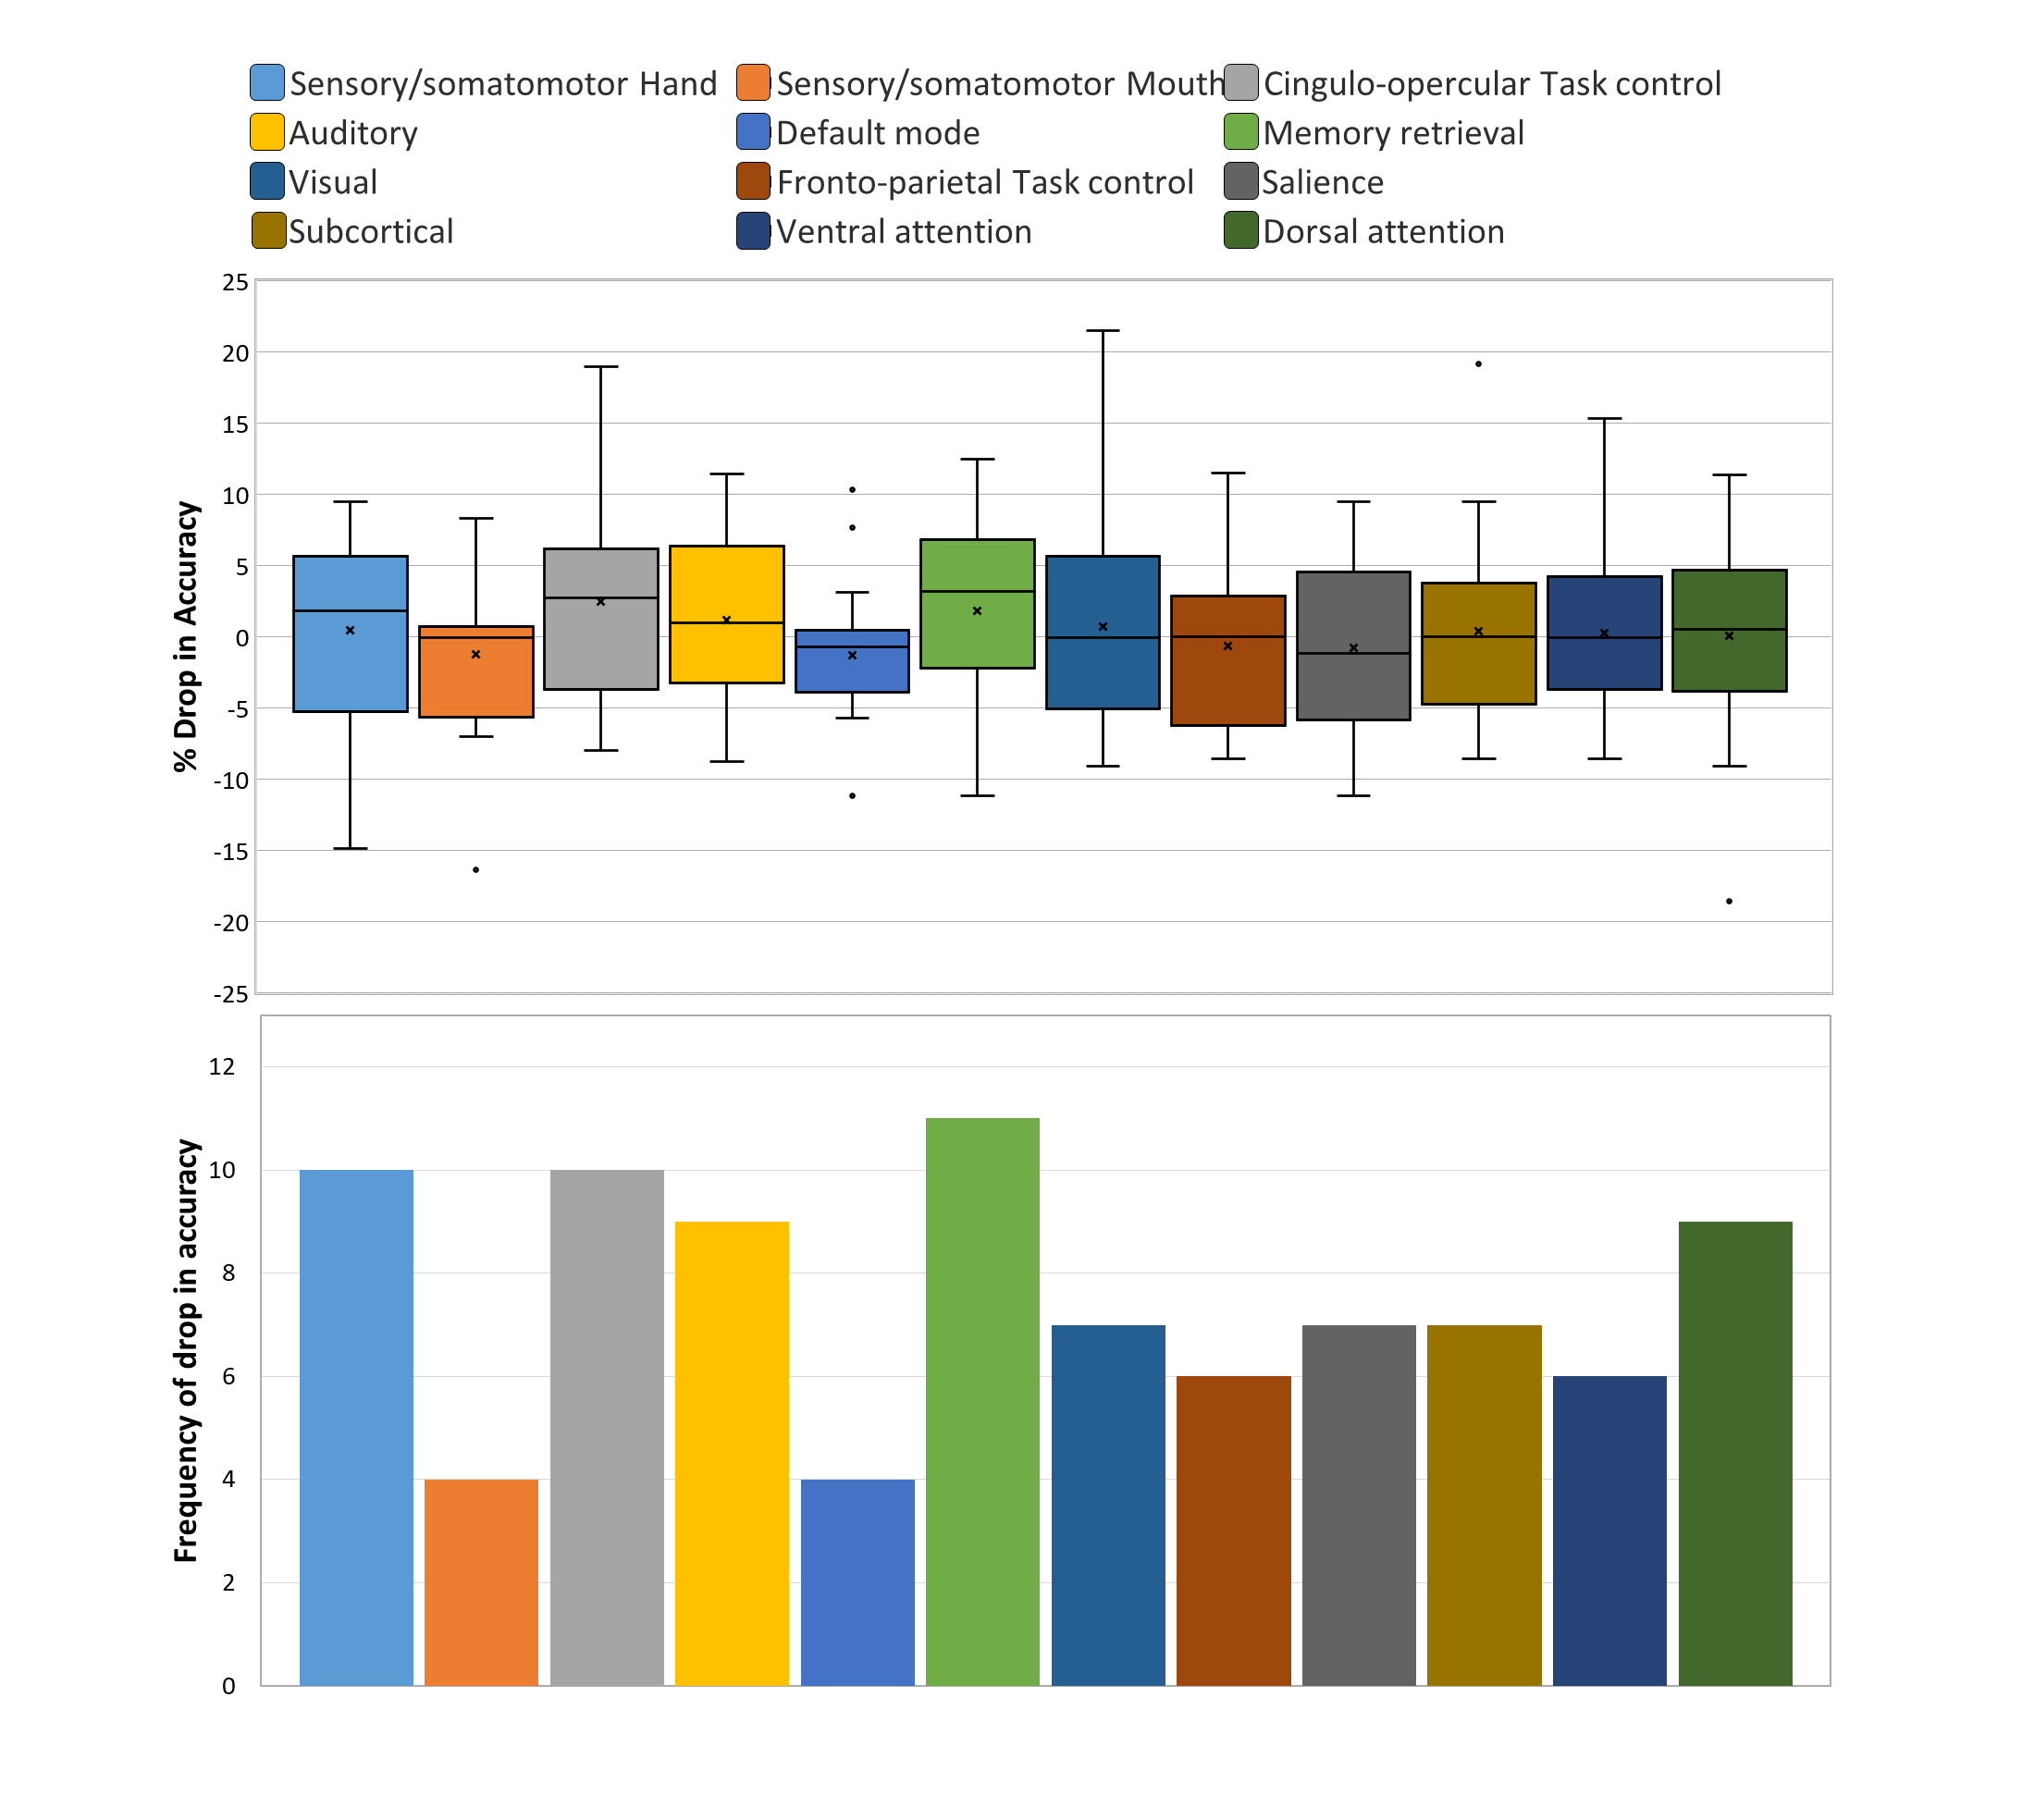
We implemented leave-one-site-out (LOSO) classification techniques using an artificial neural network (ANN) architecture, Random forest (RF) classification as well as state of art auto-encoders as proposed by Heinsfeld et al. 5 on harmonized and non-harmonized connectivity matrices as shown in figure 1. To gain deeper understanding about the discriminative connectivity sub-networks for clinical interpretability, we performed ablation analysis between 12 well-defined sub-networks namely sensory/somatomotor hand (15 ROIs), sensory/somatomotor mouth (3 ROIs), cingulo-opercular task control (12 ROIs), auditory (9 ROIs), default mode (41 ROIs), memory retrieval cingulo-parietal (3 ROIs), visual (20 ROIs), fronto-parietal task control (24 ROIs), salience (10 ROIs), subcortical (25 ROIs), ventral attention (8 ROIs), dorsal attention subnetworks (13 ROIs) and uncertain (17 ROIs; regions that did not belong to any other defined network). Finally, the discriminative sub-networks were correlated with clinical markers of ADI verbal scores and auditory sub-network using linear regression after removing the effects of age and gender.
Results
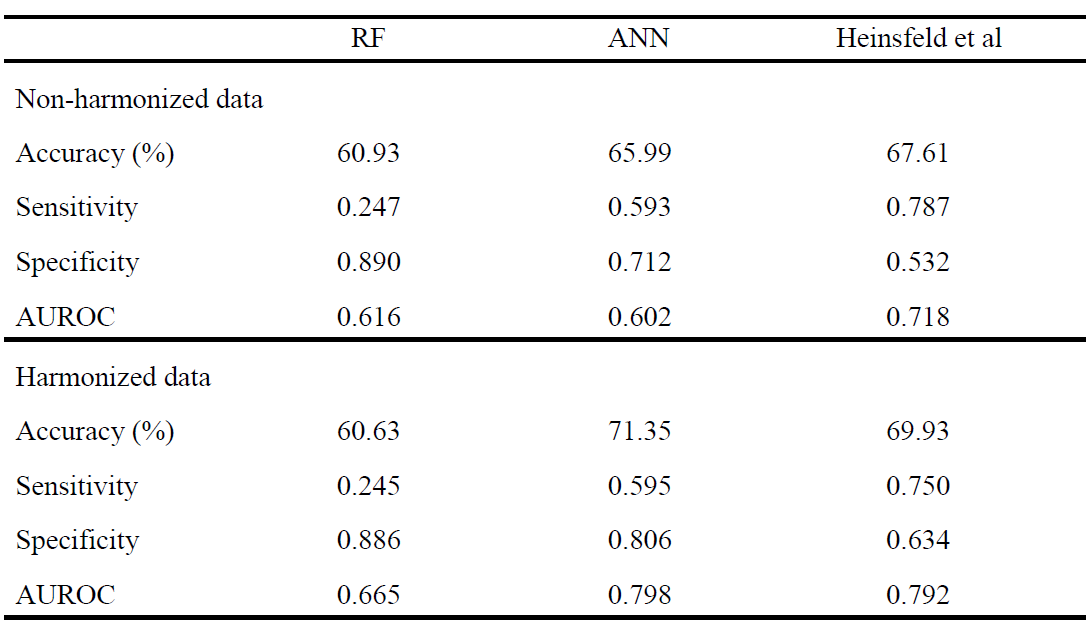
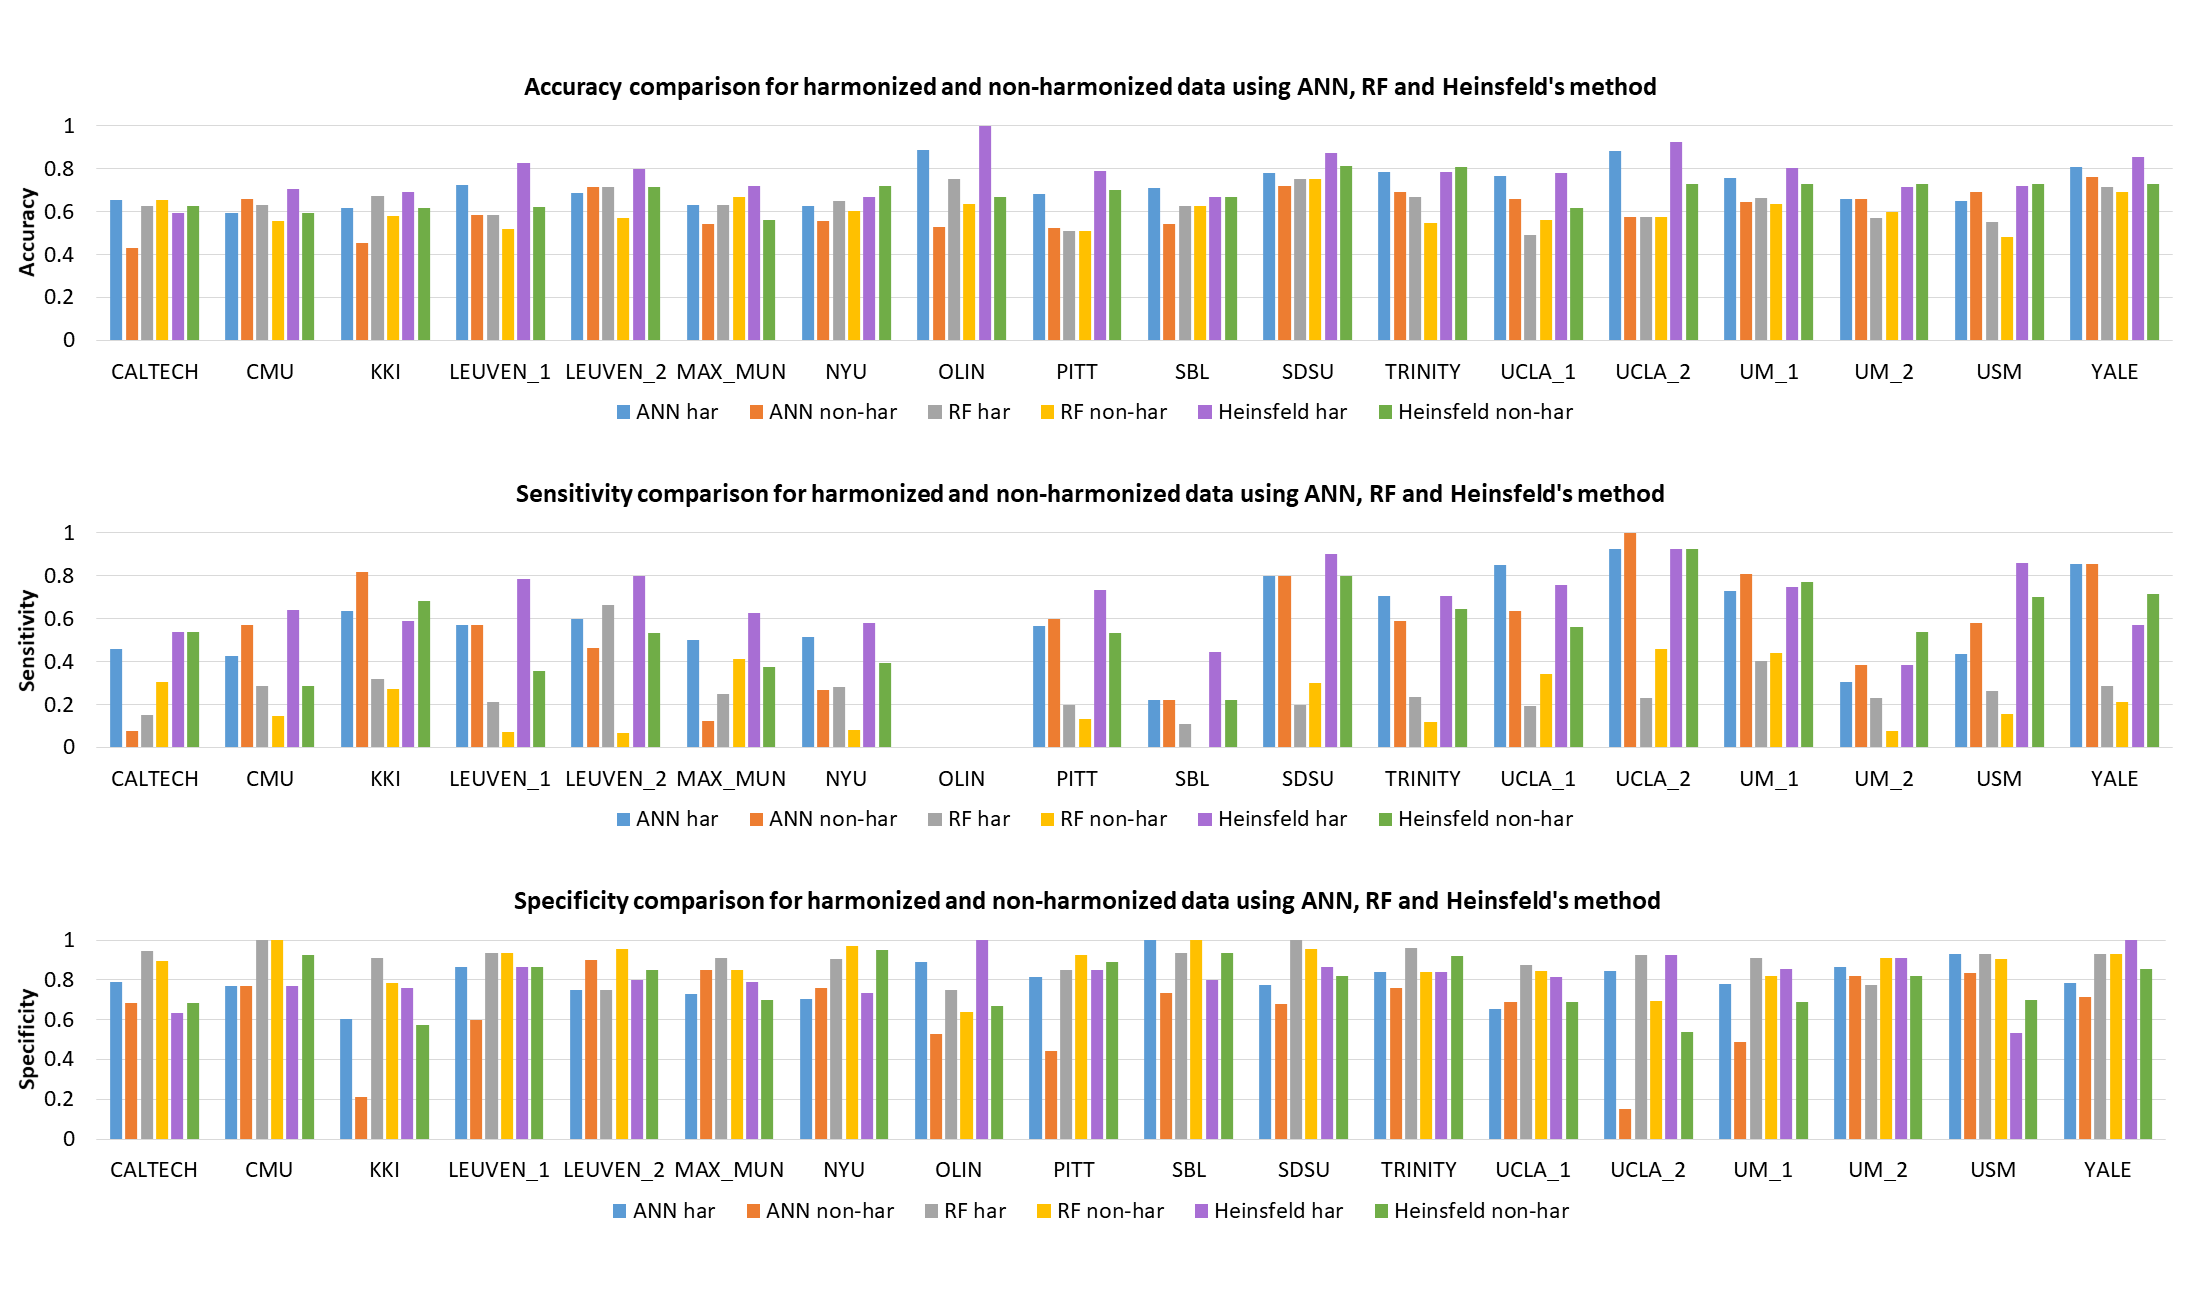
Figure 3 shows performance metrics for all 3 classifiers with ANN yielding highest AUROC of 0.798 on harmonized data. The accuracy improved with harmonized data for auto-encoders (̴ 2.5%) and ANNs (4.5%), with no effect on RF. Site-wise metrics for LOSO classification were superior for harmonized data in comparison to non-harmonized dataset as shown in fig 4. Boxplot for distribution of drop in accuracy and frequency of drop in accuracy for occlusion per subnetwork in ablation analysis is shown in fig 5. Sensory/somato-motor hand, Memory retrieval, Auditory and Cingulo-opercular task control subnetworks were found to be most significant in ablation analysis. Characteristic pathlength showed a significant weak positive correlation in autism group alone (Spearman’s rank correlation= 0.1797) in the auditory subnetwork.Conclusion
Inter-site variability may mask inter-group differences, and hence, the advantages gained by the larger sample size in the context of machine learning based diagnostic classification may not be realized. Our results revealed that harmonization of multi-site neuroimaging data is crucial to improve diagnostic classification performance. We demonstrated this using the ABIDE multi-site fMRI connectivity dataset, where we not only outperformed earlier techniques, but also facilitated sub-network based interpretability. Auditory, Sensory and cingulo-opercular networks have already been implicated in Autism and the correlation of auditory network strength with ADI provides testimony of its involvement. In summary, our work not only illustrates the importance of harmonization but also provides deeper insights into ASD pathology.Acknowledgements
No acknowledgement found.References
1. Eaves, L.C., et al., Screening for autism spectrum disorders with the social communication questionnaire. Journal of Developmental & Behavioral Pediatrics, 2006. 27(2): p. S95-S103.
2. Friedman, L., et al., Test–retest and between‐site reliability in a multicenter fMRI study. Human brain mapping, 2008. 29(8): p. 958-972.
3. Di Martino, A., et al., The autism brain imaging data exchange: towards a large-scale evaluation of the intrinsic brain architecture in autism. Molecular Psychiatry, 2014. 19(6): p. 659-667.
4. Johnson, W.E., C. Li, and A. Rabinovic, Adjusting batch effects in microarray expression data using empirical Bayes methods. Biostatistics, 2006. 8(1): p. 118-127.
5. Heinsfeld, A.S., et al., Identification of autism spectrum disorder using deep learning and the ABIDE dataset. NeuroImage. Clinical, 2017. 17: p. 16-23.
Figures