2591
Tau-mediated microstructural changes in the central tegmental tract in APOE-ε4 positive mild cognitive impairment1Center for Advanced Neuroimaging, University of California Riverside, Riverside, CA, United States, 2Department of Bioengineering, University of California Riverside, Riverside, CA, United States, 3Department of Neurology, Emory University, Atlanta, GA, United States, 4Department of Psychology, University of California Riverside, Riverside, CA, United States
Synopsis
In mild cognitive impairment, hyperphosphorylated tau proteins and tau inclusions first appear in the locus coeruleus and transentorhinal cortex and spread to other brain regions, including the thalamus. Locus coeruleus axons project to the thalamus via the central tegmental tract (CTT). Relative to APOE-ε4 negative subjects, a decrease in MD (p=0.038) and an increase in ficvf (p=0.007) was seen in the CTT of APOE-ε4 positive subjects. In the APOE-e4 positive group, CTT microstructural measures were positively correlated with thalamus tau-PET SUVR but no correlations between CTT microstructure and tau-PET SUVR were observed in the APOE-ε4 negative group.
Introduction
Carriers of the apolipoprotein E-ε4 (APOE-ε4) allele have an increased risk of developing mild cognitive impairment (MCI) and Alzheimer’s disease (AD) pathology1, which consists of accumulation of β-amyloid (Aβ) into extracellular plaques and hyper-phosphorylated tau into intracellular neurofibrillary tangles2,3. Ab plaques and tau proteins are hypothesized to act in a prion-like manner4,5, with tau pathology propagating through axonal pathways6.Hyperphosphorylated tau proteins and tau inclusions first appear in the locus coeruleus and transentorhinal cortex and spread to other brain regions, including the thalamus5,7. Locus coeruleus axons project to the thalamus via the central tegmental tract (CTT), which ascends from the dorsal pons through the midbrain before entering the posterior portion of the thalamus8,9. The influence of tau pathology in thalamic nuclei on CTT microstructure has yet to be elucidated. Here, we explore the relationship between thalamic tau deposition with CTT microstructure in a population of carriers of the (APOE-ε4) allele with MCI.
Methods
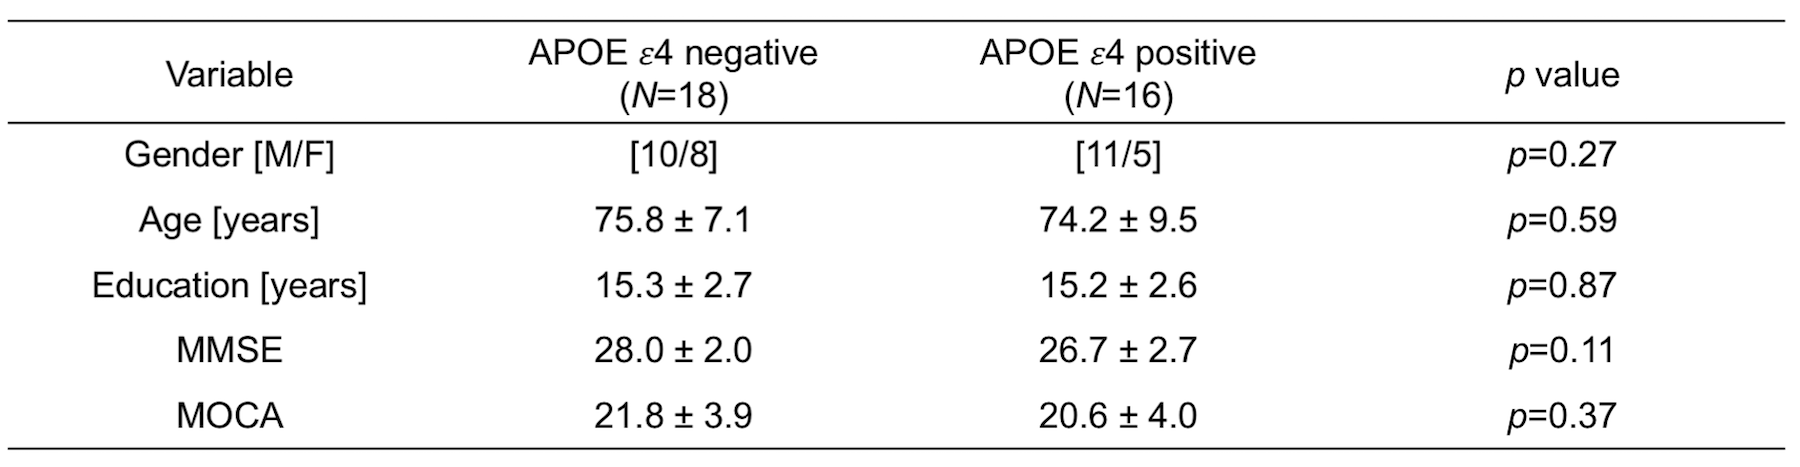
The Alzheimer’s Disease Neuroimaging Initiative (ADNI) database (adni.loni.usc.edu) was queried for individuals diagnosed with MCI who had APOE-ε4 data, tau-sensitive (18F-AV1451) or Aβ-sensitive (18F-AV45) PET, and two shell diffusion MRI data acquired at the same visit. MCI diagnoses were based on a subjective memory concern reported by a clinician, abnormal memory function on the education-adjusted Logical Memory II subscale, and a clinical dementia rating greater than 0.5. A total of 34 MCI participants met these criteria. Participants with either one or two APOE-ε4 alleles were considered APOE-ε4 (+). Demographic information is shown Table 1.All MRI data used in this analysis were acquired on Siemens Prisma scanners. Anatomic images were acquired with a T1-weighted MP-RAGE sequence (echo time (TE)/repetition time (TR)/inversion time=2.98/2300/900 ms, flip angle=9°, voxel size=1.0×1.0×1.0 mm3) were used for registration to common space and correction of partial volume effects in the PET data.
Diffusion tensor imaging (DTI) data were acquired with a multiband diffusion weighted EPI spin echo sequence (TE/TR=71/3400ms, voxel size=2×2×2mm3). Diffusion weighting was applied in 54 directions with b values of 1000 and 2000 s/mm2.DTI data were first corrected for motion and eddy currents using eddy in FSL. Next, susceptibility distortions were corrected using fugue in FSL. Neurite orientation and dispersion density imaging (NODDI) metrics were calculated in MATLAB using the NODDI toolbox v1.0.1.
Information pertaining to the acquisition of 18F-AV1451 (tau) and 18F-AV45 (Aβ)-PET data can be found on the ADNI website (http://adni.loni.usc.edu/methods). PET imaging data were analyzed with FSL and PET partial volume correction (PETPVC) toolbox. Tau and Aβ-PET scans were motion corrected, averaged, registered to the participant's own T1-weighted MRI image. Grey matter, white matter, and CSF maps were segmented in the T1-weighted image and used to correct for partial volume effects. The median standardized uptake value (SUV) in the inferior cerebellar cortex was chosen as a reference and used to calculate mean SUV ratio (SUVR) in an ROI in the posterior thalamus.
The thalamus region of interest (ROI) was taken from the Harvard-Oxford subcortical atlas in FSL and a CTT atlas10 was used to define the CTT ROI. Mean diffusion (FA, fractional anisotropy; mean diffusivity, MD), NODDI, and iron metrics were measured in the CTT ROI. Tau-PET and Aβ-PET SUVR were measured in the thalamus ROI. A Mann-Whitney U test was used for all group comparisons and p values less than 0.05 were considered significant.
Results
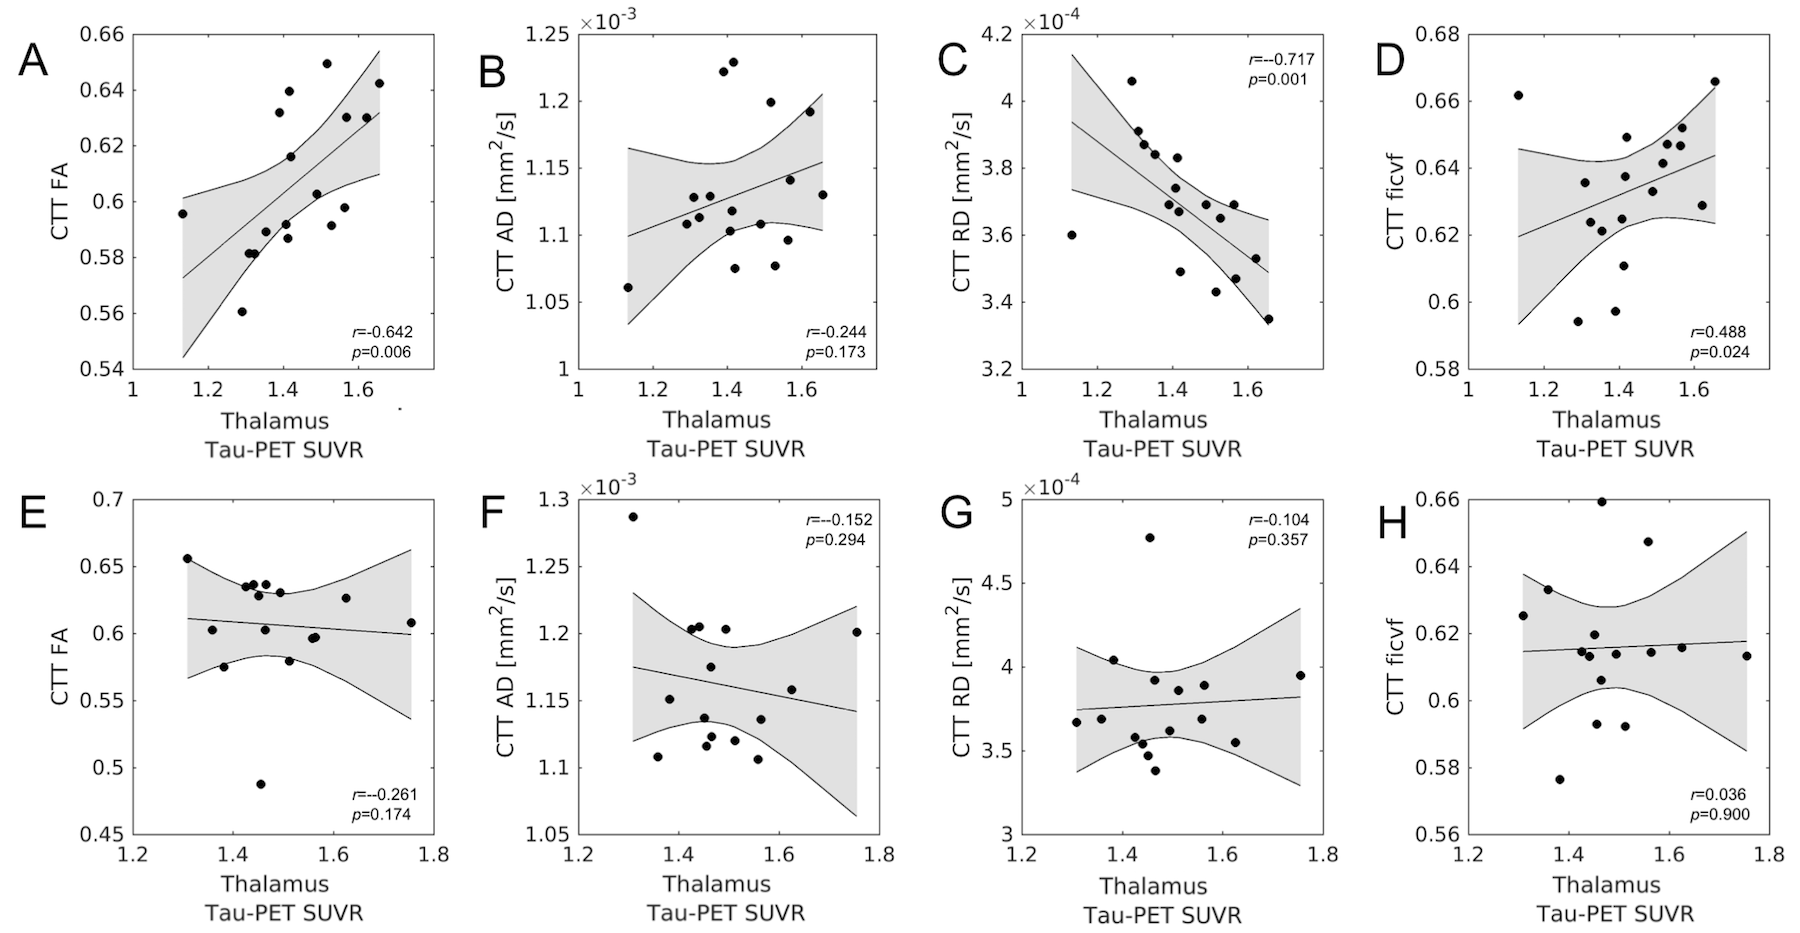
Relative to APOE-ε4 negative subjects, a decrease in MD (p=0.038) and an increase in ficvf (p=0.007) was seen in the CTT of APOE-ε4 positive subjects. A significant increase in Ab-PET SUVR in the APOE-ε4 positive group, relative to APOE-ε4 negative group (p=0.028), was found in the thalamus ROI but no difference was seen in tau-PET SUVR between groups (p=0.46) in the thalamus ROI. These comparisons are summarized in Figure 2.The effect of tau and Ab deposition in the thalamus on CTT microstructure was assessed by correlating Tau and Aβ-PET SUVR with CTT diffusion metrics (MD, AD, RD, fiso, and ficvf). Spearman’s rank correlation was performed for each correlation. In the APOE-ε4 positive group, CTT FA was positively correlated with thalamus tau-PET SUVR (r=0.642,p=0.003), CTT RD was negatively correlated with thalamus tau-PET SUVR (r=-0.717,p=0.001), and CTT ficvf was positively correlated with thalamus tau-PET SUVR (r=0.488,p=0.024). No significant correlations were seen between CTT diffusion metrics and thalamus tau-PET SUVR in the APOE-ε4 negative group. These correlations are shown in Figure 3. No correlations were found between thalamus Aβ-PET SUVR and CTT diffusion metrics in either group.
Discussion
We found higher intra-cellular compartment volume fraction (ficvf) and lower MD in the CTT of APOE-ε4 positive MCI subjects as compared to APOE-ε4 negative MCI subjects. These results accord with an animal study in a TgCRND8 mouse model of AD where reductions in MD and increases in ficvf were reported in white matter11. In the APOE-ε4 positive group, CTT microstructural changes were associated with thalamic tau-PET SUVR rather than thalamic Ab-PET SUVR. In particular, high thalamic tau-PET SUVR was correlated with low CTT RD and high CTT ficvf. Reduced RD and increased ficvf may indicate axonal swelling, dendritic branching, or decreased membrane permeability12.Acknowledgements
Data collection and sharing for this project was funded by the Alzheimer's Disease Neuroimaging Initiative (ADNI) (National Institutes of Health Grant U01 AG024904) and DOD ADNI (Department of Defense award number W81XWH-12-2-0012). ADNI is funded by the National Institute on Aging, the National Institute of Biomedical Imaging and Bioengineering, and through generous contributions from the following: AbbVie, Alzheimer’s Association; Alzheimer’s Drug Discovery Foundation; Araclon Biotech; BioClinica, Inc.; Biogen; Bristol-Myers Squibb Company; CereSpir, Inc.; Cogstate; Eisai Inc.; Elan Pharmaceuticals, Inc.; Eli Lilly and Company; EuroImmun; F. Hoffmann-La Roche Ltd and its affiliated company Genentech, Inc.; Fujirebio; GE Healthcare; IXICO Ltd.; Janssen Alzheimer Immunotherapy Research & Development, LLC.; Johnson & Johnson Pharmaceutical Research & Development LLC.; Lumosity; Lundbeck; Merck & Co., Inc.; Meso Scale Diagnostics, LLC.; NeuroRx Research; Neurotrack Technologies; Novartis Pharmaceuticals Corporation; Pfizer Inc.; Piramal Imaging; Servier; Takeda Pharmaceutical Company; and Transition Therapeutics. The Canadian Institutes of Health Research is providing funds to support ADNI clinical sites in Canada. Private sector contributions are facilitated by the Foundation for the National Institutes of Health (www.fnih.org). The grantee organization is the Northern California Institute for Research and Education, and the study is coordinated by the Alzheimer’s Therapeutic Research Institute at the University of Southern California. ADNI data are disseminated by the Laboratory for Neuro Imaging at the University of Southern California.References
[1] Roses and Saunders. APOE is a major susceptibility gene for Alzheimer's disease. Curr Opin Biotechnol. 5:663-667.
[2] Morris, et al. APOE predicts amyloid-beta but not tau Alzheimer pathology in cognitively normal aging. Ann Neurol. 67:122-131.
[3] Schmechel, et al. Increase amyloid beta-peptide deposition in cerebral cortex as a consequence of apolipoprotein E genotype in late-onset Alzheimer disease. Proc Natl Acad Sci USA. 90:9649-0653.
[4] Ittner and Gotz. Amyloid-beta and tau – a toxic pas de deux in Alzheimer’s disease. Nat. Rev. Neurosci. 12:67-72
[5] Goedert. Alzheimer’s and Parkinson’s diseases: the prion concept in relation to assembled Aβ, tau, and α-synuclein. Science 349:1255555.
[6] Ayers, et al. Prion-like Spreading in Tauopathies. Biol Psychiatry. 83:337–346.
[7] Braak and Braak. Neuropathological stageing of Alzheimer-related changes. Acta Neuropathol. 82:239-259.
[8] Tanaka, et al. Histochemical mapping of catecholaminergic neurons and their ascending fiber pathways in the rhesus monkey brain. Brain Res Bull. 9:255-270.
[9] Bowden, et al. An autoradiographic, semistereotaxic mapping of major projections from locus coeruleus and adjacent nuclei in Macaca mulatta. Brain Res. 145:257-276.
[10] Langley, et al. Locus coeruleus and its projections impact on age-related cognitive decline. ISMRM 2020, poster #1448.
[11] Colon-Perez, et al. Neurite Orientation Dispersion and Density Imaging Reveals White Matter and Hippocampal Microstructure Changes Produced by Interleukin-6 in the TgCRND8 Mouse Model of Amyloidosis. Neuroimage. 202:116138.
[12] Adalbert, et al. Interaction between a MAPT variant causing frontotemporal dementia and mutant APP affects axonal transport. Neurobiol Aging. 68:68-75.
Figures
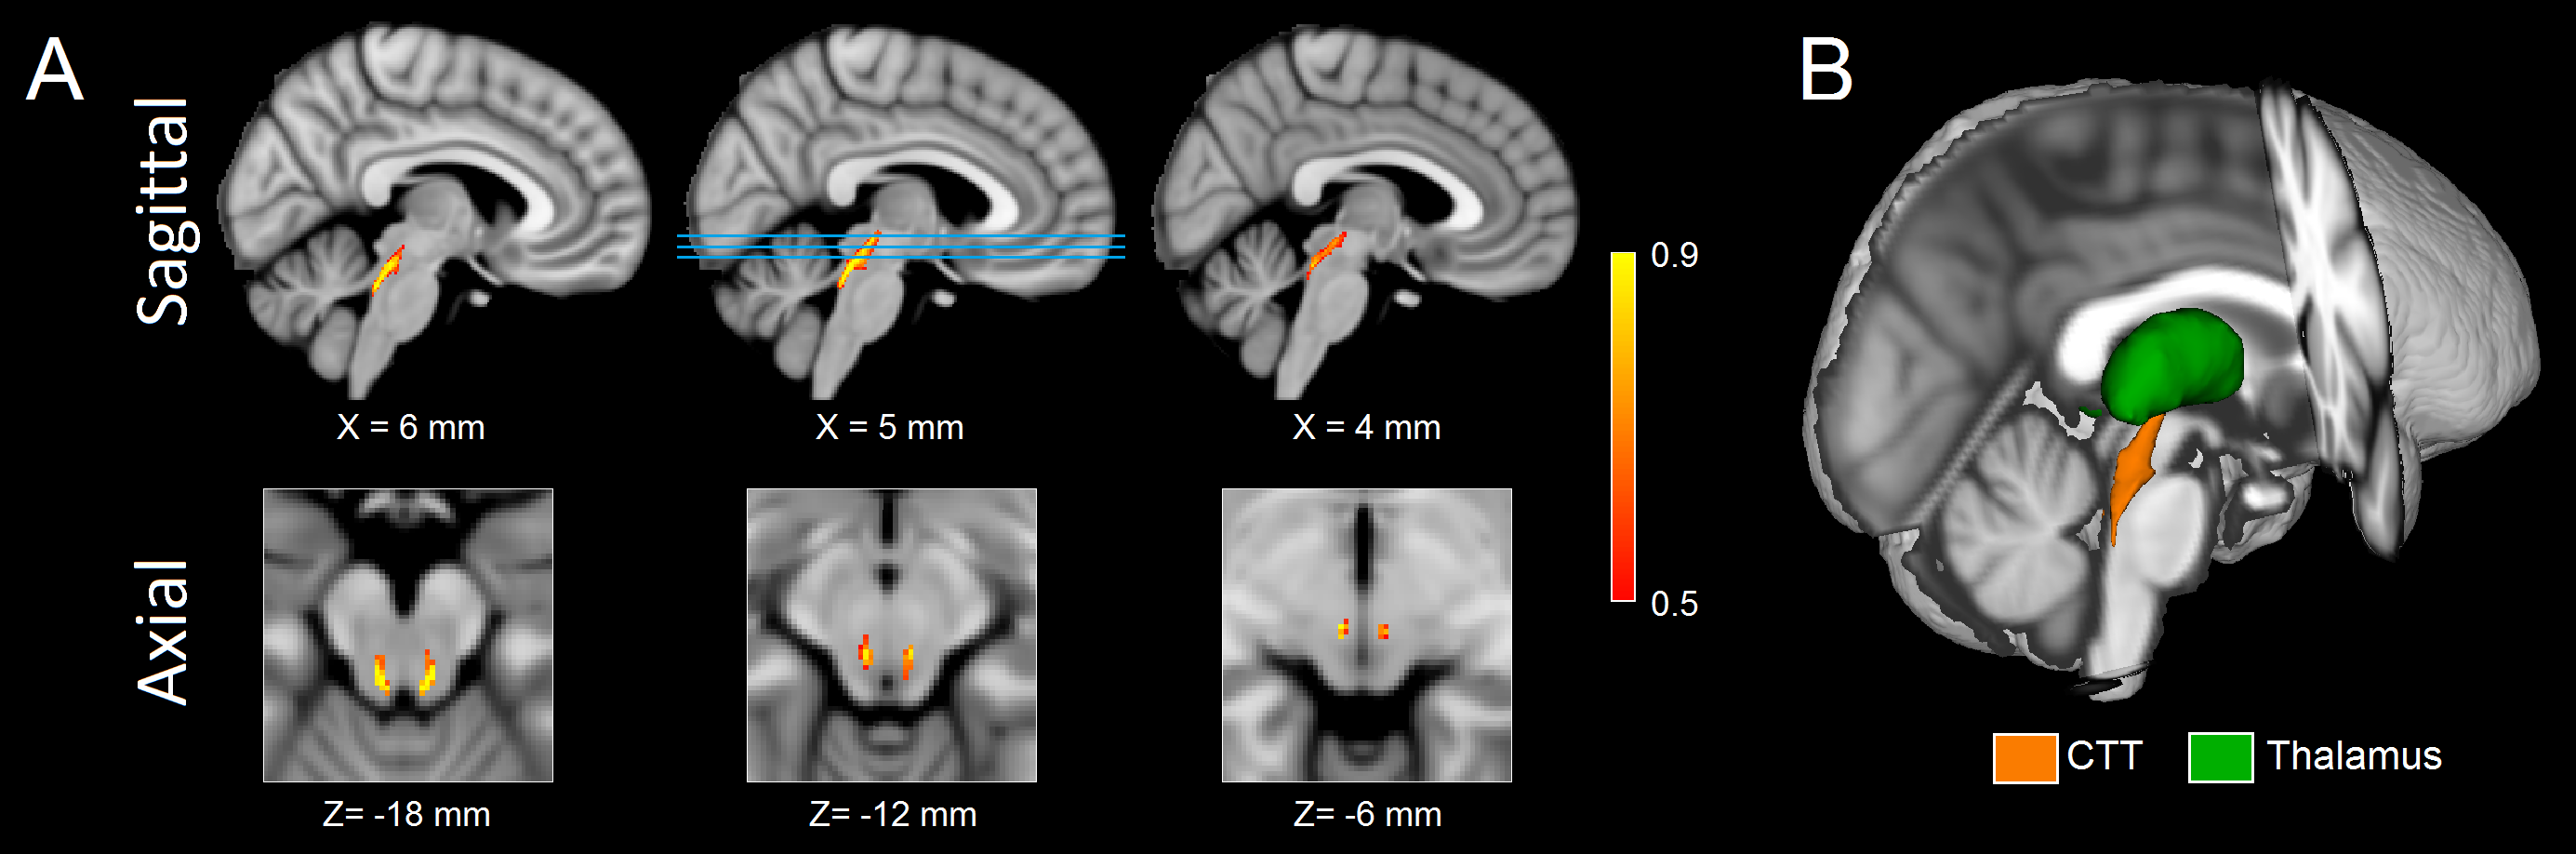
Figure 1. Sagittal (A; top row) and axial (A; bottom row) of population maps showing the CTT ROI used in this analysis. The lines in sagittal view at X=5 mm identify the location of the axial slices shown in the bottom row in MNI space. A three dimensional rendering of the CTT is shown in B.
CTT - central tegmental tract; ROI - region of interest; MNI - Montreal Neurological Institute
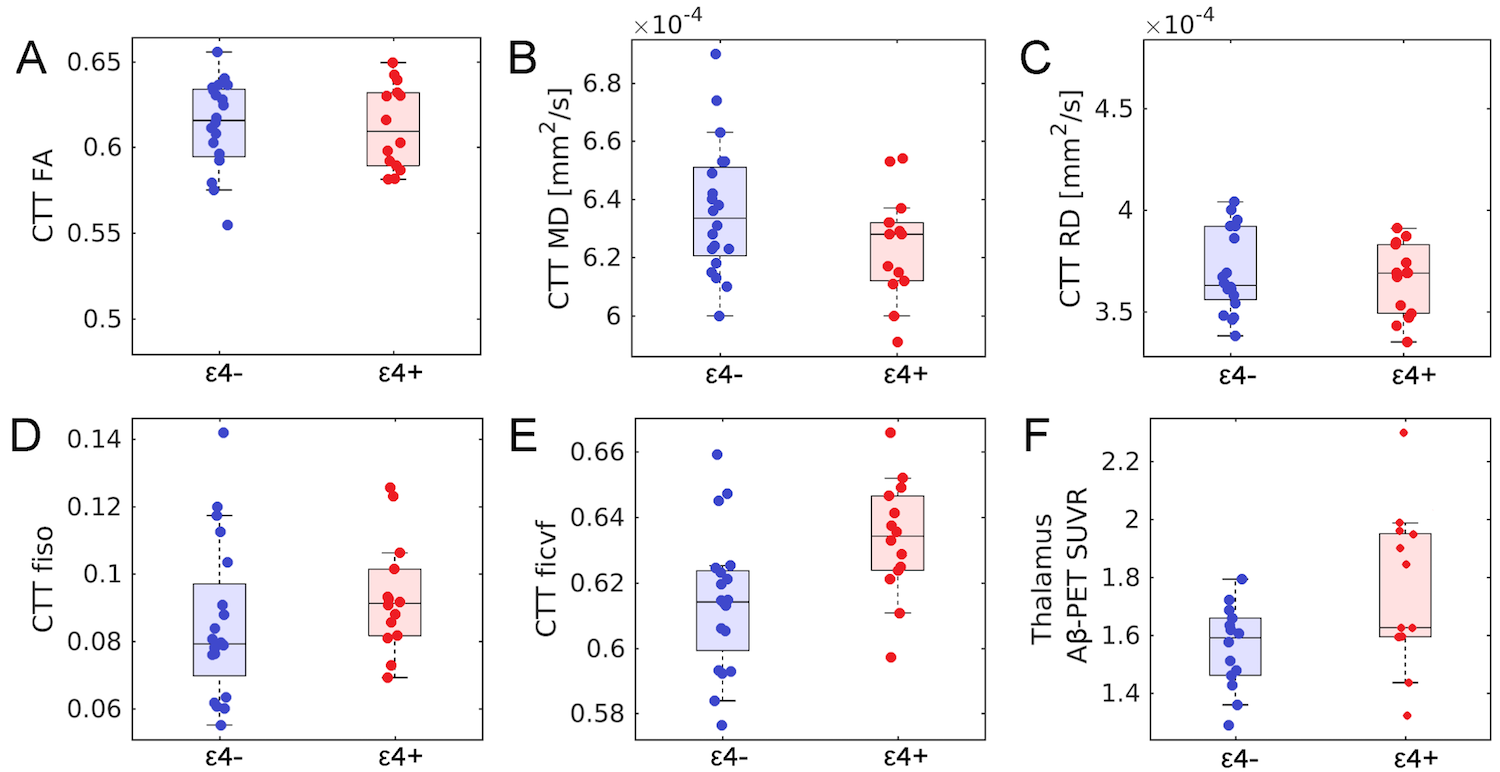
Figure 2. Group comparisons for CTT microstructure are shown in A-E. A decrease in CTT MD (p=0.038) and an increase in ficvf (p=0.007) are seen in APOE-ε4 positive subjects relative to APOE-ε4 negative subjects. An increase in thalamus Aβ-PET SUVR (p=0.028) was seen in the APOE-ε4 positive subjects as compared to APOE-ε4 negative subjects (shown in F).
FA - fractional anisotropy; MD - mean diffusivity ; RD - radial diffusivity; AD - axial diffusivity; ficvf -
intra-cellular
compartment volume fraction; SUVR -
standardized uptake
value ratio