2590
Susceptibility-Based Characterization of Venous Distribution and Oxygen Extraction Fraction in Brains with Glioma at 7T1Shenzhen Institutes of Advanced Technology, Chinese Academy of Sciences, Shenzhen, China, 2University of Chinese Academy of Sciences, Beijing, China, 3State Key Laboratory of Brain and Cognitive Science, Beijing MRI Center for Brain Research, Institute of Biophysics, Chinese Academy of Sciences, Beijing, China, 4Neurosurgery, Beijing Tiantan Hospital of Capital Medical University, Beijing, China
Synopsis
Vein density and oxygen extraction fraction were quantified in brains with glioma using a susceptibility-based approach at 7T. Brains with low grade glioma featured more extensive areas with significant difference in vein density and OEF between the homotopic ROIs that mainly involve fronto-parietal areas and basal ganglia, in contrast to brains with high grade glioma with the differential vein density and OEF distribution mainly involving bilateral thalami. The inter-homotopic measurements of vein density and OEF were significantly correlated, suggesting that the oxygen metabolism malfunction in brains with high grade glioma might be partially ascribed to the altered venous distribution.
Introduction
Cerebral glioma triggers extensive functional remodeling in the brain, which may be substrated by hemodynamic and metabolic alterations.1 Vascular and oxygenation alterations in the tumor are among the pivotal mechanisms mediating the disease progression. However, it remains unclear how the venous distribution varies in brains with glioma at the global level. In this preliminary study, we aim to explore the effect of glioma with different malignant grade on cerebral venous distribution and oxygen extraction fraction (OEF) simultaneously based on susceptibility weight imaging (SWI).Methods
This study was approved by local institutional review board. Twenty-five subjects with histologically confirmed low grade glioma (LGG, WHO II, male/female 12/5, aged 38.8±8.5 years) or high grade glioma (HGG, WHO III or IV, male/female 4/4, age 46.1±11.4 years) were consecutively recruited. SWI data was acquired using gradient echo pulse sequence (7.0T, Siemens, Erlangen, Germany) with a 32 channel phase array head coil. The major imaging parameters were TR/TE 23/15ms, FA 12°, matrix 768×696, voxel 0.28mm×0.28mm×2mm. Quantitative susceptibility map (QSM) was created using the morphology enabled dipole inversion (MEDI) method.2 Automated vein segmentation was performed using prior atlas (manual veins, SWI, QSM)3 and individual data (SWI, QSM). OEF map was estimated from QSM images based on following equation4:$$OEF=\frac{\triangle\chi}{\triangle\chi_{do}\times{Hct}}$$
where$$${\triangle\chi}$$$ is the susceptibility differences between venous structure and surrounding brain tissues that was calculated by QSM, $$${\triangle\chi_{do}}$$$ (1.8×10⁻⁷ in CGS units) is the susceptibility difference per unit hematocrit (empirically set as 0.45) between fully deoxygenated blood and fully oxygenated blood. Venous structure and OEF maps were spatially normalized to standard Montreal Neurological Institute template space. The brain of each subject was segmented into 90 regions of interest (ROI) based on the Automatic Anatomical Labe atlas. Vein density (sum of vessel voxels divided by the sum of voxels in ROI) and OEF were calculated for each ROI and compared between the homotopic regions (paired t-test, p<0.05, FDR corrected). Pearson’s correlation was conducted to examine the bivariate correlation between vein density and OEF.
Results
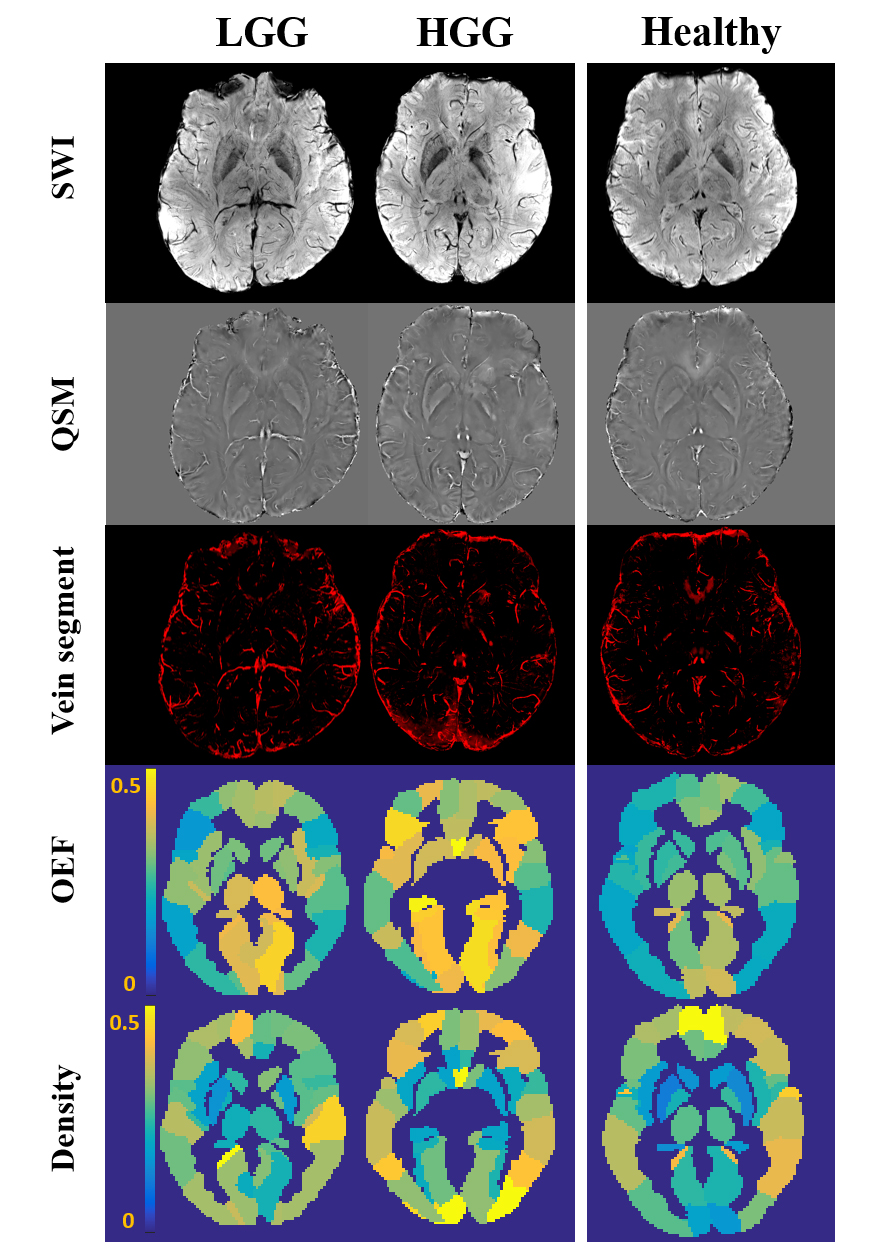
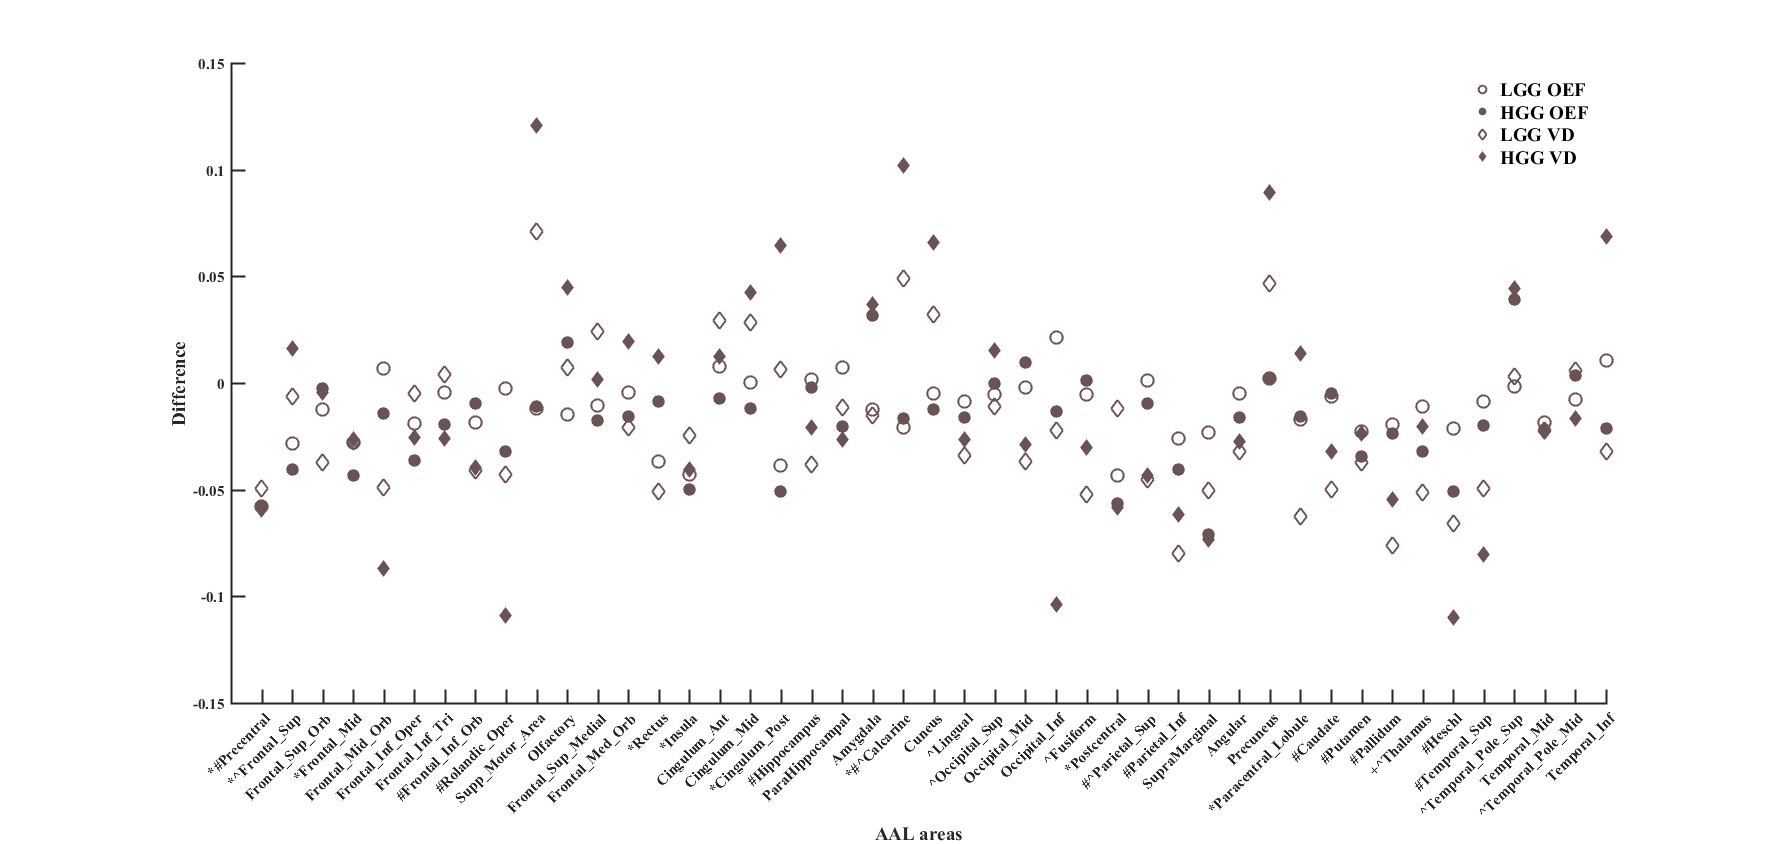
Representative maps of vein density and OEF were illustrated in Figure 1. LGGs and HGGs showed different patterns of venous and OEF distributions at the whole brain level (Figure 2). LGG brains featured more extensive areas with significant difference in vein density and OEF between the homotopic ROIs that mainly involve precentral, rolandic, basal ganglia and fronto-parietal areas, while HGG brains showed differential vein density mainly in thalamus and sparsely distributed cortical areas, and OEF difference between the bilateral thalami only (p<0.05, FDR corrected). OEF didn’t correlate with vein density for either LGGs or HGGs group (p>0.05). Inter-homotopic difference of vein density and OEF were significantly correlated for HGGs (R2=0.16, F=8.30, p<0.01), while the same analysis revealed no correlation for LGGs (p>0.05).Discussion and Conclusions
Focal gliomas induced differential venous and OEF distribution at the whole brain level. Low grade gliomas are associated with more extensive interhemispheric differences in vein density and OEF, as compared with high grade ones. The inter-homotopic difference of OEF and vein density are significantly correlated in HGGs, suggesting that oxygen malfunction HGGs might be partially ascribed to the altered venous distribution. Since alterations in vascular topology and oxygen metabolism are reflective of tumor kinetics,1 characterization of the global venous and OEF distribution may be of additional therapeutic significance for the disease characterization and management of glioma.Acknowledgements
This study was partially supported by GJHZ20180928120207356 and NSFC (81627901, 81961128030 and 81871350).References
1. Pries AR, et al. The shunt problem: control of functional shunting in normal and tumour vasculature. Nat Rev Cancer 2010; 10: 587–593.
2. Liu T, Liu J, de Rochefort L, Spincemaille P, Khalidov I, Ledoux JR, et al. Morphology enabled dipole inversion (medi) from a single-angle acquisition: Comparison with cosmos in human brain imaging. Magn Reson Med. 2011;66:777-783
3. Batchelor TT, et al. Improved tumor oxygenation and survival in glioblastoma patients who show increased blood perfusion after cediranib and chemoradiation. Proceedings of the National Academy of Sciences. 2013;110:19059-19064
4. Miyata M, et al. Evaluation of oxygen extraction fraction in systemic lupus erythematosus patients using quantitative susceptibility mapping. J Cereb Blood Flow Metab. 2019;39:1648-1658
Figures