2589
Noninvasive assessment of MGMT promoter methylation status in grade II-IV gliomas using inflow-based vascular-space-occupancy1Department of Medical Imaging, Nanfang Hospital, Southern Medical University, Guangzhou, China, 2Department of Radiology, Guangdong 999 Brain Hospital, Guangzhou, China, 3Neurosection, Division of MRI Research, Department of Radiology, Johns Hopkins University School of Medicine, Baltimore, MD, United States, 4F.M. Kirby Research Center for Functional Brain Imaging, Kennedy Krieger Institute, Department of Radiology, Johns Hopkins University School of Medicine, Baltimore, MD, United States, 5Philips healthcare, Guangzhou, China
Synopsis
Accurate prediction of O(6)-methylguanine-DNA methyltransferase (MGMT) promoter methylation status preoperatively is important. DSC-MRI can predict MGMT promoter methylation status in glioblastomas but not in lower-grade gliomas. Inflow-based vascular-space-occupancy (iVASO), a novel perfusion technique without the need for exogenous contrast agents, emphasizes the perfusion blood volume in arteries and arterioles. In this study, the predictive ability for MGMT promoter methylation status of iVASO histogram features was investigated. The results showed that iVASO-based histogram features accurately predicted the methylation status of MGMT promoter in gliomas. This suggests that iVASO may be a promising noninvasive imaging tool in predicting MGMT promoter methylation.
INTRODUCTION
O(6)-methylguanine-DNA methyltransferase (MGMT) is reported to play an important role in modulating angiogenesis and is correlated with prognosis1,2. MGMT promoter methylation status is important for treatment planning. DSC-MRI can predict MGMT promoter methylation status in glioblastoma (GBM) by measuring relative cerebral blood volume (rCBV) but failed in a grade II-IV cohort of gliomas3,4. However, the prediction of MGMT methylation for GBM alone carries apparent limitations in preoperative application5. Also, DSC-MRI requires gadolinium contrast agents. iVASO uses endogenous contrast agent to quantify arteriolar cerebral blood volume (CBVa)6,7 and can accurately predict glioma grading8. This study aimed to investigate the potential of CBVa in predicting MGMT promoter methylation status.METHODS
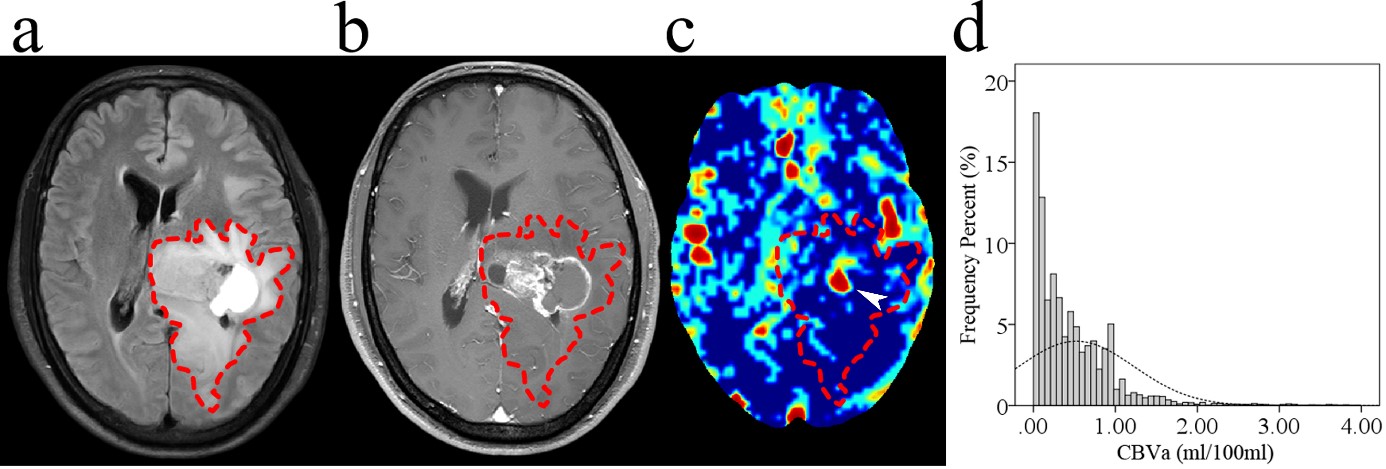
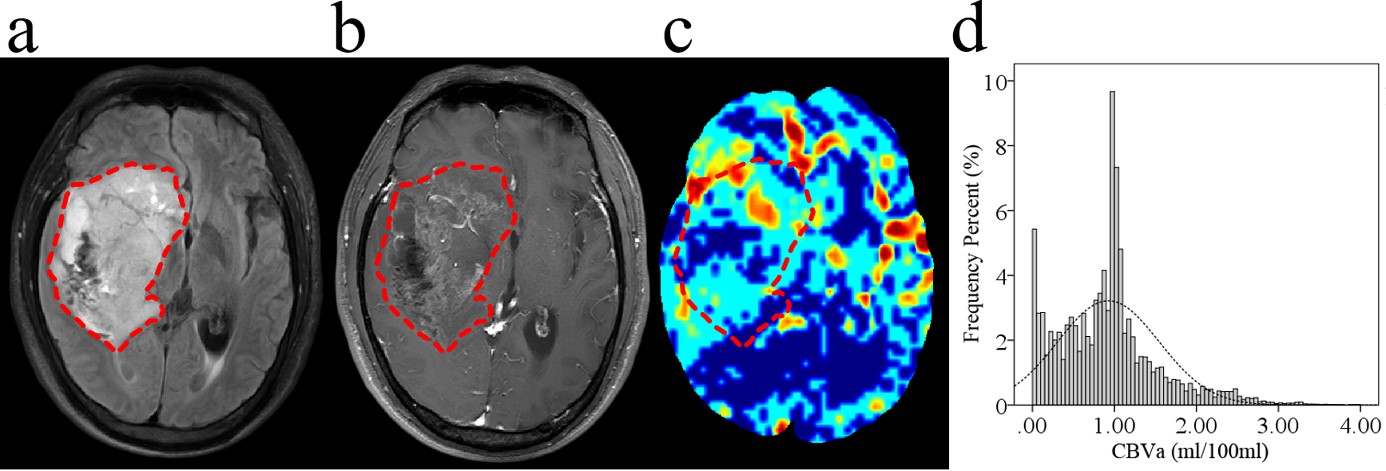
Forty-six patients with grade II-IV glioma confirmed by surgery and pathology, of which 20 are positive for MGMT promoter methylation, underwent iVASO and structural MR sequences with a 3T clinical scanner (Achieva TX, Philips) preoperatively. 3D-iVASO was performed with gradient spin echo readout, TE = 10 ms; TR/TI = 5000/1040, 3100/862, 2500/756, 2000/641, 1700/558, 1300/430 ms; voxel = 2.5 × 2.5 × 6 mm3, 14 slices; parallel imaging acceleration (SENSE) = 2 × 2; crusher gradients of b = 0.3 s/mm2 and Venc = 10 cm/s on z-direction. Whole tumor ROIs were drawn semi-automatically by two neuroradiologists independently. Fourteen CBVa histogram features as well as 16 structural imaging features were extracted and assessed. Top features ranked according to Gini index established by random forest algorithm were used to construct prediction models for MGMT methylation status. Receiver operating characteristic (ROC) curve with the area under the curve (AUC) and leave-one-out cross-validation (LOOCV) were used to assess predictive effectiveness and stability.RESULTS
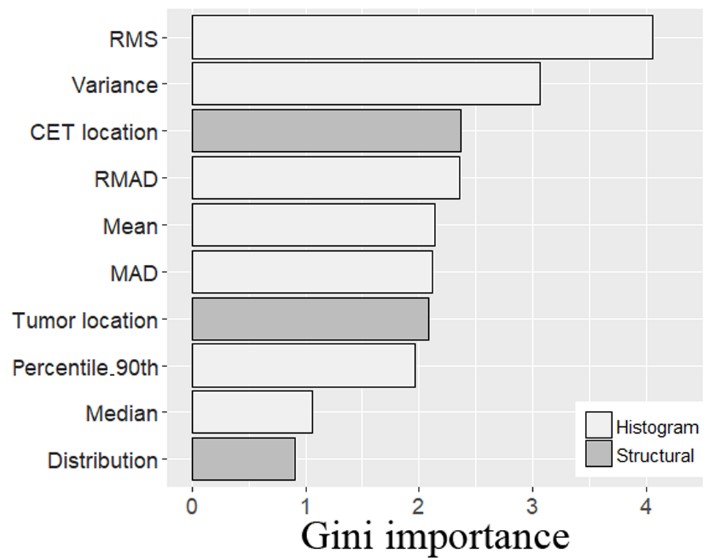
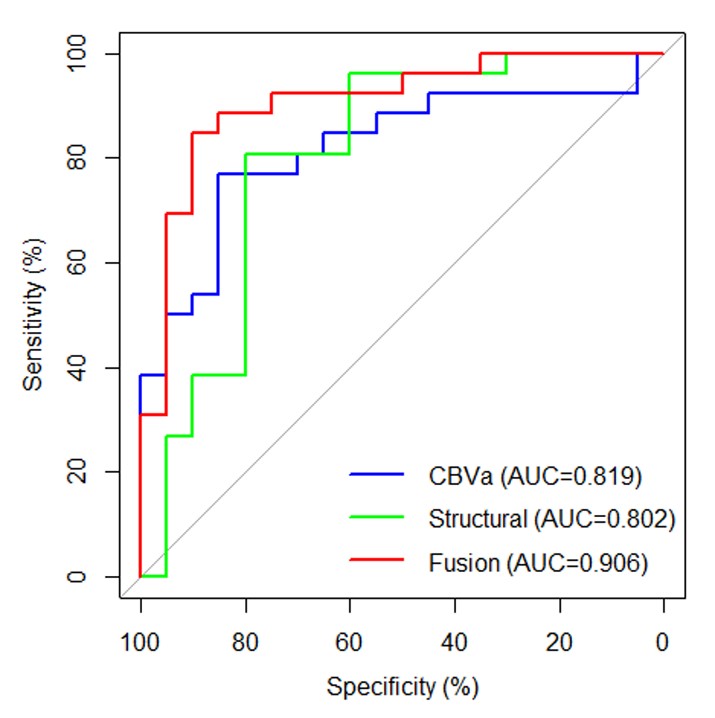
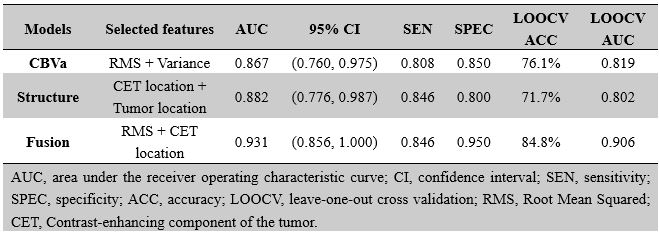
The location of contrast-enhancing component of the tumor (CET) (P = 0.002), tumor location (P = 0.010), and distribution (P = 0.010) differed between MGMT promoter methylated and unmethylated groups. The Median (P = 0.015), RMAD (P = 0.002), MAD (P = 0.002), RMS (P < 0.001), Percentile_90th (P = 0.002), Variance (P < 0.001), and Mean (P = 0.001) of CBVa differed between two groups, while other CBVa histogram features did not show significant difference. The representative cases are shown in Fig. 1 and Fig. 2. The top two CBVa histogram features in predicting MGMT promoter methylation were Root Mean Squared (RMS) (Gini = 4.05) and Variance (Gini = 3.07). The top two structural imaging features were contrast-enhancing component of the tumor (CET) location (Gini =2.37) and tumor location (Gini = 2.09) (Figure 3). Both the CBVa model of RMS and Variance (ROC, AUC = 0.867; LOOCV, AUC= 0.819) and the model of structural features (ROC, AUC = 0.882; LOOCV, AUC = 0.802) accurately predicted MGMT methylation. The fusion model of CBVa RMS and CET location improved the diagnostic performance (ROC, AUC = 0.931; LOOCV, AUC =0.906) (Table 1, Figure 4).DISCUSSION
In this study, iVASO was shown able to predicted the methylation status of MGMT promoter in grade II-IV gliomas, and the combination of structural imaging features and CBVa histogram features further improved the performance. Although DSC-rCBV was a robust biomarker in evaluating tumoral microvasculature, it was not associated with MGMT protein expression in grade II-IV gliomas4. We speculated that the perfusion changes caused by MGMT protein might be weak in lower-grade tumors, and the floor effect compromised the diagnostic performance of DSC-rCBV. iVASO emphasizes the perfusion blood volume in arteries and arterioles9. Physiologically, arterioles and pial arteries are the most actively regulated blood vessels in the microvasculature. Therefore, CBVa might be more sensitive in reflecting small perfusion changes in lower-grade gliomas. Besides, MGMT protein expression and promoter methylation are distributed heterogeneously in gliomas and highly correlate with tumor oxygenation and vascularization3,10. In the present study, we applied a semi-automated segmentation method as well as histogram analysis to reduce subjective bias and enable a comprehensive assessment of tumor perfusion and heterogeneity. Furthermore, our study showed that the fusion model of CBVa histogram feature and structural feature outperformed the model based on CBVa histogram features or structural features alone.CONCLUSION
iVASO-CBVa is a promising imaging biomarker in predicting MGMT promoter methylation in grade II-IV gliomas and may provide a preoperative basis for individualized treatment planning.Acknowledgements
No acknowledgement found.References
1. Chahal M, Xu Y, Lesniak D, et al. MGMT modulates glioblastoma angiogenesis and response to the tyrosine kinase inhibitor sunitinib. Neuro Oncol. 2010;12(8):822-833.
2. Pistollato F, Abbadi S, Rampazzo E, et al. Intratumoral hypoxic gradient drives stem cells distribution and MGMT expression in glioblastoma. Stem Cells. 2010;28(5):851-862.
3. Crisi G, Filice S. Predicting MGMT promoter methylation of glioblastoma from dynamic susceptibility contrast perfusion: a radiomic approach. J Neuroimaging. 2020;30(4):458-462
4. Qin JB, Zhang H, Wang XC, et al. Combination value of diffusion-weighted imaging and dynamic susceptibility contrast-enhanced MRI in astrocytoma grading and correlation with GFAP, topoisomerase IIα and MGMT. Oncol Lett. 2019;18(3):2763-2770.
5. Smits M, Van Den Bent MJ. Imaging correlates of adult glioma genotypes. Radiology. 2017;284(2):316-331.
6. Hua J, Qin Q, Donahue MJ, et al. Inflow-based vascular-space-occupancy (iVASO) MRI. Magnetic Resonance in Medicine. 2011;66(1):40-56.
7. Hua J, Qin Q, Pekar JJ, et al. Measurement of absolute arterial cerebral blood volume in human brain without using a contrast agent. NMR in Biomedicine. 2011;24(10):1313-1325.
8. Wu Y, Agarwal S, Jones CK, et al. Measurement of arteriolar blood volume in brain tumors using MRI without exogenous contrast agent administration at 7T. J Magn Reson Imaging. 2016;44(5):1244-1255.
9. Hua J, Liu P, Kim T, et al. MRI techniques to measure arterial and venous cerebral blood volume. Neuroimage 2019;187:17-31.
10. Fontana L, Tabano S, Bonaparte E, et al. MGMT-methylated alleles are distributed heterogeneously within glioma samples irrespective of IDH Status and chromosome 10q Deletion. J Neuropathol Exp Neurol 2016;75(8):791-800.
Figures