2584
Post-surgery network reorganization in glioma patients: a longitudinal study of functional segregation and centrality
Beatrice Federica Luciani1, Francesca Saviola1, Luca Zigiotto2,3, Stefano Tambalo1, Domenico Zacà1, Lisa Novello1, Silvio Sarubbo2,3, and Jorge Jovicich1
1CIMeC Center for Mind/Brain Sciences, University of Trento, Rovereto (Trento), Italy, 2Department of Neuroscience, Division of Neurosurgery, S.Chiara Hospital, APSS, Trento, Italy, 3Structural and Functional Connectivity Lab, S.Chiara Hospital, APSS, Trento, Italy
1CIMeC Center for Mind/Brain Sciences, University of Trento, Rovereto (Trento), Italy, 2Department of Neuroscience, Division of Neurosurgery, S.Chiara Hospital, APSS, Trento, Italy, 3Structural and Functional Connectivity Lab, S.Chiara Hospital, APSS, Trento, Italy
Synopsis
In glioma patients, tumor lateralization and grade can critically affect the underlying brain functional connectivity. Little is known about how functional connectivity changes after surgical glioma resection. We employed graph theory analysis to investigate post-surgery longitudinal reorganization of functional networks at global (network-wide) and local (nodal) level. We found that left-lateralized and/or high-grade gliomas show reduced segregation and centrality properties over time, compared to right-lateralized and low-grade gliomas. Our results suggest the importance of pre-surgical mapping of hub networks like the default mode network, in addition to visual, motor and language networks.
Introduction
The paradigm of brain connectomics applied to neuro-oncology allows the study of how gliomas disrupt structural and functional neural connections1. Resting-state functional Magnetic Resonance Imaging (rs-fMRI) enables the non-invasive characterization of functional spatial networks2. Previous studies show a decreased efficiency of information flow in glioma patients, pre-surgically, relative to healthy controls (HC)1,3,4,5. In this framework, two potential predictors of functional connectivity (FC) deficits in glioma patients have been evidenced: (i) tumor hemispheric lateralization and (ii) tumor grade. However, the way in which the functional reorganization of networks changes distant from the lesion site is not fully understood, in particular post-treatment. In this study, we investigated how glioma grade (high, HGG and low, LGG) and glioma hemispheric lateralization affect brain functional reorganization after surgical resection, focusing on functional integration and segregation properties derived from graph theory (GT) analyses6.Methods
Patients: Twenty-five adult glioma patients were recruited (15 HGG; 19 males; 14 left gliomas; age 48±14.13 years; tumor volume 29.6±29.9 mm3).MRI acquisition: structural T1-weighted and rs-fMRI data were collected on a 1.5 MRI system7, pre-operatively and post-surgery over a period of 15 months (2-4 time points). Full-brain rs-fMRI data were acquired with a 2D T2*-weighted gradient-echo echo-planar imaging (EPI) sequence (TR = 2600 ms, voxel resolution = 4mm3 isotropic, TE = 45 ms, FA = 87°, FOV = 256×256 mm2, n° slices = 33-35, acceleration factor ASSET = 2).
Analyses: Figure 1 schematically shows the analyses pipeline. After preprocessing7, topological global and nodal graph metrics were computed from 333x333 FC matrices8, using proportional thresholding (15%)9. Global efficiency (GE) transitivity (T) and mean clustering coefficient (Clavg) inform on the occurrence of functional integration (GE) and specialized processing within strongly interconnected groups of brain regions (T and Clavg) at the whole-brain level; therefore, we estimated them to investigate global reorganization of functional networks. In parallel, clustering coefficient (Cl) and betweenness centrality (BC) were employed to gain insights into individual nodes’ local functional specialization10,11,12. No a-priori anatomical definitions of hubs and non-hubs regions were used. We verified that tumor overlap with gray matter was low (<2%), so tumor masks were not applied to the functional analyses. Linear Mixed Models were fitted for statistical analysis (lmer function13) in R version 4.0.214. False Discovery Rate (FDR)15 was applied to correct for multiple testing related to the different graph metrics, but also to correct for multiple testing for each node, with respect to the different graph metrics.
Results
We found no significant interaction effects of Time x Tumor hemispheric lateralization (i) and Time x Tumor grade (ii) on global FC measures (p>0.05, FDR-corrected). Despite this, at the nodal (local) level, we found significant decrease over time (β<0, p<0.05) for (a) clustering coefficient in nodes in left/right hemispheres (default mode, DMN, and frontoparietal, FPN, networks, cingulo-opercular, CO, visual, ventral/dorsal attention, VA/DA, retrosplenial-temporal RST networks), and (b) betweenness centrality (DMN, SMN, VA, Vis), in left-lateralized gliomas patients (Figure 2). Significant negative effect (β<0, p<0.05) of Time x Tumor grade was also found for clustering coefficient in DMN, FPN, CO, Visual and Auditory networks’ nodes for HGG patients (Figure 3).Discussion
Our findings suggest that in gliomas, hemispheric lateralization and grade may help predicting the clinical outcome of post-surgical resection at 1–2 years post-intervention in terms of longitudinal FC changes. Global resting-state fMRI FC measures did not significantly change over time after brain surgery. However, the hemispheric location of the tumor and its grade showed effects in post-surgical functional brain plasticity. Left-lateralized gliomas showed reduced specialization and centrality relative to right-hemisphere gliomas. With regards to tumor grade, HGG showed reduced local reorganization of functional networks, with decreased longitudinal functional specialization of individual nodes relative to LGG. Due to the sample characteristics, we could not disentangle tumor grade effects from treatment. In fact, the combination of radiotherapy with chemotherapy for some HGG patients may have increased the different longitudinal FC patterns between HGG and LGG16. Overall, we show reduced longitudinal functional segregation and centrality of nodes belonging to hubs (i.e. brain regions depicted to higher cognitive functions) and non-hubs (i.e. brain regions of primary cortices)4. This may indicate a tendency for specific hub nodes to drive the post-surgical longitudinal reorganization at a global level. This interpretation helps to emphasize the critical relevance of functional networks involving hubs (i.e. DMN and FPN) for post-surgical recovery over time. Therefore, our results suggest that for presurgical mapping it is not only important to map visual, motor and language networks (non-hubs)5, but also hub networks, to minimize their damage, in particular in glioma patients with left-lateralized and/or high-grade tumors.Conclusion
To the best of our knowledge, this is the first study evaluating post-surgery longitudinal human brain functional plasticity properties of network segregation in glioma patients. Our main findings are i) left-hemisphere glioma and high-grade glioma show reduced longitudinal reorganization of functional segregation and centrality properties, and ii) hub networks support post-surgical plasticity, especially the DMN, thus highlighting the importance of its consideration in pre-surgical planning.Acknowledgements
This study was partially funded by the Dipartimento di Eccellenza project, 232 law of 2016, by Fondazione Paolina Lucarelli Irion of Rovereto (TN) and by Fondazione Caritro (“Bando 2015 per progetti di ricerca scientifica svolti da giovani ricercatori”, University of Trento, Trento, Italy).References
- Aerts, H., Fias, W., Caeyenberghs, K., Marinazzo, D., 2016. Brain networks under attack: Robustness properties and the impact of lesions. Brain 139, 3063–3083.
- Biswal, B., Zerrin Yetkin, F., Haughton, V.M., Hyde, J.S., 1995. Functional connectivity in the motor cortex of resting human brain using echo-planar mri. Magn Reson Med. 34, 537–41.
- Esposito, R., Mattei, P., Briganti, C., Romani, G.L., Tartaro, A., Caulo, M., 2012. Modifications of default-mode network connectivity in patients with cerebral glioma. PloS one 7, e40231.
- Derks, J., Dirkson, A.R., de Witt Hamer, P.C., van Geest, Q., Hulst, H.E., Barkhof, F., Pouwels, P.J., Geurts, J.J., Reijneveld, J.C., Douw, L., 2017. Connectomic profile and clinical phenotype in newly diagnosed glioma patients. NeuroImage: Clinical 14, 87–96.
- Fox, M.E., King, T.Z., 2018. Functional Connectivity in Adult Brain Tumor Patients: A Systematic Review. Brain Connectivity 8, 381–397.
- van den Heuvel, M.P., Hulshoff Pol, H.E., 2010. Exploring the brain network: A review on resting-state fmri functional connectivity. European Neuropsychopharmacology 20, 519 – 534.
- Zacà, D., Jovicich, J., Corsini, F., Rozzanigo, U., Chioffi, F., Sarubbo, S., 2018. Restneumap: a tool for automatic extraction of resting-state functional MRI networks in neurosurgical practice. Journal of Neurosurgery JNS 131, 764 – 771.
- Gordon, E.M., Laumann, T.O., Adeyemo, B., Huckins, J.F., Kelley, W.M., Petersen, S.E., 2016. Generation and Evaluation of a Cortical Area Parcellation from Resting-State Correlations. Cereb. Cortex 26, 288–303.
- van den Heuvel, M.P., de Lange, S.C., Zalesky, A., Seguin, C., Yeo, B.T., Schmidt, R., 2017. Proportional thresholding in resting-state fMRI functional connectivity networks and consequences for patient-control connectome studies: Issues and recommendations. NeuroImage 152, 437–449.
- Bullmore, E., Sporns, O., 2009. Complex brain networks: Graph theoretical analysis of structural and functional systems. Nat Rev Neurosci 10, 186– 198.
- Rubinov, M., Sporns, O., 2010. Complex network measures of brain connectivity: Uses and interpretations. NeuroImage 52, 1059–1069.
- Sporns, O., 2011. Networks of the Brain. MIT Press, Cambridge, Mass.
- Bates D., Mächler M., Bolker B., Walker S., 2015. “Fitting Linear Mixed-Effects Models Using lme4.” Journal of Statistical Software, 67(1), 1–48.
- R Core Team, 2020. R: A language and environment for statistical computing. R Foundation for Statistical Computing, Vienna, Austria. URL http://www.R-project.org/
- Benjamini, Y., Hochberg, Y., 1995. Controlling the false discovery rate - a practical and powerful approach to multiple testing. J. Royal Statist. Soc., Series B 57, 289 – 300.
- Lawrie TA, Evans J, Gillespie D, Erridge S, Vale L, Kernohan A, Grant R, 2018. Long‐term side effects of radiotherapy, with or without chemotherapy, for glioma. Cochrane Database of Systematic Reviews, Issue 6. Art. No.: CD013047.
Figures
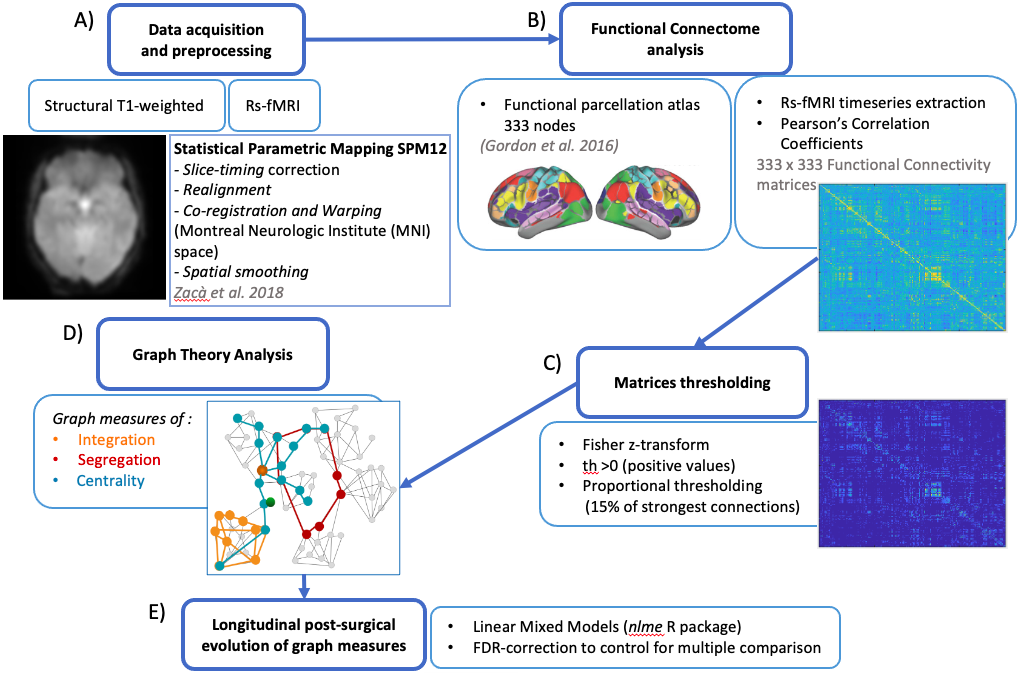
Data acquisition and preprocessing (A), time-series extraction, Pearson’s Correlation coefficients computation to derive FC matrices and brain functional parcellation (B) preceded Graph analyses. FC matrices were processed to remove negative values and weaker correlations (C). Global and nodal graph metrics (D) were computed using the Brain Connectivity Toolbox11 and statistically analyzed by implementing linear mixed models for each measure in R 4.0.214 (E).
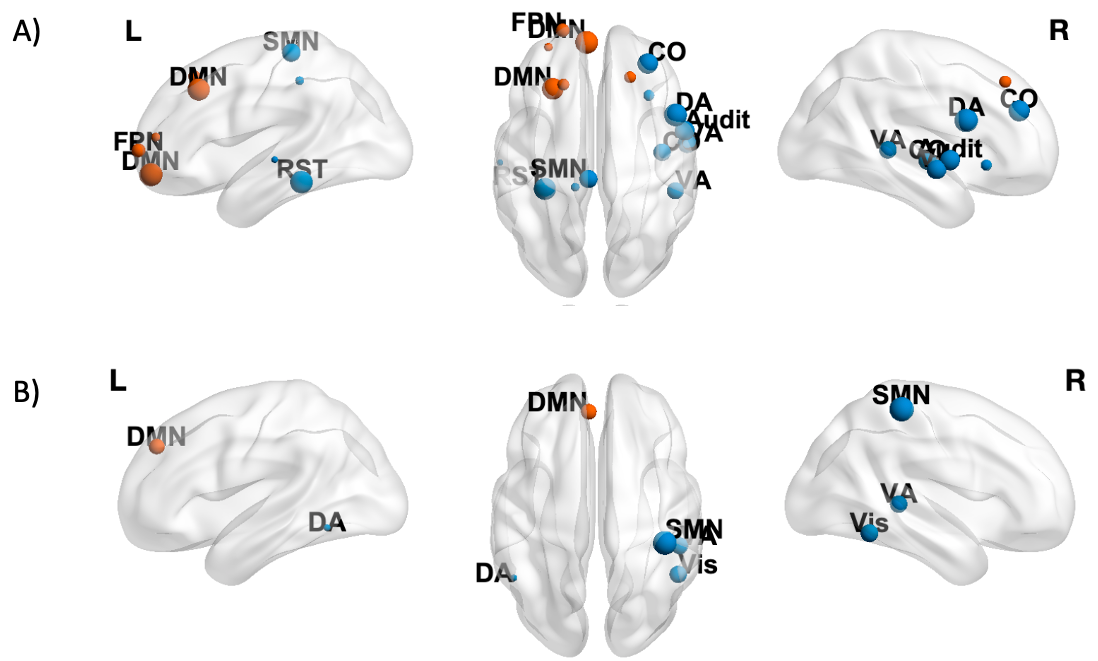
Nodes showing a significant negative effect (β<0, p<0.05 FDR-corrected) of Time on CI (A) and BC (B) are shown in blue (non-hubs) and orange (hubs). Nodes are weighted for the statistical significance (p-value). For image display purposes, concerning CI, labels are plotted for most significant nodes (threshold 0.03).
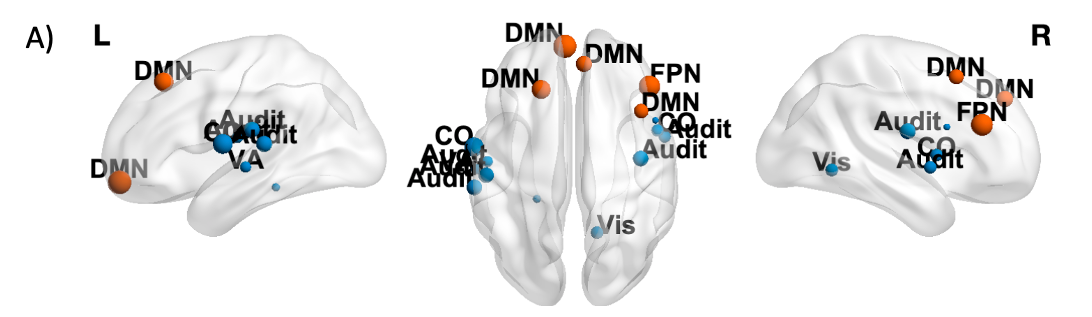
Nodes showing a significant negative effect (β<0, p<0.05 FDR-corrected) of Time × Tumor grade on Cl in LGG patients are represented in blue (non-hubs) and orange (hubs). Nodes are weighted for the statistical significance (p-value). For image display purposes, concerning Cl, labels are plotted for most significant nodes (threshold 0.03).