2581
Exploring edematous nerve fibers by using Neurite Orientation Dispersion and Density Imaging
Shin Tai Chong1, Xinrui Liu2, Hung-Wen Kao3, Chien-Yuan Eddy Lin4, Sanford PC Hsu5, and Ching-Po Lin1
1Institute of Neuroscience, National Yang-Ming University, Taipei, Taiwan, 2Department of Neurosurgery, First Hospital of Jilin University, Jilin, China, 3Tri-Service General Hospital, National Defense Medical Center, Taipei, Taiwan, 4GE Healthcare, Taipei, Taiwan, 5Department of Neurosurgery, Neurological Institute, Taipei Veterans General Hospital, Taipei, Taiwan
1Institute of Neuroscience, National Yang-Ming University, Taipei, Taiwan, 2Department of Neurosurgery, First Hospital of Jilin University, Jilin, China, 3Tri-Service General Hospital, National Defense Medical Center, Taipei, Taiwan, 4GE Healthcare, Taipei, Taiwan, 5Department of Neurosurgery, Neurological Institute, Taipei Veterans General Hospital, Taipei, Taiwan
Synopsis
We hypothesized that the Neurite Orientation Dispersion and Density Imaging (NODDI)-based tractography could improve the reconstruction of the fiber tracts that by tracking through regions of peritumoral edema. In visual comparison with diffusion tensor imaging (DTI), we found that NODDI-based tractography of the corticospinal tract (CST) showed higher sensitivity and specificity in the region of peritumoral edema. The NODDI-based tractography was validated in two patients with tumors resected for five years. With this technique, neurosurgeons may develop better surgical planning to maximize tumor resection and minimize functional loss.
Introduction
Diffusion tensor imaging (DTI) has been proven failed to tract the edematous nerve fiber due to the increasing uncertainty in fractional anisotropy (FA)1,2. However, those “missing” tracts may provide vital information for surgery. Several studies suggested that neurite orientation dispersion and density imaging (NODDI) provided unique contrast in brain tumor3, which can reveal the differences between tumor infiltration and vasogenic edema4, and characterized white matter fibers involved in edematous5. This multi-compartment model has a great potential to highlight and improved fiber tractography in the peritumoral edema. However, the application and a systematic comparison of NODDI-based tractography in clinical are still absent.Method
A total of 24 newly diagnosed brain tumor patients with severely peritumoral edema and 10 healthy participants were recruited from two scanners (Tri-Service General Hospital, Taipei, Taiwan on a 3T GE machine, Discovery MR 750; and The First Hospital of Jilin University, Jilin, China on a 3T Siemens machine, Magnetom Verio). The details of Imaging acquisition was summarized in Figure 1. All diffusion-weighted images (DWIs) data were processed by the in-house DWI preprocess pipeline (OGIO), which included: denoising, Gibbs-ring removal, susceptibility distortion correction, eddy current and motion correction. After pre-processing, all DWIs were used in the NODDI model fitting (with NODDI MATLAB toolbox, http://www.nitrc.org/projects/noddi_toolbox/). Only low b-values images (<1500s/mm2) were used in the DTI model fitting. After all model fitting, the following voxel-wise maps were obtained. We evaluated the first eigenvector for the principal directions on DTI tractography and used the fractional anisotropy (FA) as fiber tractography termination criteria. For NODDI-derived indices, the orientation dispersion index (ODI) and the three absolute volume fractions of NODDI (intracellular volume fraction, VFic; extracellular volume fraction, VFec; isotropic volume fraction, VFiso) were calculated, where VFic + VFec + VFiso = 1. The fiber tractography of the corticospinal tract (CST) was performed with DSI-studio (http://dsi-studio.labsolver.org). For ODI threshold calibration, We performed the CST reconstructions from the directions identified by DTI using standard tracking termination criteria (FA ≤ 0.20; turning angle ≤ 60˚) but using different ODI thresholds between 0.2 and 1for the dice similarity overlap comparison. The optimal ODI threshold was chosen as the maximized overlap. Standard FA (FA≥0.20), low FA (FA≥0.10), and optimal ODI threshold were applied to 24 patients to assess the differences between DTI-based and NODDI-based tractography. A radiologist with 20-years of clinical experience manually drew the region of interest (ROI) of edema for each patient after inspecting T1WI, T2WI, T2-FLAIR, DWI, and contrast-enhanced T1WI. In order to understand and compare the alteration of edematous microstructure, the mean of NODDI's volume fractions in edema with fiber tracts were extracted into two groups: the voxels of both NODDI-based and DTI-based fiber tracts existing in the peritumoral edema, DN group; and only NODDI-based fiber tracts existing in edema, N group. The Mann-Whitney U test was used to evaluate the statistical significance of the group differences. P < 0.05 was considered a statistically significant difference. Finally, we used a 2-dimensional barycentric coordinate system to visualize the distribution and characteristics of the NODDI fractions.Results
The mean and maximum of the dice similarity index of 10 healthy participants' CST reconstruction were 0.86 and 0.93, with ODI ≥ 0.45 ± 0.036. The optimal ODI threshold of 0.45 was finally chosen (Figure 2). Three-dimensional visual comparison highlighted that the differences were found predominantly in the regions with vasogenic edema. DTI-based tractography with standard FA shown non-stabilized performance in the region with vasogenic edema with only a few reconstructed tracts; DTI-based with low FA has better performance but is accompanied by many false-positive tracts. NODDI-based tractography has about the same performance with low FA criteria in the region with vasogenic edema and a lack of false-positive fiber tracts (Figure 3). In 2-dimensional barycentric coordinate system, N group’s (mean VFic=0.1633; mean VFec=0.5757; mean VFiso=0.2610) distribution was presented left upper shift while comparing with DN group (mean VFic=0.2228; mean VFec=0.5679; mean VFiso=0.2093). There was no significant difference in VFec (P=0.733), but significantly increased in VFiso (P=0.025) and decreased in VFic (P<0.000) (Figure 4). Two patients' follow-up data were recruited five years after the surgical resection of the brain lesions. The CST was reconstructed by DTI-based tractography with standard termination criteria, and the bilateral CST reappeared after the subsidence of the vasogenic edema (Figure 3).Discussion and conclusion
This study demonstrated that NODDI-based fiber tractography has a great potential to improve the reconstruction of fiber tracking through regions of vasogenic edema and could provide a more accurate microstructure index for clinical quantitative measurements. This technique may help neurosurgeons to define a better safe margin for tumor resection.Acknowledgements
No acknowledgement found.References
- Ye Z, Gary SE, Sun P, et al. The impact of edema and fiber crossing on diffusion MRI metrics assessed in an ex vivo nerve phantom: Multi‐tensor model vs. diffusion orientation distribution function. NMR Biomed. 2020;41:751–16. doi: 10.1002/nbm.4414.
- Zhang H, Wang Y, Lu T, Qiu B, Tang Y, Ou S, Tie X, Sun C, Xu K, Wang Y. Differences Between Generalized Q-Sampling Imaging and Diffusion Tensor Imaging in the Preoperative Visualization of the Nerve Fiber Tracts Within Peritumoral Edema in Brain. Neurosurgery 2013;73:1044–1053. doi: 10.1227/NEU.0000000000000146.
- Wen Q, Kelley DAC, Banerjee S, Lupo JM, Chang SM, Xu D, Hess CP, Nelson SJ. Clinically feasible NODDI characterization of glioma using multiband EPI at 7 T. YNICL 2015;9:291–299. doi: 10.1016/j.nicl.2015.08.017.
- Kadota Y, Hirai T, Azuma M, Hattori Y, Khant ZA, Hori M, Saito K, Yokogami K, Takeshima H. Differentiation between glioblastoma and solitary brain metastasis using neurite orientation dispersion and density imaging. Journal of Neuroradiology 2018:1–6. doi: 10.1016/j.neurad.2018.10.005.
- Masjoodi S, Hashemi H, Oghabian MA, Sharifi G. Differentiation of Edematous, Tumoral and Normal Areas of Brain Using Diffusion Tensor and Neurite Orientation Dispersion and Density Imaging. Journal of Biomedical Physics & Engineering 2018;8:251–10. doi: 10.1080/01621459.1952.10483441.
Figures
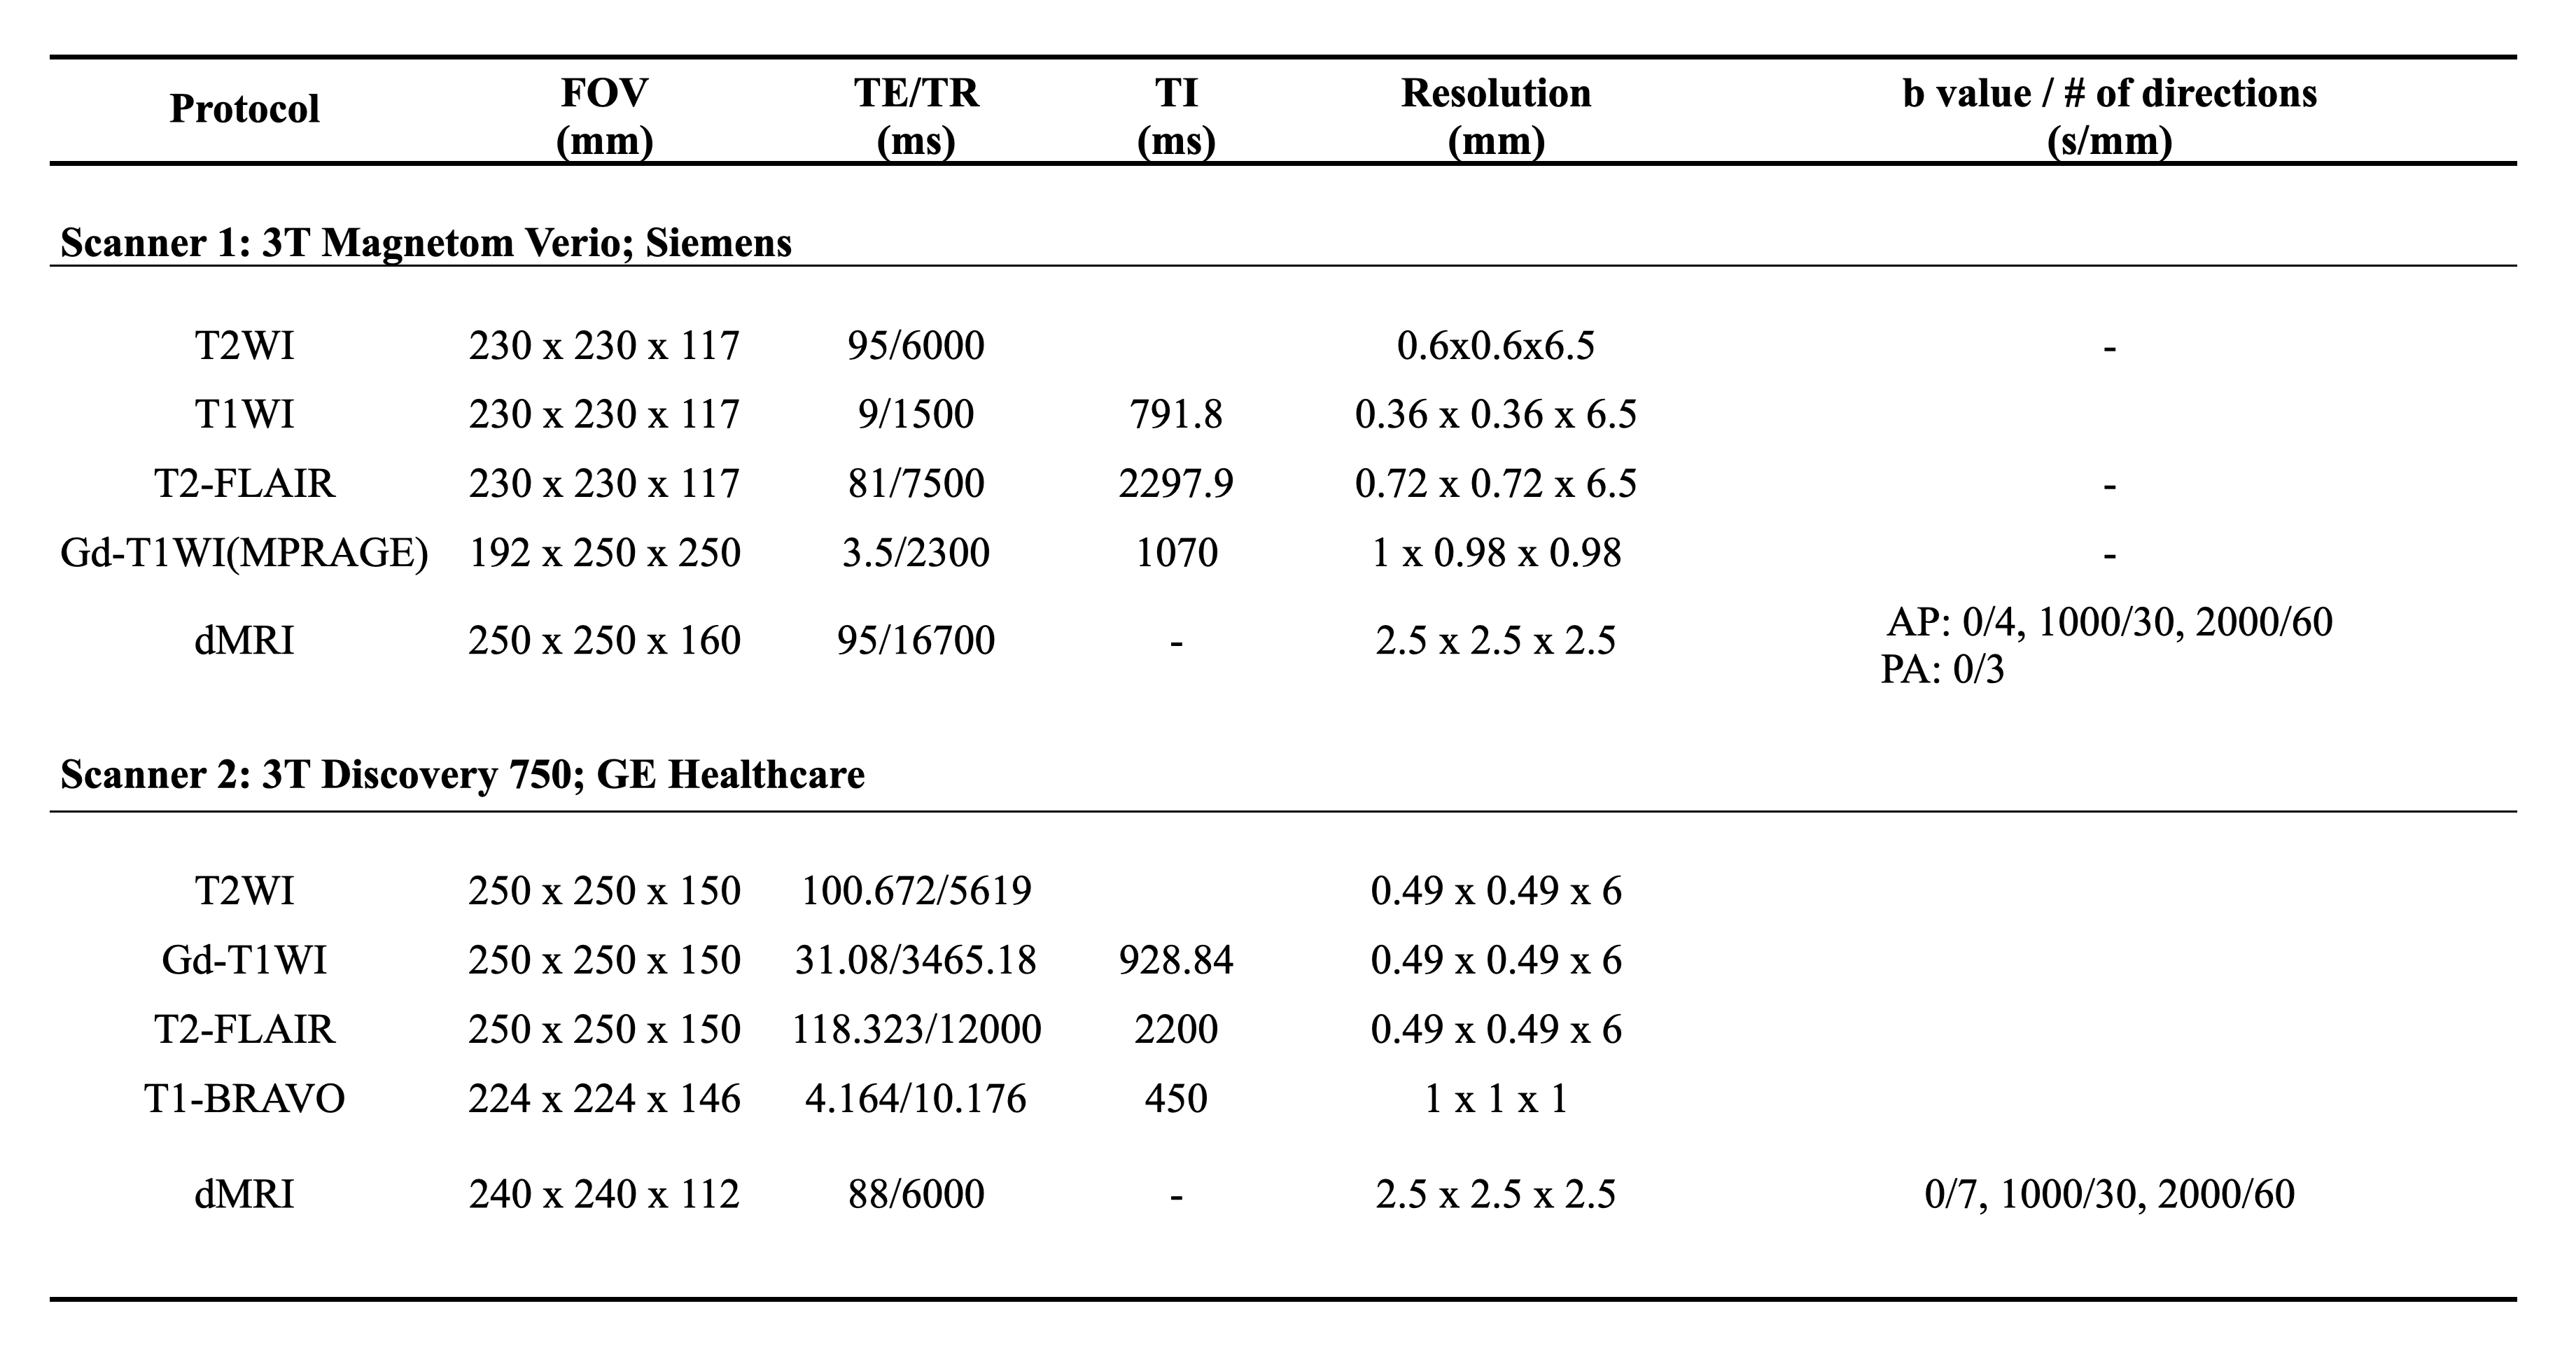
Summary of imaging sequences.
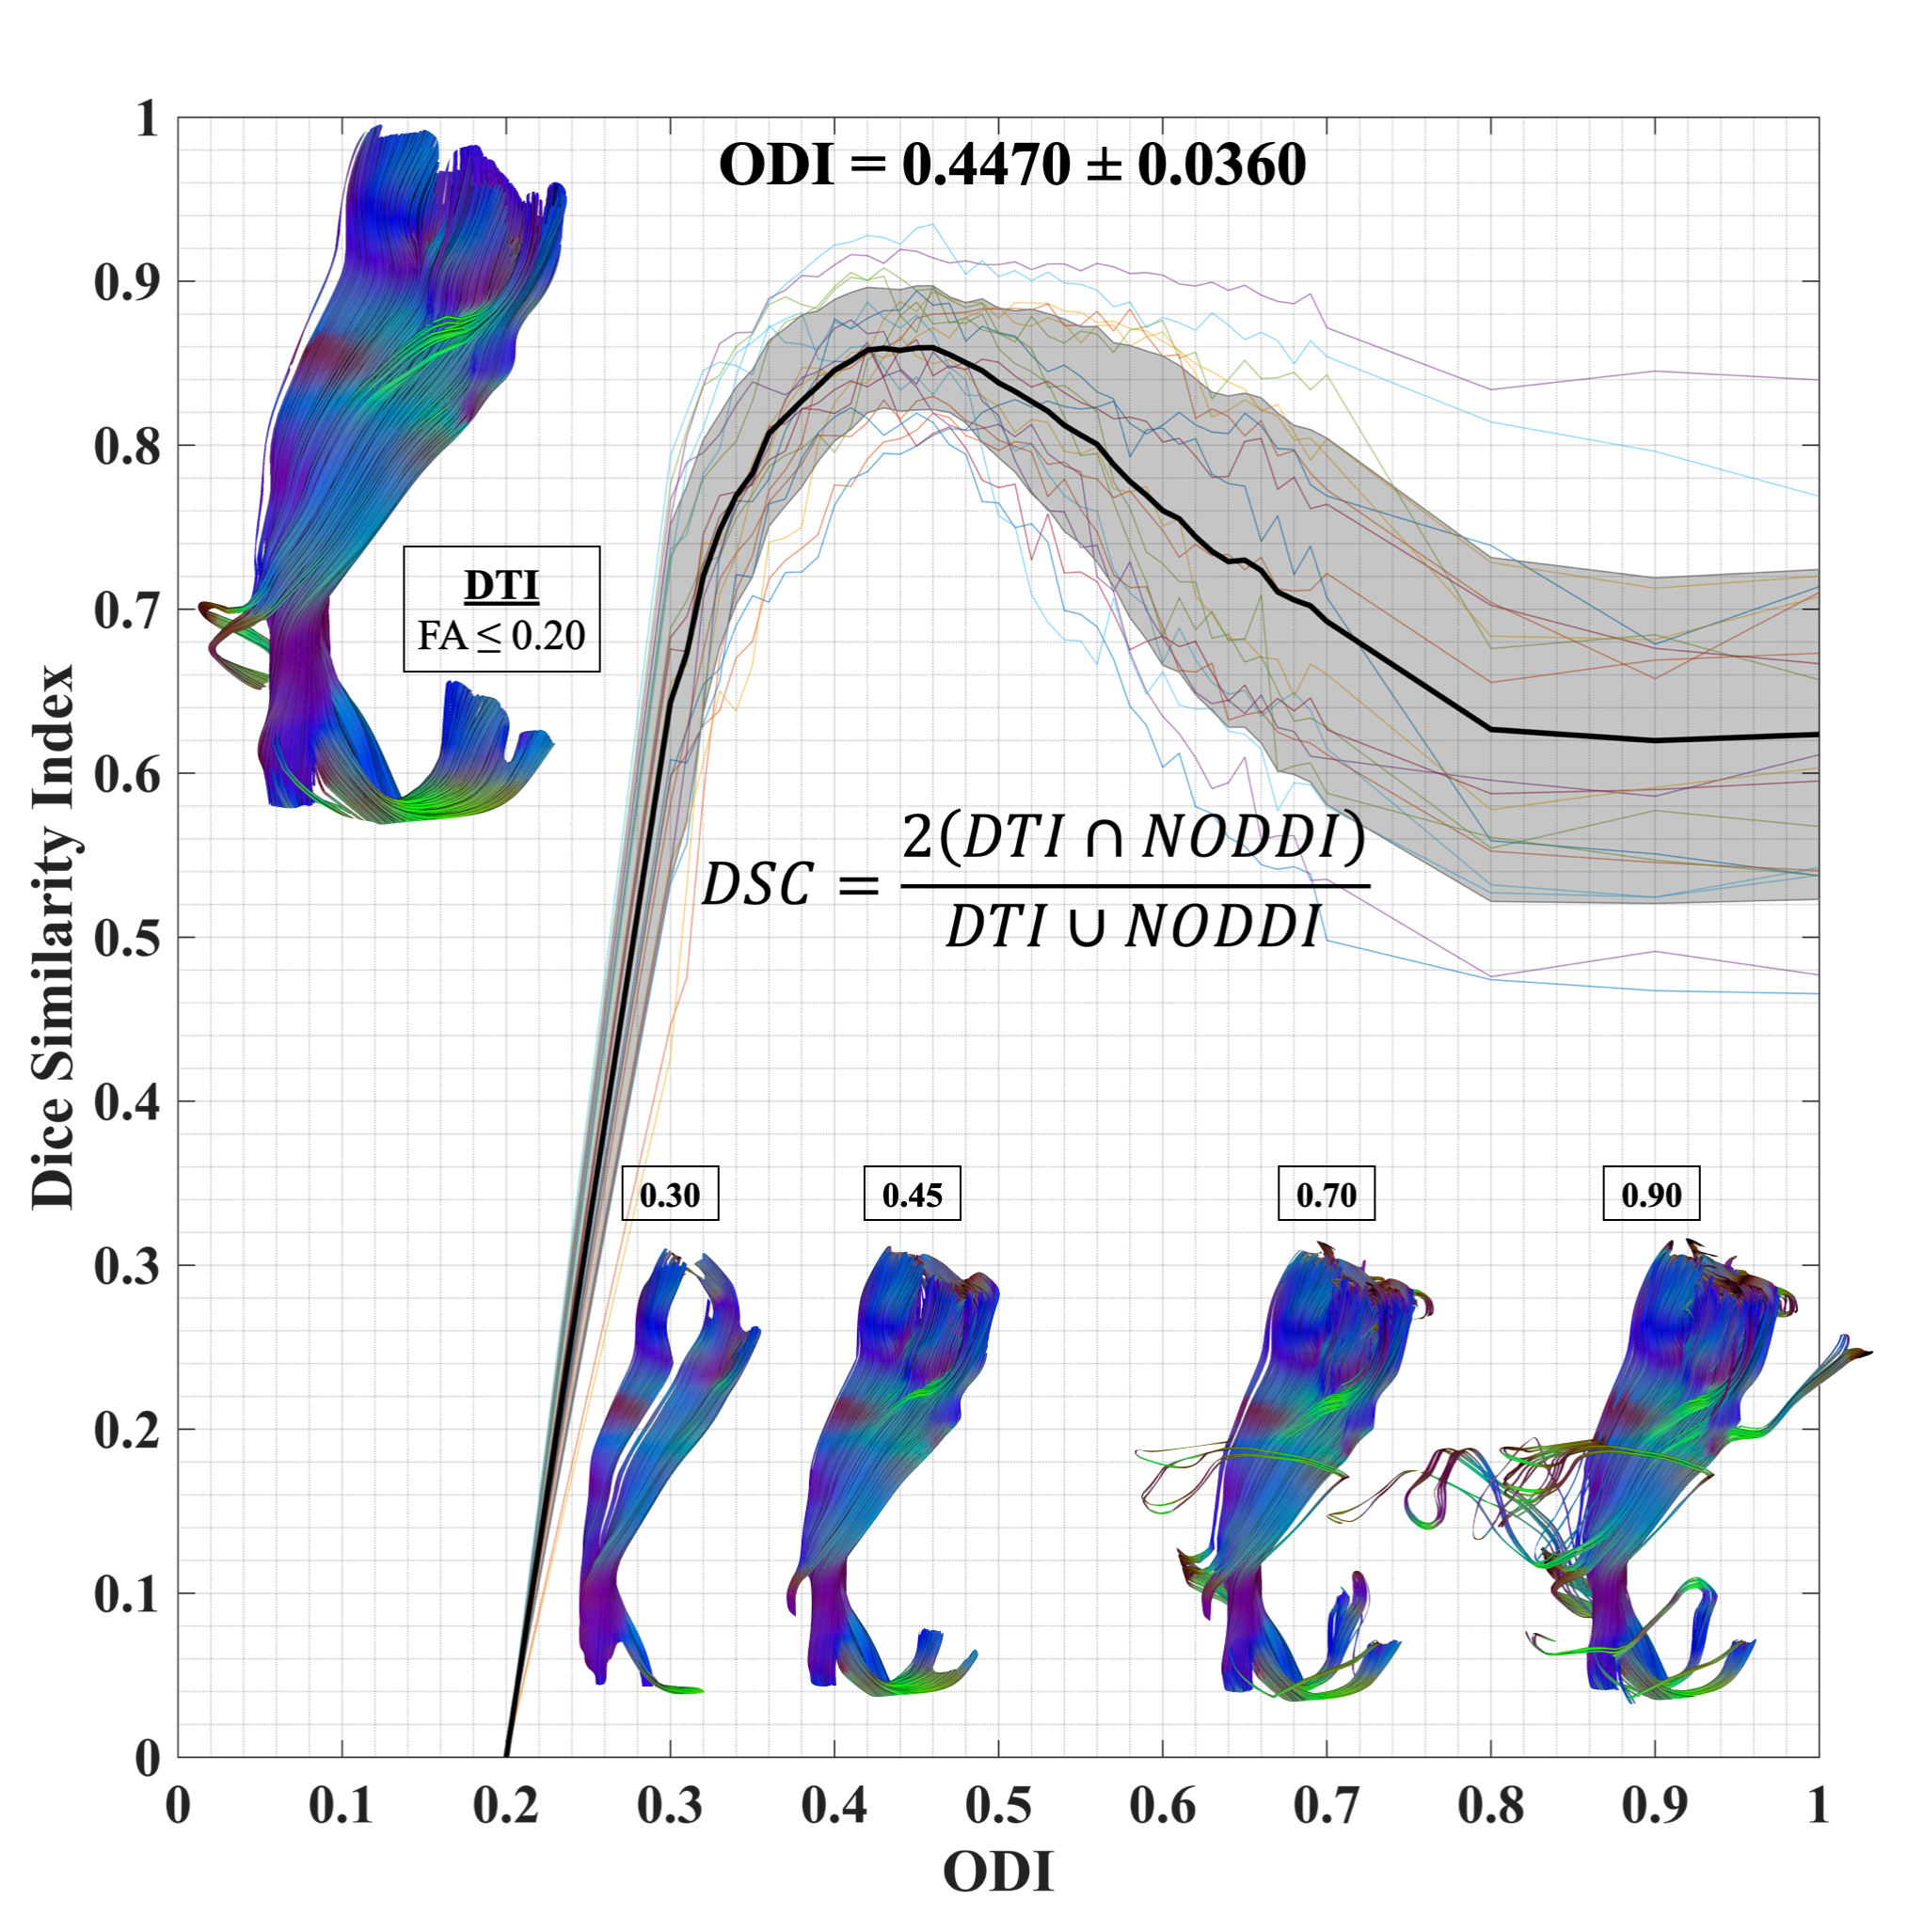
ODI threshold calibration for CST. Dice similarity index at each considered ODI threshold and standard DTI termination criteria (FA ≤ 0.2; turning angle ≤ 60˚). The optimal ODI ≥ 0.45 was set for CST reconstruction.
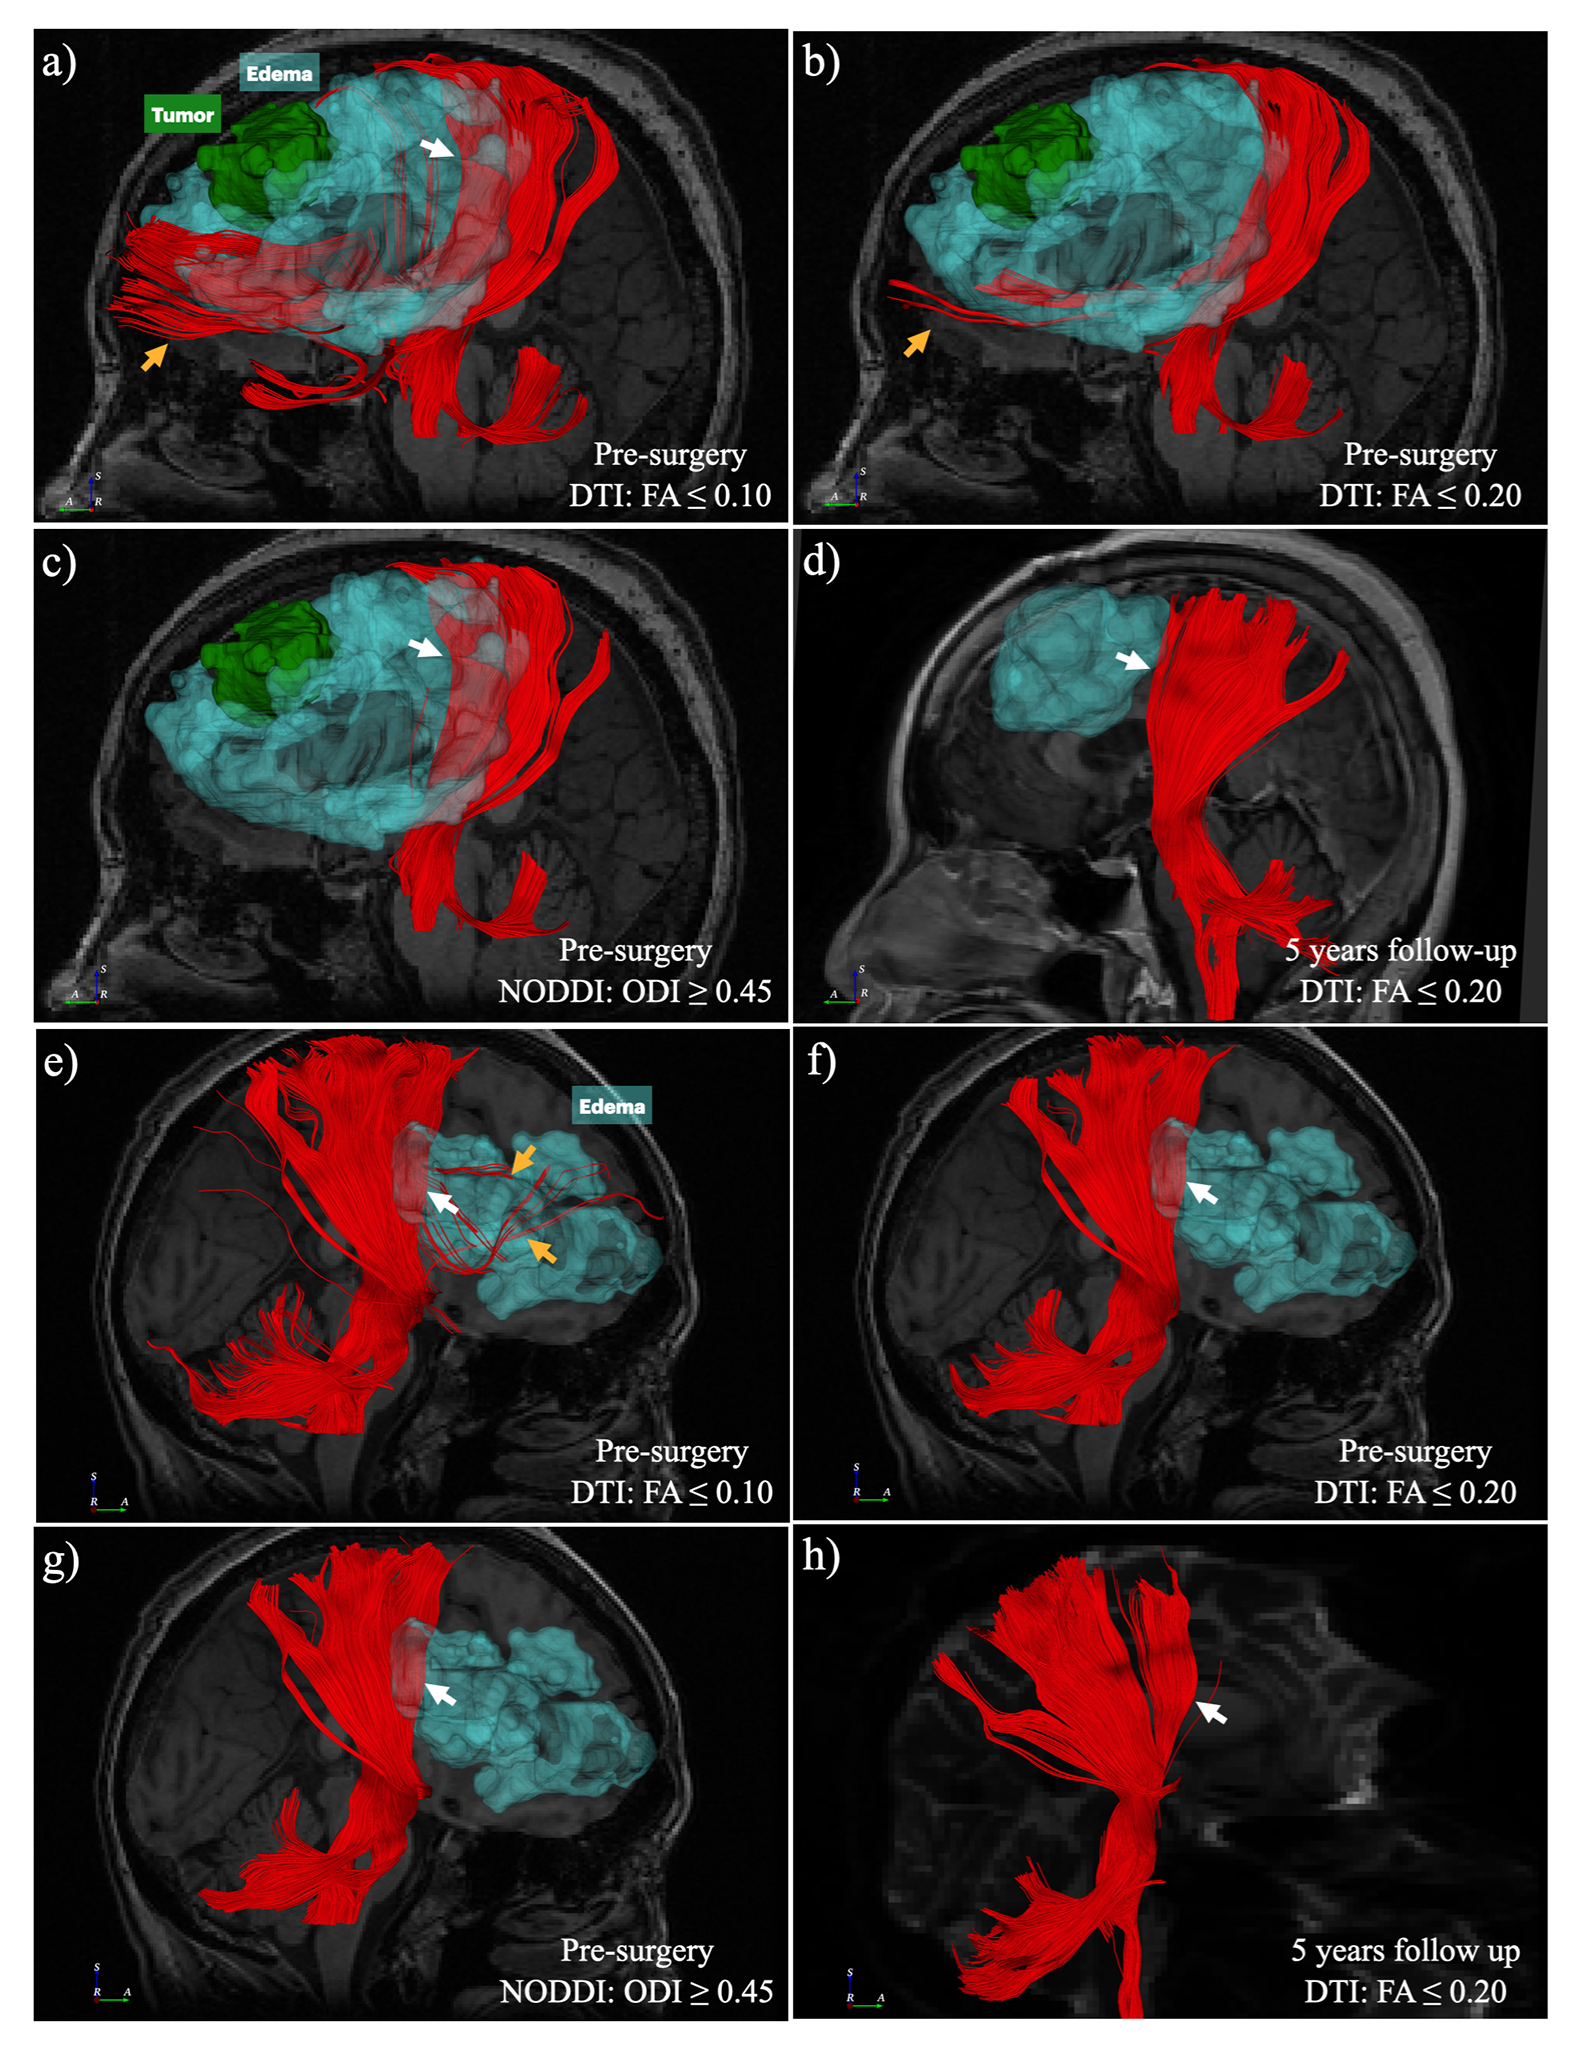
Two examples (a-d, meningioma, WHO grade II; e-h, malignant B-cell lymphoma) of visual comparison between DTI and NODDI-based CST reconstruction. NODDI-based tractography with ODI has better performance in the region of peritumoral edema and fewer false-positive tracts (c & g, white arrow). After the vasogenic edema subsided, the DTI-based tractography with FA ≤ 0.2 shows CST similar to the pre-surgery NODDI-based CST (d & h).
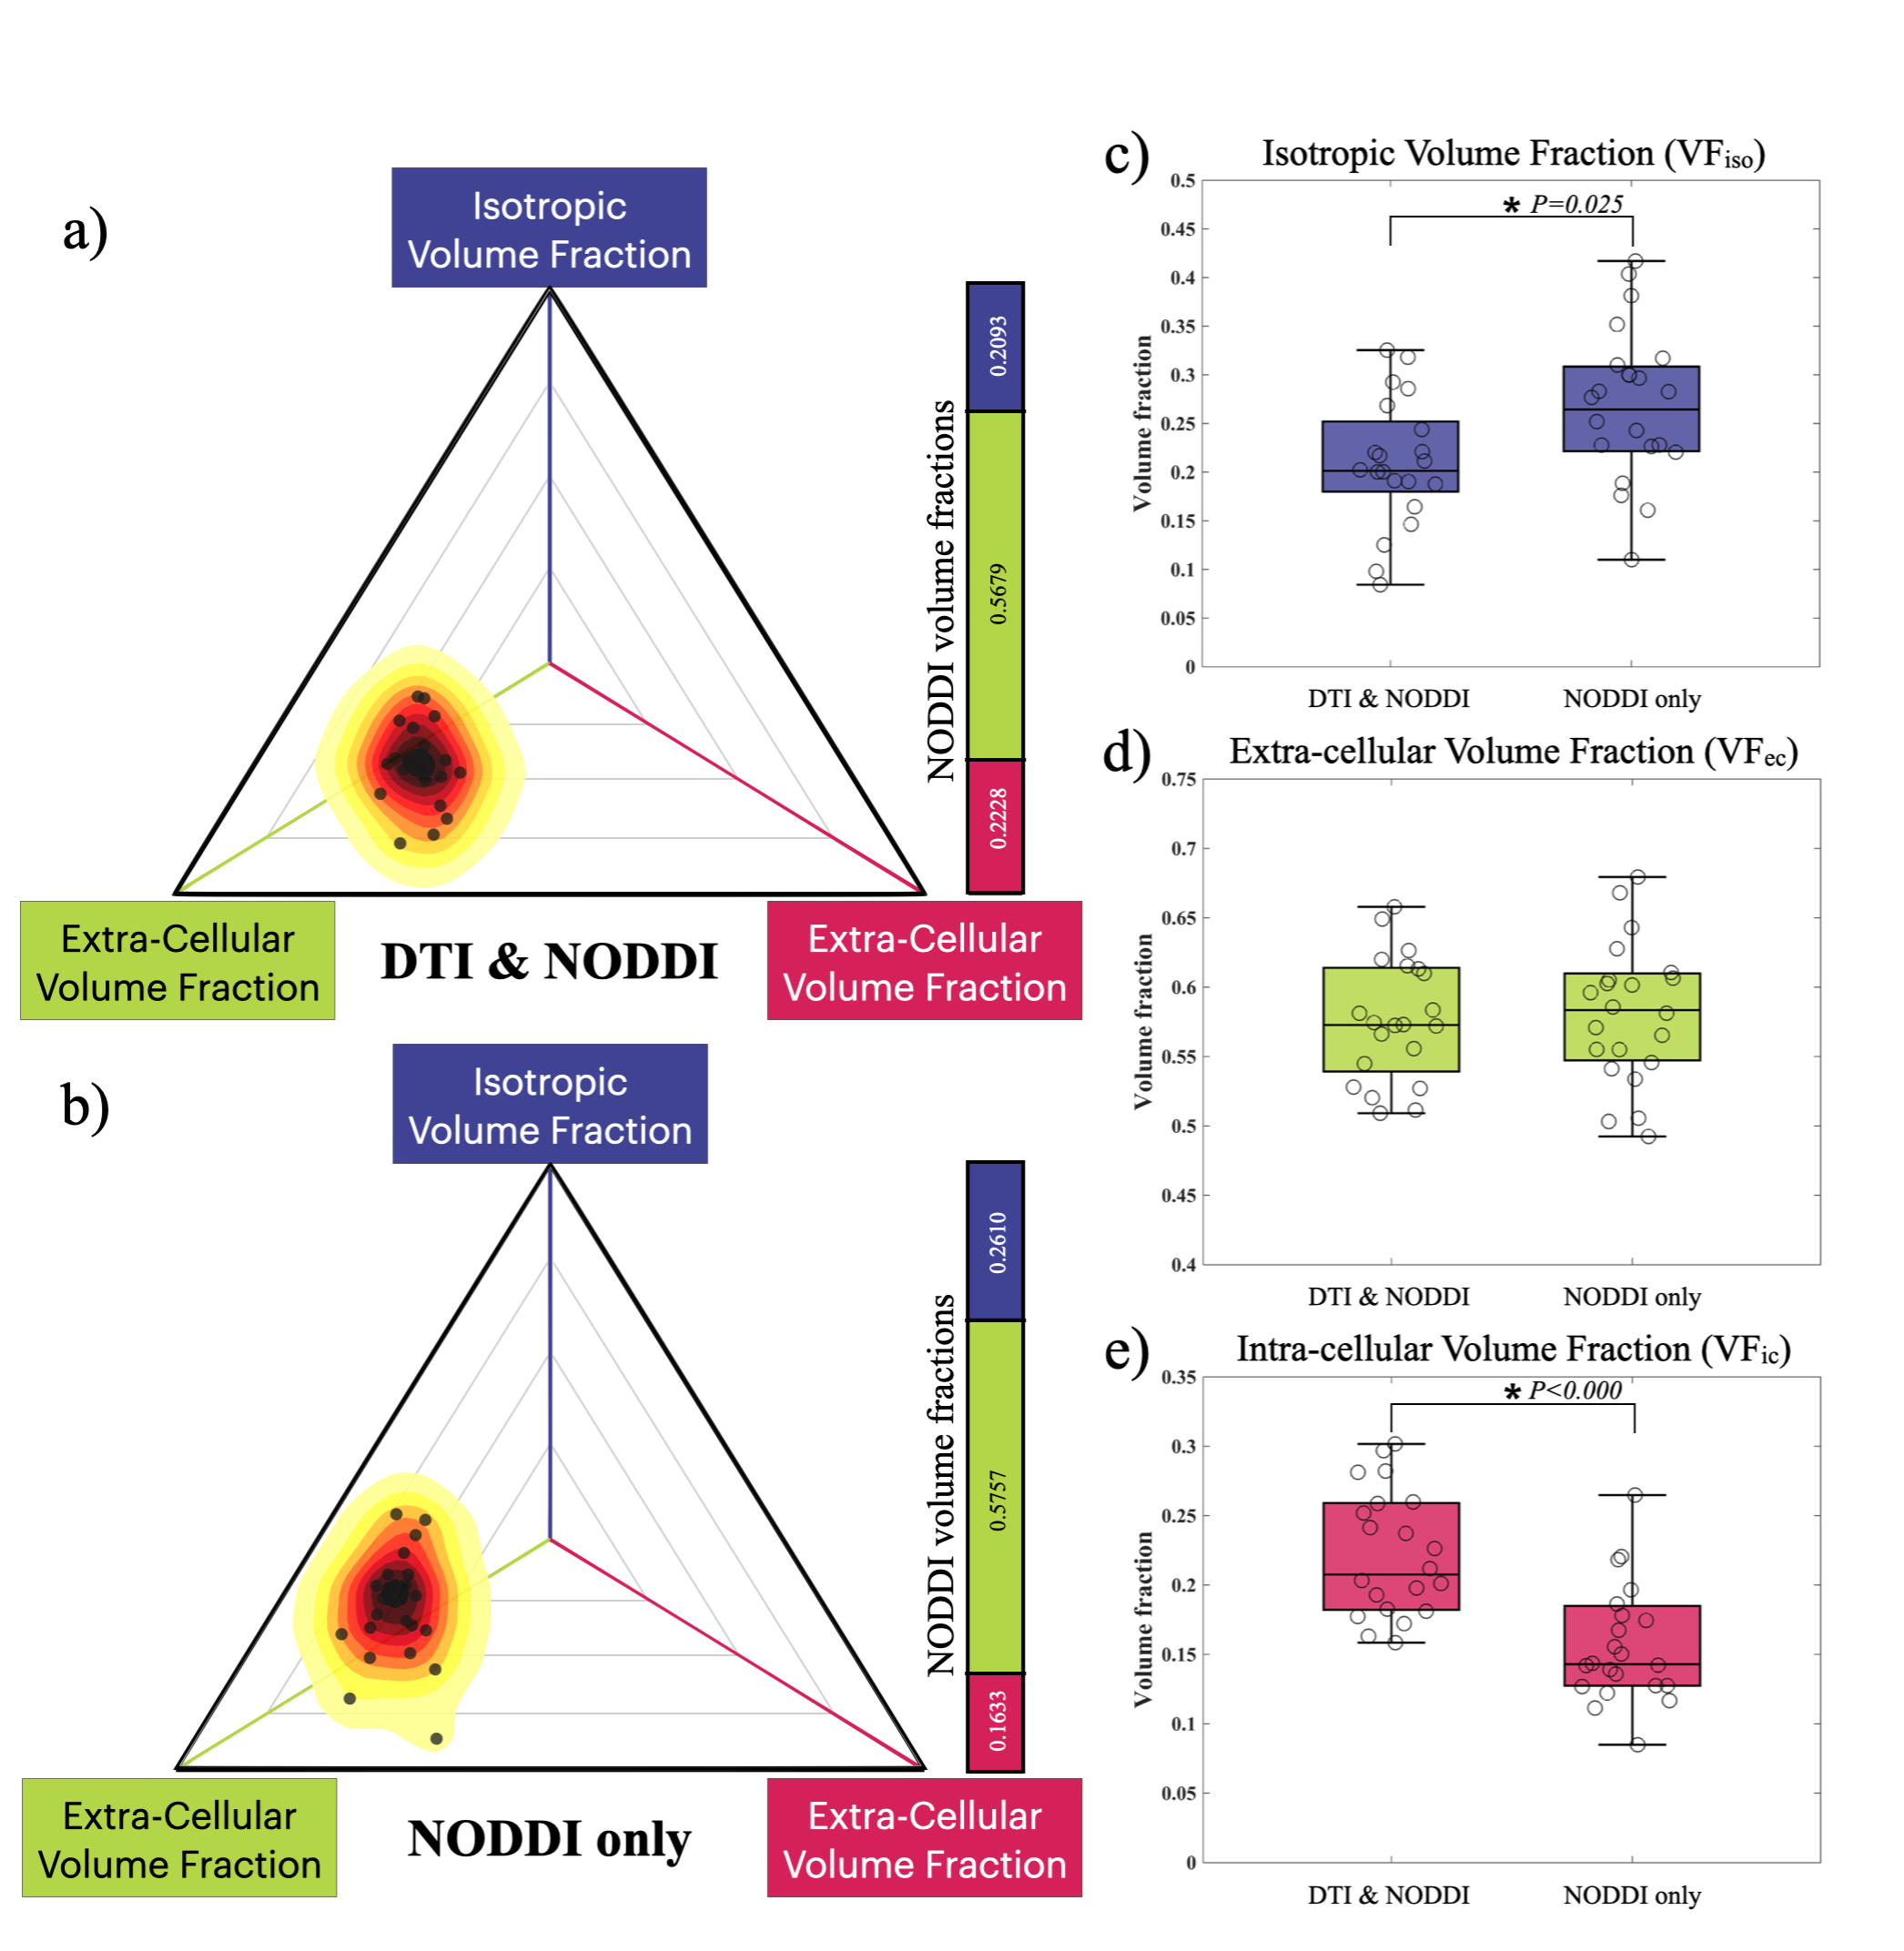
NODDI's volume fraction distributions in the DN group and N group are plotted with a 2D barycentric coordinate system. As compared with the DN group (a), the N group (b) distribution shows a left upper shift in the coordinate system. There is no significant difference in VFec (P = 0.733, d), but significant differences in VFic (P < 0.001, e) and VFiso (P = 0.025, c).