2580
White Matter in Metachromatic Leukodystrophy as Assessed by Myelin Water Fraction and Diffusion Tensor Imaging
Laleh Eskandarian1,2, Safak Parlak3, Onur Afacan4,5, Ceren Günbey6, Nesibe Gevher Ertuğrul6, Banu Anlar6, and Kader Karli Oguz2,3
1Neuroscience Department, Bilkent University, Ankara, Turkey, 2National Magnetic Resonance Research Center (UMRAM), Bilkent University, Ankara, Turkey, 3Faculty of Medicine, Department of Radiology, Hacettepe University, Ankara, Turkey, 4Department of Radiology, Boston Children’s Hospital, Boston, MA, United States, 5Department of Radiology, Harvard Medical School, Boston, MA, United States, 6Department of Pediatrics, Hacettepe University, Ankara, Turkey
1Neuroscience Department, Bilkent University, Ankara, Turkey, 2National Magnetic Resonance Research Center (UMRAM), Bilkent University, Ankara, Turkey, 3Faculty of Medicine, Department of Radiology, Hacettepe University, Ankara, Turkey, 4Department of Radiology, Boston Children’s Hospital, Boston, MA, United States, 5Department of Radiology, Harvard Medical School, Boston, MA, United States, 6Department of Pediatrics, Hacettepe University, Ankara, Turkey
Synopsis
Metachromatic leukodystrophy (MLD) is a dysmyelinating autosomal recessive lysosomal storage disease. Conventional T2WI may not show the disease involvement accurately, especially in early phases of the disease where a bone marrow transplant can be a treatment option. Therefore we used Myelin Water Fraction (MWF) and Diffusion Tensor Imaging to investigate WM in patients with MLD. MWF and metrics derived from DTI, especially fractional anisotropy (FA), showed diffuse abnormality in WM and were significantly correlated. These imaging techniques can better assess involvement of the cerebral WM in patients with MLD.
Introduction
Metachromatic leukodystrophy (MLD) is a dysmyelinating autosomal recessive disease characterized by accumulation of sulfatide in the white matter (WM) due to the deficiency of the arylsulfatase A enzyme1 2 Conventional MRI is usually used in diagnosis and follow-up of these patients despite clinical indiscrepancies with hyperintensity on T2 weighted imaging (WI). Because the patients with milder or no involvement of the brain on T2WI can be a candidate for a bone marrow transplant (BMT), advanced imaging techniques which better reflect myelin abnormality have the potential to improve clinical care.We aimed to analyse WM in MLD patients using a multiecho T2 mapping analysis technique, Myelin Water fraction (MWF)4, which enables the quantitative evaluation of myelin based on T2 relaxometry data and DTI. We also searched for correlations betwen MWF and DTI metrics in both groups.
Methods
The study protocol was approved by IRB and all participants’ parents gave informed consent.Subjects
Eight patients with MLD (M/F:2/6) and 8 healthy control(HC)s (M/F;1/7) (Mean age (range): 7.8 (4-17) and 9.5 (5-15) respectively) participated in the study. The groups were similar in gender and age (p >.05).
Image Acquisition
All participants underwent MR imaging on a 1.5 T scanner (Magnetom Area, Siemens, Germany) with a 20 channel head coil.
The imaging protocol included whole-brain 3D sagittal T1 MPRAGE (TR/TE: 1900/2.7, ST: 1 mm, NEX: 1, FA: 150), axial T2WI (TR/TE: 3240/99, ST: 5 mm, NEX: 2, FA: 150), axial T2 multiecho CPMG (TR/TE: 2280/9.0, ST: 4 mm, NEX: 1, 32 echoes with 9ms echo spacing, 4 concatenations), and EPI-DTI with 64 independent direction data set (TR/TE: 4300/89, ST:1.8 mm, NEX: 1).
Data Processing and Analysis
MWF maps were calculated by fitting a three-compartment model to the T2 decay curve of each voxel, where each compartment is represented by an inverse Gaussian distribution5. MWF was calculated as the ratio of the integral of the first compartment to the total integral of the T2 spectrum. The amount of myelin in different regions of the brain was collected by drawing symmetrical 22 ROIs (6*6 mm^2) on the brainstem; from middle cerebellar peduncle(MCP)s, corticospinal tracts, transverse pontine fibers, medial lemniscus, and on both hemispheres from temporal WM, posterior limb of internal capsules, posterior and frontal periventricular areas, anterior and posterior parts of corona radiata and genu and splenium of corpus callosum (CC) on MWF maps. All the processing was done on MATLAB with in-house developed software.
FA (fractional anisotropy), MD (mean diffusivity), AD (axial diffusivity), RD (radial diffusivity) values were also collected by drawing the same 22 ROIs by using DSI_Studio6 software.
To investigate whole-brain voxel-based WM diffusion alterations, tract-based spatial statistics (TBSS)7 included in the FSL v.6.0 package was used. After preprocessing, diffusion tensor fitting (FSL DTIFit8), and calculation of FA, MD, AD, RD maps, FA maps were registered and aligned to the average space as input for TBSS, and the mean FA skeleton was computed. A permutation-based inference with 500 permutations was performed. Threshold-free cluster enhancement output was obtained and corrected for multiple comparisons. Family-wise error (FWE)-corrected maps were obtained with p <.05. Cluster-based thresholding was performed, which included Gaussian smoothing, application of a threshold (t: 1.5), and forming clusters from 26 neighboring suprathreshold voxels. Due to group analysis for MD, AD, RD images, original non-linear registration was applied to them. To enhance skeletonized MD, AD, RD images, skeletonized mean FA was projected on these images. According to p <.05, FEW-corrected maps achieved.
Statistical analysis for group differences and correlation of imaging data with clinical parameters was performed using R programming using RStudio9 The t-test analyses were applied to our data for significance at p <.05. Pearson product-moment correlation coefficient test was used to test whether a correlation was present between myelin maps and DTI metrics.
Results
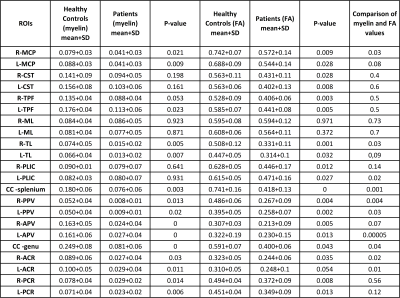
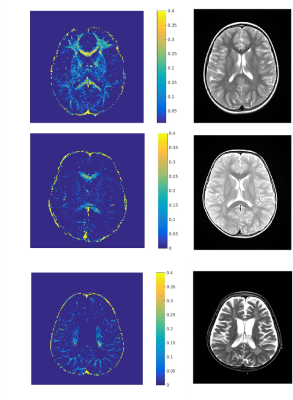
Structural ChangesThe patients showed lower myelin values than HCs in all regions except right medial lemniscus and the differences were statistically significant bilaterally in temporal WM, periventricular areas, corona radiata, CC, bilateral MCPs, and in the left part of transverse pontine fibers (p < .05) (Table 1 and Figure 1).
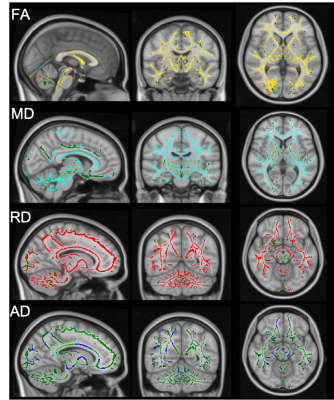
TBSS-DTI maps showed a diffuse reduction in FA, widespread elevation in RD and less extensive elevation in MD, and limited reduction in AD (Figure 3). As compared with HCs, patients showed significantly lower AD in all regions without statistical significance in any region (p >.05) but a single ROI in CC splenium showing higher (p=.008) AD. Significantly higher RD values in 15 regions (all, p <.05), higher MD values in 6 regions (all, p < .02). Most extensive significant alterations were shown in FA with lower values in all regions of patients than HCs except medial lemniscus and anterior part of corona radiata (p < .05).
Among DTI parameters, the most extensive correlations of myelin were with FA, in 10/22 ROIs (p < .05). Also, there was a correlation between myelin and AD in the internal capsule, MD in genu of corpus callosum, and RD in corpus callosum (p < .05).
Conclusion
Compared to HCs, MLD patients showed a widespread reduction in myelin and FA of white matter. MWF and DTI can provide better surrogate markers of the disease activity.Acknowledgements
No acknowledgement found.References
- Kim TS, Kim IO, Kim WS, et al. MR of childhood metachromatic leukodystrophy. Am J Neuroradiol. Published online 1997.
- Eichler F, Grodd W, Grant E, et al. Metachromatic leukodystrophy: A scoring system for brain MR imaging observations. Am J Neuroradiol. Published online 2009. doi:10.3174/ajnr.A1739
- Van Rappard DF, Königs M, Steenweg ME, et al. Diffusion tensor imaging in metachromatic leukodystrophy. J Neurol. Published online 2018. doi:10.1007/s00415-018-8765-3
- Mackay A, Whittall K, Adler J, Li D, Paty D, Graeb D. In vivo visualization of myelin water in brain by magnetic resonance. Magn Reson Med. Published online 1994. doi:10.1002/mrm.1910310614
- Akhondi-Asl A, Afacan O, Balasubramanian M, Mulkern R V., Warfield SK. Fast myelin water fraction estimation using 2D multislice CPMG. Magn Reson Med. Published online 2016. doi:10.1002/mrm.26034
- Yeh FC, Verstynen TD, Wang Y, Fernández-Miranda JC, Tseng WYI. Deterministic diffusion fiber tracking improved by quantitative anisotropy. PLoS One. Published online 2013 doi:10.1371/journal.pone.0080713
- Smith SM, Jenkinson M, Johansen-Berg H, et al. Tract-based spatial statistics: Voxelwise analysis of multi-subject diffusion data. Neuroimage. Published online 2006. doi:10.1016/j.neuroimage.2006.02.024
- Behrens TEJ, Woolrich MW, Jenkinson M, et al. Characterization and Propagation of Uncertainty in Diffusion-Weighted MR Imaging. Magn Reson Med. Published online 2003. doi:10.1002/mrm.10609
- Rstudio T. RStudio: Integrated Development for R. Rstudio Team, PBC, Boston, MA URL http//www.rstudio.com/. Published online 2020. doi:10.1145/3132847.3132886
Figures

Table 1. MCP: middle cerebellar peduncle; CST: Corticospinal tracts; TPF: Transverse pontine fibers; ML: Medial lemniscus; TL: Temporal lobe; PLIC: Posterior limb of internal capsule; CC: Corpus callosum; PPV: Posterior periventricular; APV: Anterior periventricular; ACR: Anterior corona radiata; PCR: Posterior corona radiata

Figure 1. Axial T2WI and
T2 MWF maps
of a
7-year old female HC (A)
and
two
patients with MLD, 4 and 9-years old at
(B, C respectively)
with
varying
severity
of leukodystrophy.
Both
patients
have
reduced
MWF compared
with
HC in A. Although
slight
hyperintensity
is noticed
on T2WI; the
patients
have
markedly
low
myelin
on MWF.

Figure 2. Shows TBSS maps
derived
from
DTI studies
from
the
patients
and
HCs.
Compared
with
HCs,
FA map
shows
widespread
significant
reduction
(A), MD and
RD maps
show
increase
(B and
C ) and
AD map
shows
a limited
reduction
in WM of the
patients.