2575
Inhomogeneous Magnetization Transfer (ihMT) MRI and Coherent Anti-stoke Raman Scattering (CARS) microscopy applied on LPC demyelinating model1Aix Marseille Univ, CNRS, CRMBM, Marseille, France, 2APHM, Hôpital Universitaire Timone, CEMEREM, Marseille, France, 3Aix Marseille Univ, CNRS, INT, Marseille, France, 4Aix Marseille Univ, CNRS, CERIMED, Marseille, France, 5Aix Marseille Univ, CNRS, ICR, Marseille, France, 6Division of MR Research, Radiology, Beth Israel Deaconess Medical Center, Harvard Medical School, Boston, MA, United States
Synopsis
Intoxication of oligodendrocytes with lysophosphatidylcholine (LPC) is a useful model for the study of focal demyelination and more recently, neuronal damage. We propose an ihMT-CARS analysis on a rodent model of LPC-induced demyelination and a quantitative (T1, T2 and T1D, the dipolar relaxation time) characterization of the demyelinated area.
Introduction
Inhomogeneous magnetization transfer (ihMT), weighted by the dipolar relaxation time T1D1, is sensitive to myelination2 and to pathological induced alterations3 of myelinated structures. Its high specificity to myelin2 is attributed to the mechanisms underlying the proton dipole-dipole interactions along the lipid chain4.Coherent Anti-stoke Raman scattering (CARS) microscopy is a dye-free optical imaging method, that can be tuned to the vibrational modes of CH2 and CH3 bonds of myelin lipids, usually used to characterize demyelinating and neurodegenerative models5.
In this work we propose a combined ihMT–CARS analysis on a model of oligodendrocyte intoxication with lysophosphatidylcholine (LPC) performed in the spinal cord (SC) of mice.
Methods
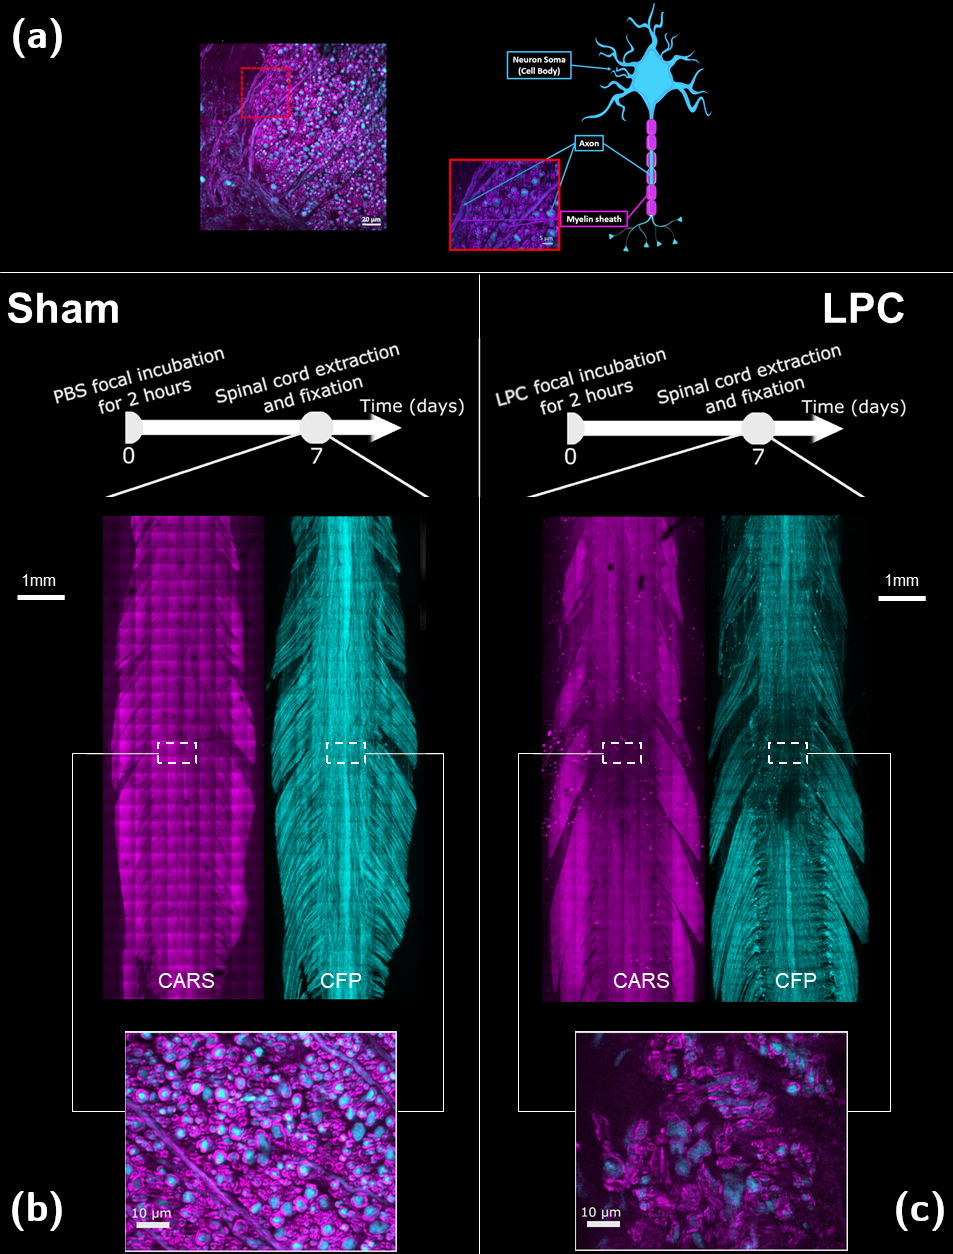
LPC mouse model: LPC triggers the selective death of spinal oligodendrocytes, and results in a peak of demyelination 7 days after exposure. Adult Thy1–CFP fluorescent reporter mice were submitted either to focal LPC incubation (LPC, n = 3), or to phosphate-buffered saline (PBS) incubation (Sham, n = 3) for 2 hours following dura matter opening. Incubation was performed in the dorsal tracts of cervical SC. Seven days post incubation spinal cords were extracted and fixed with 4% paraformaldehyde for 12h prior to imaging.Microscopy Methods: CARS microscopy was done for myelin imaging using OPO femtosecond laser source (80 MHz 150 fs; Coherent, Santa Clara, CA, United States) with excitation wavelengths λp = 806 nm and λs = 1050 nm. Nonlinear excitation of CFP fluorescence was also optimal at λp = 806 nm and allowed axonal density imaging. Figure 1a shows a representative combined image of myelin and axons obtained by the superposition of the 2 contrasts. Average intensity of CARS was determined in rectangle regions of interest (680x333 µm2) along the rostral and caudal axis. Axon density was determined from the average number of axons intersecting the lateral edges of each ROI (100 µm depth). Axon and CARS data were normalized to a reference value, 3000 microns away from the lesion.
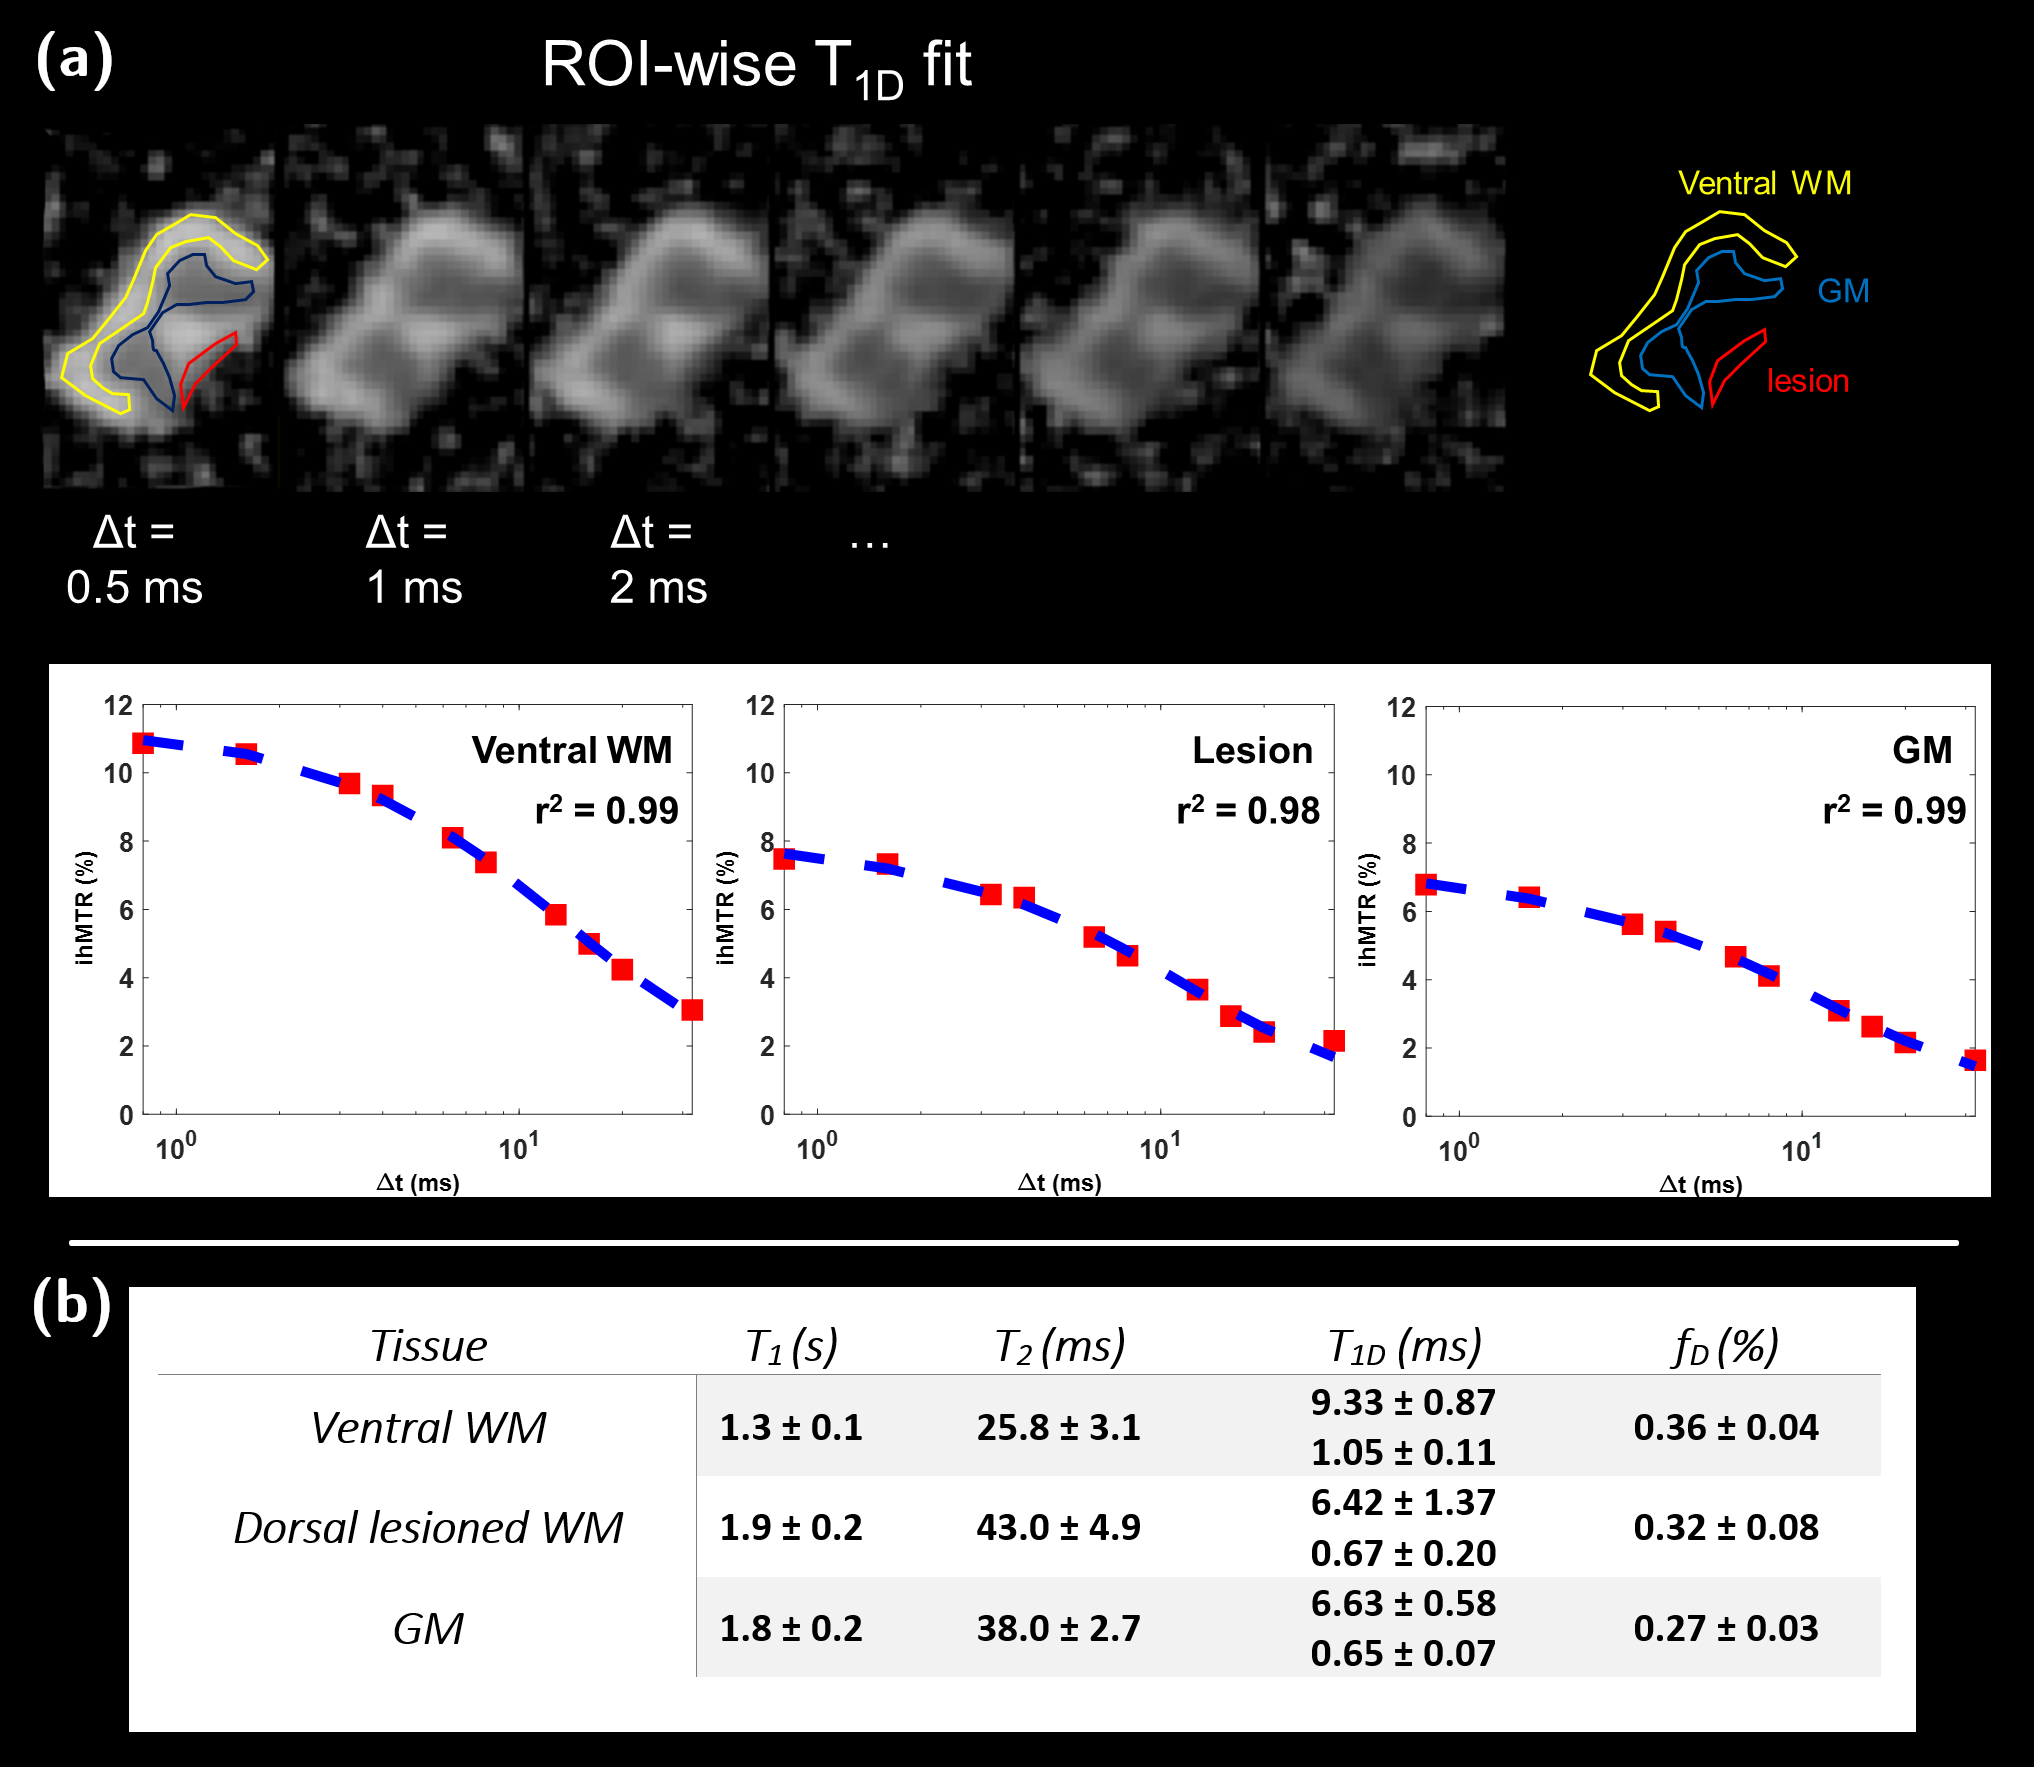
MRI Protocol: Experiments were performed on a preclinical 7T scanner (PharmaScan, Bruker). A 3D ihMT-RAGE sequence (ihMT preparation: Hann shaped pulses of pw = 0.5 ms duration; inter-pulse delay Δt = 0. 8 ms; frequency-offset Δf = 10 kHz; number of pulses per burst Np = 8; burst repetition time BTR = 60 ms; MT pulse duty cycle DC = 6.7%; total saturation time τ = 900 ms and saturation power calculated over BTR, B1RMS = 6.7 µT; axial readout direction, 73x73x333 µm3 resolution) was used to acquire images centred on the LPC lesion. Quantification was performed in ROIs selected in the SC dorsal tracts. T1D measurements were performed in a single axial slice (666 µm slice thickness) centred in the lesion using a modified ihMT-RARE sequence (B1rms = 8 µT; 10 Δt values in the [0.8; 40] ms range) and a bi-T1D compartment model6. In addition, T1 and T2 imaging were performed using Variable Flip Angle (VFA; B1 corrected) and multi spin-echo sequences.
Results
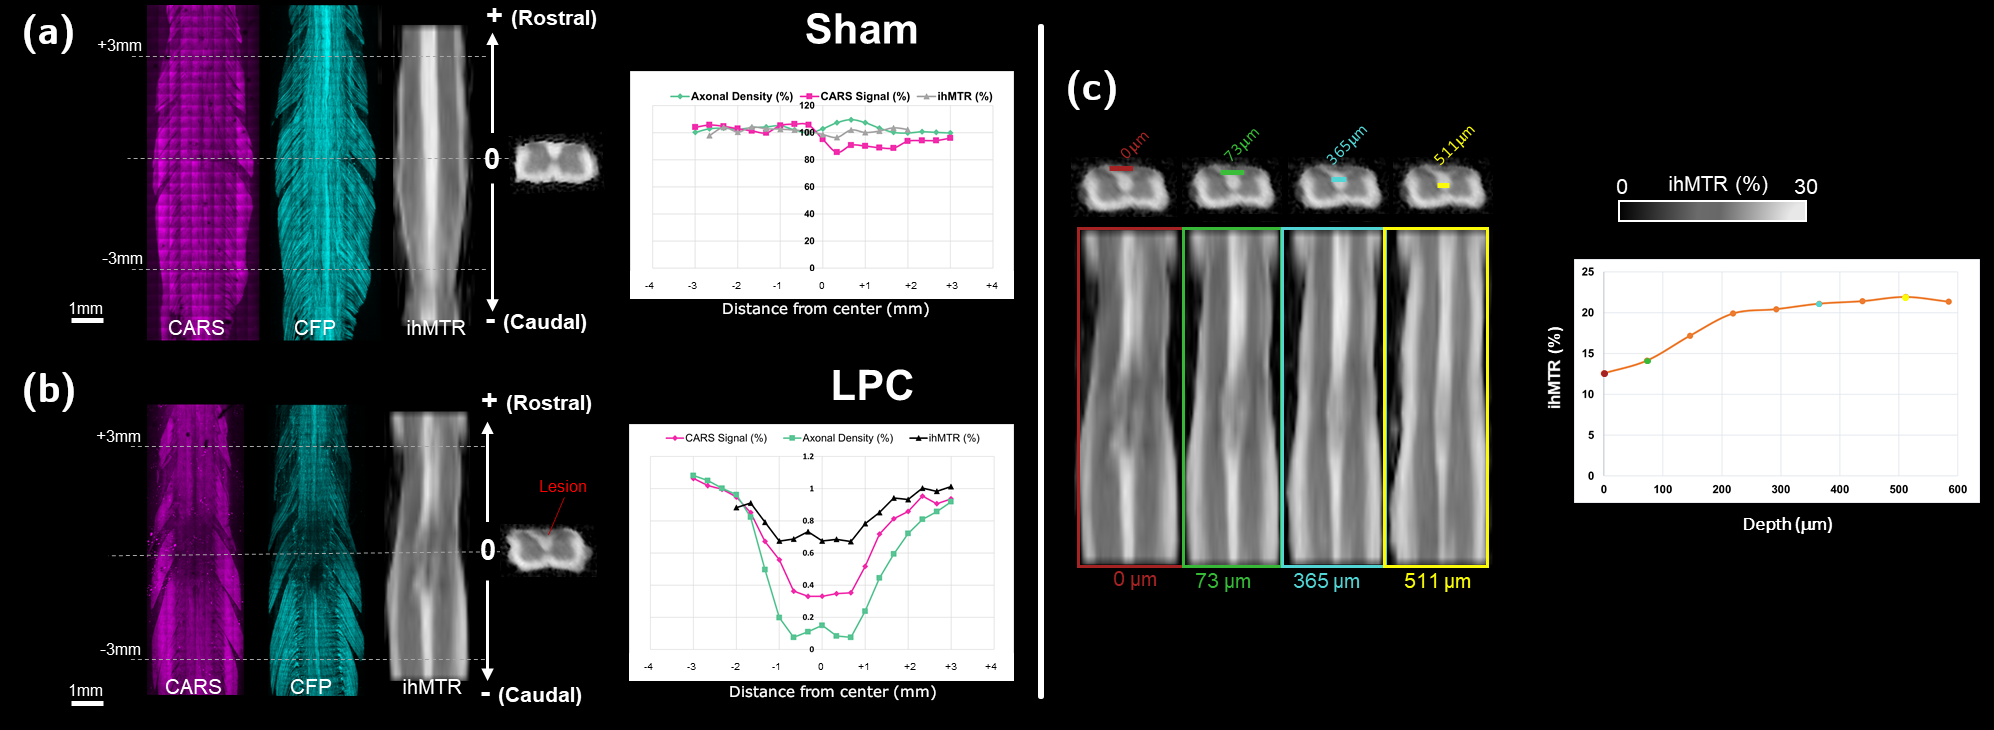
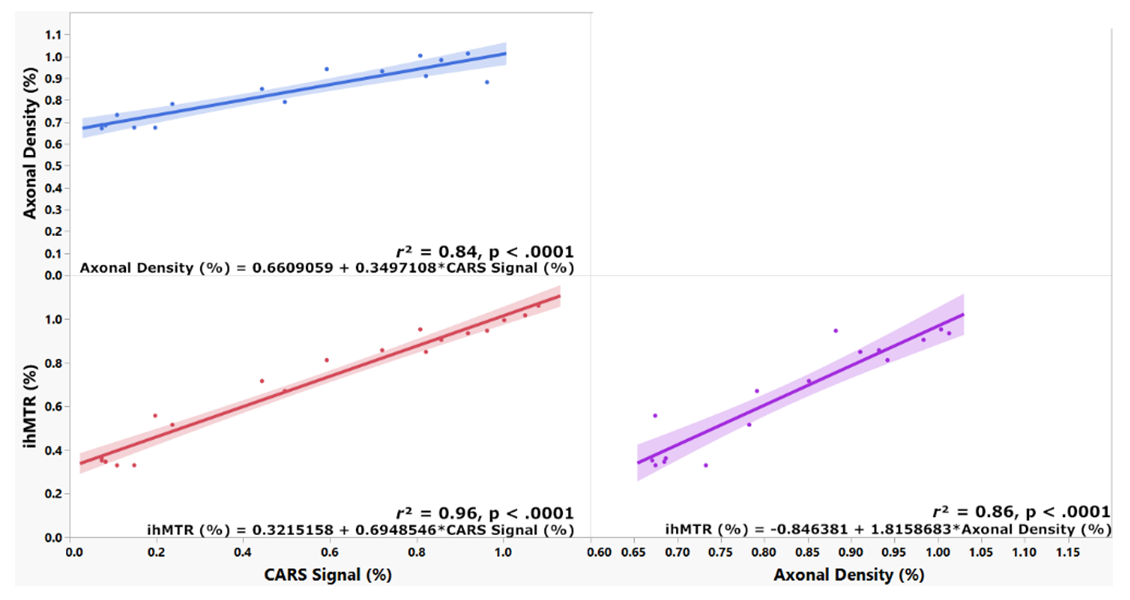
Figures 1b-c show CARS (magenta) and CFP (cyan) coronal images of a sham and an LPC spinal cords. Insets highlight sections in dorsal tracts where normal dense myelinated axons are visible for sham, whereas, for LPC, demyelination, axonal loss, myelin debris and cell infiltration are noticeable. Corresponding ihMTR images (greyscale) presented in Figure 2, show the extent of the demyelinated lesion in both the coronal and axial directions. The rostro-caudal profiles of ihMTR, CARS and CFP signals indicate a signal loss of 34%, 67% and 85 % respectively in the centre of the lesion (Figure 2b), while the PBS-incubated spinal cord presents variations smaller than 5% around the centre of the spinal cord for all metrics (Figure 2a).Figure 2c, shows coronal ihMTR images at different depths of the dorsal tracts indicating that the lesion propagates deeper than 365 μm. Figure 3 shows correlations between ihMTR, CARS and CFP data normalized. Highest correlation was obtained between CARS and axonal density (r2 = 0.96, p < 0.0001). Correlations between ihMTR and axonal density and CARS showed similar strengths (r2 = 0.84, p < 0.0001 and r2 = 0.86, p < 0.0001 respectively). The quantification of T1Ds, T1 and T2 in the lesion (Figure 4) showed different values than those obtained in the ventral WM taken as reference. Specifically, an increase in both T1 and T2, along with a decrease in the fraction of long T1Ds in the lesion and a shortening of both long and short T1D components was observed.
Discussion
The rostro-caudal ihMTR profile in the LPC-incubated spinal cord follows the dynamics of demyelination and axonal loss measured by microscopy. Interestingly, the correlation between CARS and ihMTR signals revealed a positive intercept, suggesting that the ihMTR signal does not originate only from myelin, but also from other non-myelin components.Noteworthy, we observed an increase of T1 and T2 and a shortening of long/short T1D values in line with the damages (cell infiltration, demyelination) observed in the lesion (Figure 1c). CARS data are precious assets to further interpret the signal variations measured with ihMT using advanced biophysical models and quantitative analysis.
Conclusion
IhMT MRI combined with CARS imaging provide a comprehensive characterization of the cellular processes involved in demyelination induced by the LPC model.Acknowledgements
This work was performed by a laboratory member of France Life Imaging network (grant ANR‐17‐ CE18‐0030, VERISMO project), supported by Carnot Star Institute (CARNOT STAR 2020) and the French Association pour la Recherche sur la Sclérose En Plaques (ARSEP 2020).References
1. Varma, G. et al. Interpretation of magnetization transfer from inhomogeneously broadened lines (ihMT) in tissues as a dipolar order effect within motion restricted molecules. J. Magn. Reson. 260, 67–76 (2015).
2. Duhamel, G. et al. Validating the sensitivity of inhomogeneous magnetization transfer (ihMT) MRI to myelin with fluorescence microscopy. NeuroImage 199, 289–303 (2019).
3. Hertanu A, Soustelle L, Le Troter A, et al. Multi-T1D weighting ihMT imaging in the Cuprizone mouse model. In : Proceedings 28th Scientific Meeting, International Society for Magnetic Resonance in Medicine. ; 2020. p. 175.
4. Dufourc, E. J., Mayer, C., Stohrer, J., Althoff, G. & Kothe, G. Dynamics of phosphate head groups in biomembranes. Comprehensive analysis using phosphorus-31 nuclear magnetic resonance lineshape and relaxation time measurements. Biophys. J. 61, 42–57 (1992).
5. El Waly, B., Buttigieg, E., Karakus, C., Brustlein, S. & Debarbieux, F. Longitudinal Intravital Microscopy Reveals Axon Degeneration Concomitant With Inflammatory Cell Infiltration in an LPC Model of Demyelination. Front. Cell. Neurosci. 14, (2020).
6. Carvalho, V. N. D. et al. MRI assessment of multiple dipolar relaxation time ( T 1 D ) components in biological tissues interpreted with a generalized inhomogeneous magnetization transfer (ihMT) model. J. Magn. Reson. 311, 106668 (2020).
Figures