2573
Automatic Segmentation of Brain Lesions in the Cuprizone Mouse Model of Multiple Sclerosis
Yuki Asada1, Luke Xie2, Skander Jemaa3, Kai H. Barck2, Tracy Yuen4, Richard A.D. Carano3, and Gregory Z. Ferl1
1Pharmacokinetics & Pharmacodynamics, Genentech, Inc., South San Francisco, CA, United States, 2Biomedical Imaging, Genentech, Inc., South San Francisco, CA, United States, 3PHC Data Science Imaging, Genentech, Inc., South San Francisco, CA, United States, 4Neuroscience, Genentech, Inc., South San Francisco, CA, United States
1Pharmacokinetics & Pharmacodynamics, Genentech, Inc., South San Francisco, CA, United States, 2Biomedical Imaging, Genentech, Inc., South San Francisco, CA, United States, 3PHC Data Science Imaging, Genentech, Inc., South San Francisco, CA, United States, 4Neuroscience, Genentech, Inc., South San Francisco, CA, United States
Synopsis
Here, we trained and evaluated a fully convolutional neural network for 3D images to automatically segment brain lesions in MRI images of a cuprizone mouse model of multiple sclerosis. To improve performance, several pre-processing and data augmentation methods were tested and compared. The impact of lesion size on network performance was evaluated and we applied the trained segmentation model to images from non-lesion control mice to assess the capacity of the network to detect the presence or absence of lesions. We conclude that the trained network can 1) detect the presence of a lesion and 2) accurately segment the volume.
Introduction
Multiple sclerosis (MS) is an inflammatory demyelinating disease of the central nervous system, characterized in part by MRI-detectable T2 lesions in the brain and spinal cord [1]. Automated lesion detection and segmentation methods for clinical MRI images have been developed to decrease both variability/error associated with manual segmentation and image processing time [2-3]. Brain segmentation in mouse models of multiple sclerosis can similarly benefit from automated methods. Previously, atlas, clustering and deep learning approaches have been developed for general mouse brain segmentation tasks [4-5]; in this study, we investigate a deep learning approach for detection and segmentation of MS-like brain lesions in the cuprizone mouse model, where mice develop demyelinated lesions primarily in the corpus callosum, and other regions of the brain. A fully convolutional neural network (CNN) for 3D images [6] was developed to automatically detect and segment brain lesions occurring in the corpus callosum. To improve performance of the trained CNN, several data pre-processing and augmentation techniques were evaluated. To assess the utility of the network as a lesion detection algorithm, we tested the trained CNN on non-lesion-bearing control mice.Methods
A total of 80 T2-weighted images (TR=4s, TE1/spacing/TE8=10/10/80ms (8 echoes), matrix=256×256×56, and resolution=75×75×300 µm3) of approximately 25 cuprizone-fed mice with regions of interest (ROI) manually drawn on lesions were used as a training set for the CNN model. An additional 21 non-lesion control mice/scans were used to evaluate performance of the trained U-Net in the absence of lesions. All animals were given chow with 0.2% cuprizone for 4 weeks and then regular chow for an additional 8 weeks, resulting in a range of lesion sizes in the training set since mice were imaged at various times during the post-cuprizone period during which lesions slowly resolve and remyelinate. Figure 1A shows transverse slices approximately through the center of the lesion for 3 representative mouse scans, along with manually-drawn regions of interest. Briefly, we used a 3D U-Net CNN [6], which consists of 4 downsampling blocks and 4 upsampling blocks. The dice similarity coefficient (DSC) is used as a loss function, where the CNN was trained using 6-fold cross validation. The trained model with the highest DSC against the hold-out data set was considered to be the final model.The following four types of image preprocessing were applied.
- Normalize: Each image is normalized between 0 and 1, where maximum voxel intensity is scaled to 1 and minimum to 0)
- Standardization: Mean and standard deviation (sd) across all voxels is computed for each image, where each voxel is transformed by dividing the difference between the voxel intensity and mean by the sd.
- Background removal: Across all standardized images, an empirical cutoff of zero was identified, where all voxels values below this threshold were set to 0, thus removing a qualitatively significant amount background/low intensity signal outside of the brain.
- Cropping: Each image is cropped to 128x128x56 voxels.
- Horizontal flipping: 50% of images are flipped horizontally.
- Rotation: Each image is rotated along the x-, y- and z-axis at random angles between -2 degrees and 2 degrees.
Results
Step-wise evaluation of image preprocessing and augmentation steps on CNN performance is shown in Figure 2. The impact of the standardization and background removal on image histograms is shown in Figure 3. Image standardization yielded the largest improvement in the DSC, with an increase from 0.54 to 0.75 compared to the model trained on data with no preprocessing. Cropping and background removal further increased the DSC values on the test set, although some degree of model overfitting is apparent in these cases. Data augmentation appeared to resolve the issue of overfitting and further improved the DCE on the validation and test data sets. Hand-drawn segmentation compared to CNN-based segmentation (using the model summarized in Figure 2, row 8) in 3 representative mice is shown in Figure 1B-D, where qualitatively good agreement is seen. The scatter plot shown in Figure 4A plots predicted vs. ground truth lesion volumes for the lesion-bearing mice and the non-lesion control mice, where there is a strong positive correlation between the CNN-predicted and ground truth lesions volumes (linear regression yields a slope of 0.95 and an R2 of 0.9). The volume of the predicted ROIs in non-lesion control mice is close to zero (< 0.04 μL). The distribution of training, cross-validation and test DSCs vs. ground truth lesion volume is plotted in Figure 4B, where qualitatively the DCE decreases slightly with ground truth lesion volume.Discussion and Conclusion
In this study, the trained 3D CNN was able to segment corpus callosum brain lesions in T2 weighted scans of the cuprizone mouse model (DSC,test=0.78 vs. hand-drawn ground truth). Data preprocessing and augmentation was required to improve model performance. In addition to segmenting brain lesions, the trained CNN is highly sensitive to the presence of a lesion and has utility as a lesion detection tool that can be used to quickly and accurately process longitudinal scans in individual mice and determine the time at which a lesion has (apparently) resolved.Acknowledgements
No acknowledgement found.References
- Polman, Chris H., Stephen C. Reingold, Brenda Banwell, Michel Clanet, Jeffrey A. Cohen, Massimo Filippi, Kazuo Fujihara et al. "Diagnostic criteria for multiple sclerosis: 2010 revisions to the McDonald criteria." Annals of neurology 69, no. 2 (2011): 292-302.
- Gabr, Refaat E., Ivan Coronado, Melvin Robinson, Sheeba J. Sujit, Sushmita Datta, Xiaojun Sun, William J. Allen, Fred D. Lublin, Jerry S. Wolinsky, and Ponnada A. Narayana. "Brain and lesion segmentation in multiple sclerosis using fully convolutional neural networks: A large-scale study." Multiple Sclerosis Journal 26, no. 10 (2020): 1217-1226.
- Danelakis, Antonios, Theoharis Theoharis, and Dimitrios A. Verganelakis. "Survey of automated multiple sclerosis lesion segmentation techniques on magnetic resonance imaging." Computerized Medical Imaging and Graphics 70 (2018): 83-100.
- Feo, Riccardo, and Federico Giove. "Towards an efficient segmentation of small rodents brain: a short critical review." Journal of neuroscience methods 323 (2019): 82-89.
- De Feo, Riccardo, Artem Shantillo, Alejandra Sierra, Juan Miguel Valverde, Olli Grohn, Federico Giove, and Jussi Tohka. "Automated skull-stripping and segmentation with Multi-Task U-Net in large mouse brain MRI databases." bioRxiv (2020).
- Ronneberger, Olaf, Philipp Fischer, and Thomas Brox. "U-net: Convolutional networks for biomedical image segmentation." In International Conference on Medical image computing and computer-assisted intervention, pp. 234-241. Springer, Cham, 2015.
- Cubuk, Ekin D., Barret Zoph, Dandelion Mane, Vijay Vasudevan, and Quoc V. Le. "Autoaugment: Learning augmentation policies from data." arXiv preprint arXiv:1805.09501 (2018).
Figures
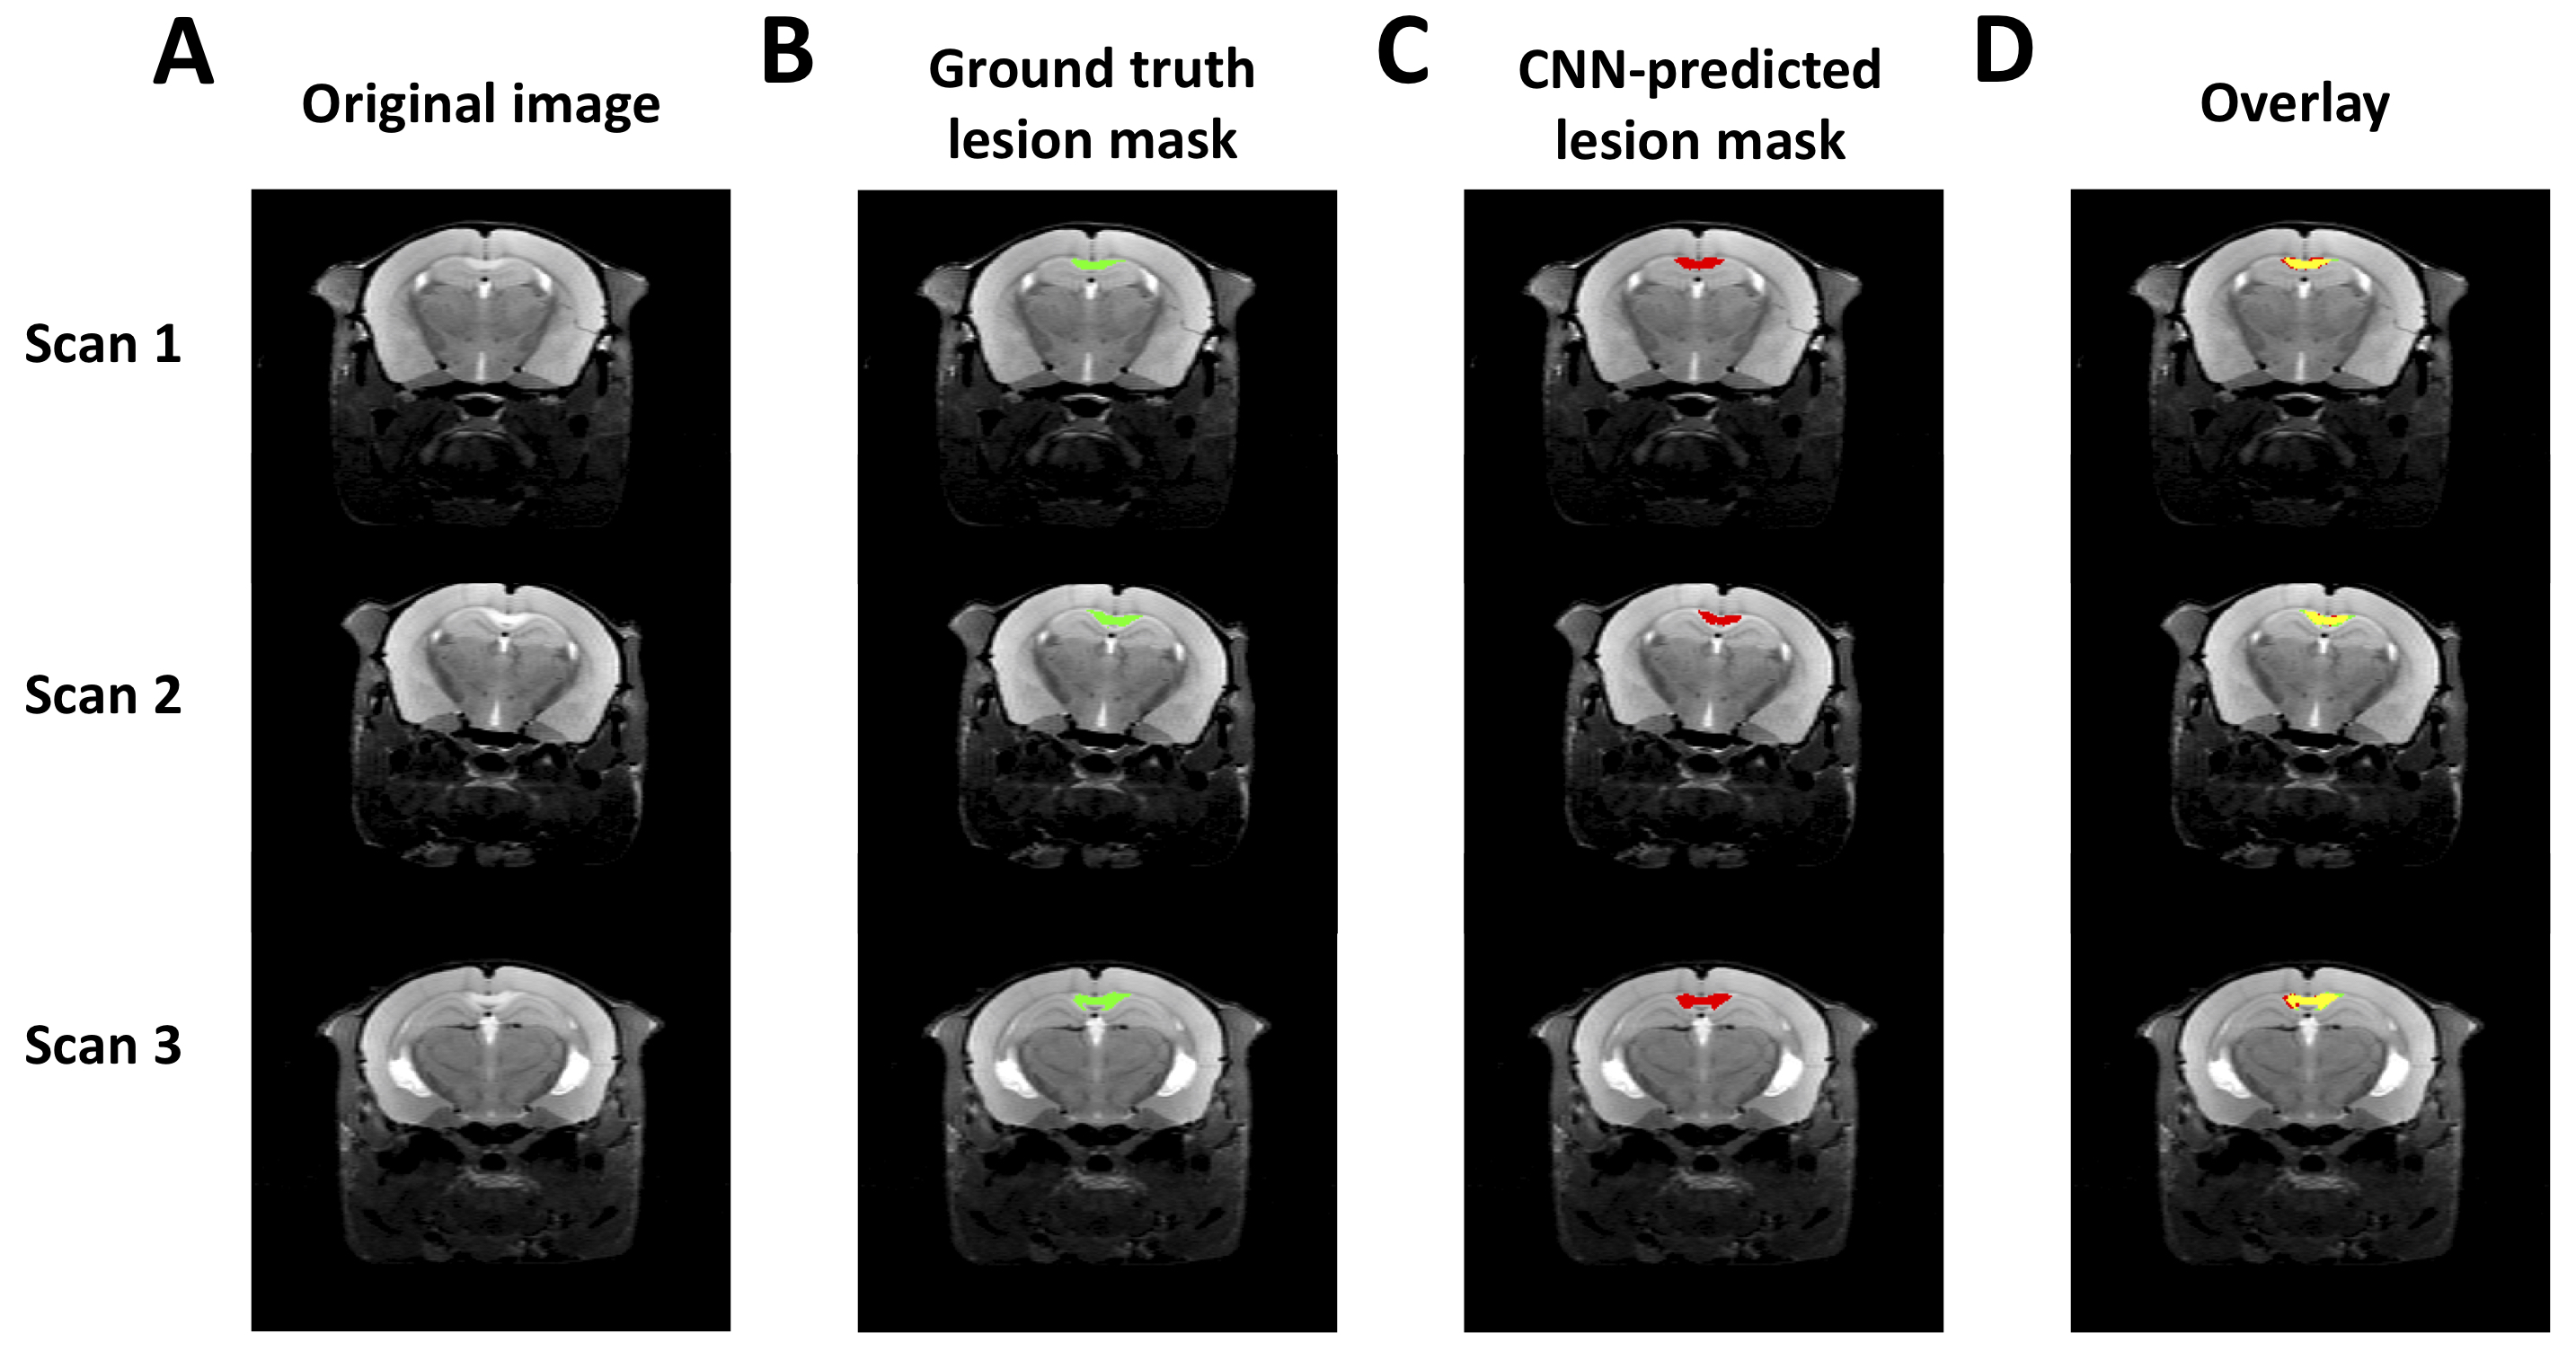
Figure 1. Three representative hold-out test scans. A) The transverse slice approximately through center of the lesion is shown representative scans, along with B) Ground truth and C) CNN-predicted ROIs, using the trained model indicated in Table 1, row 8. D) An overlay of the 2 ROIs is shown, with overlapping area indicated in yellow.
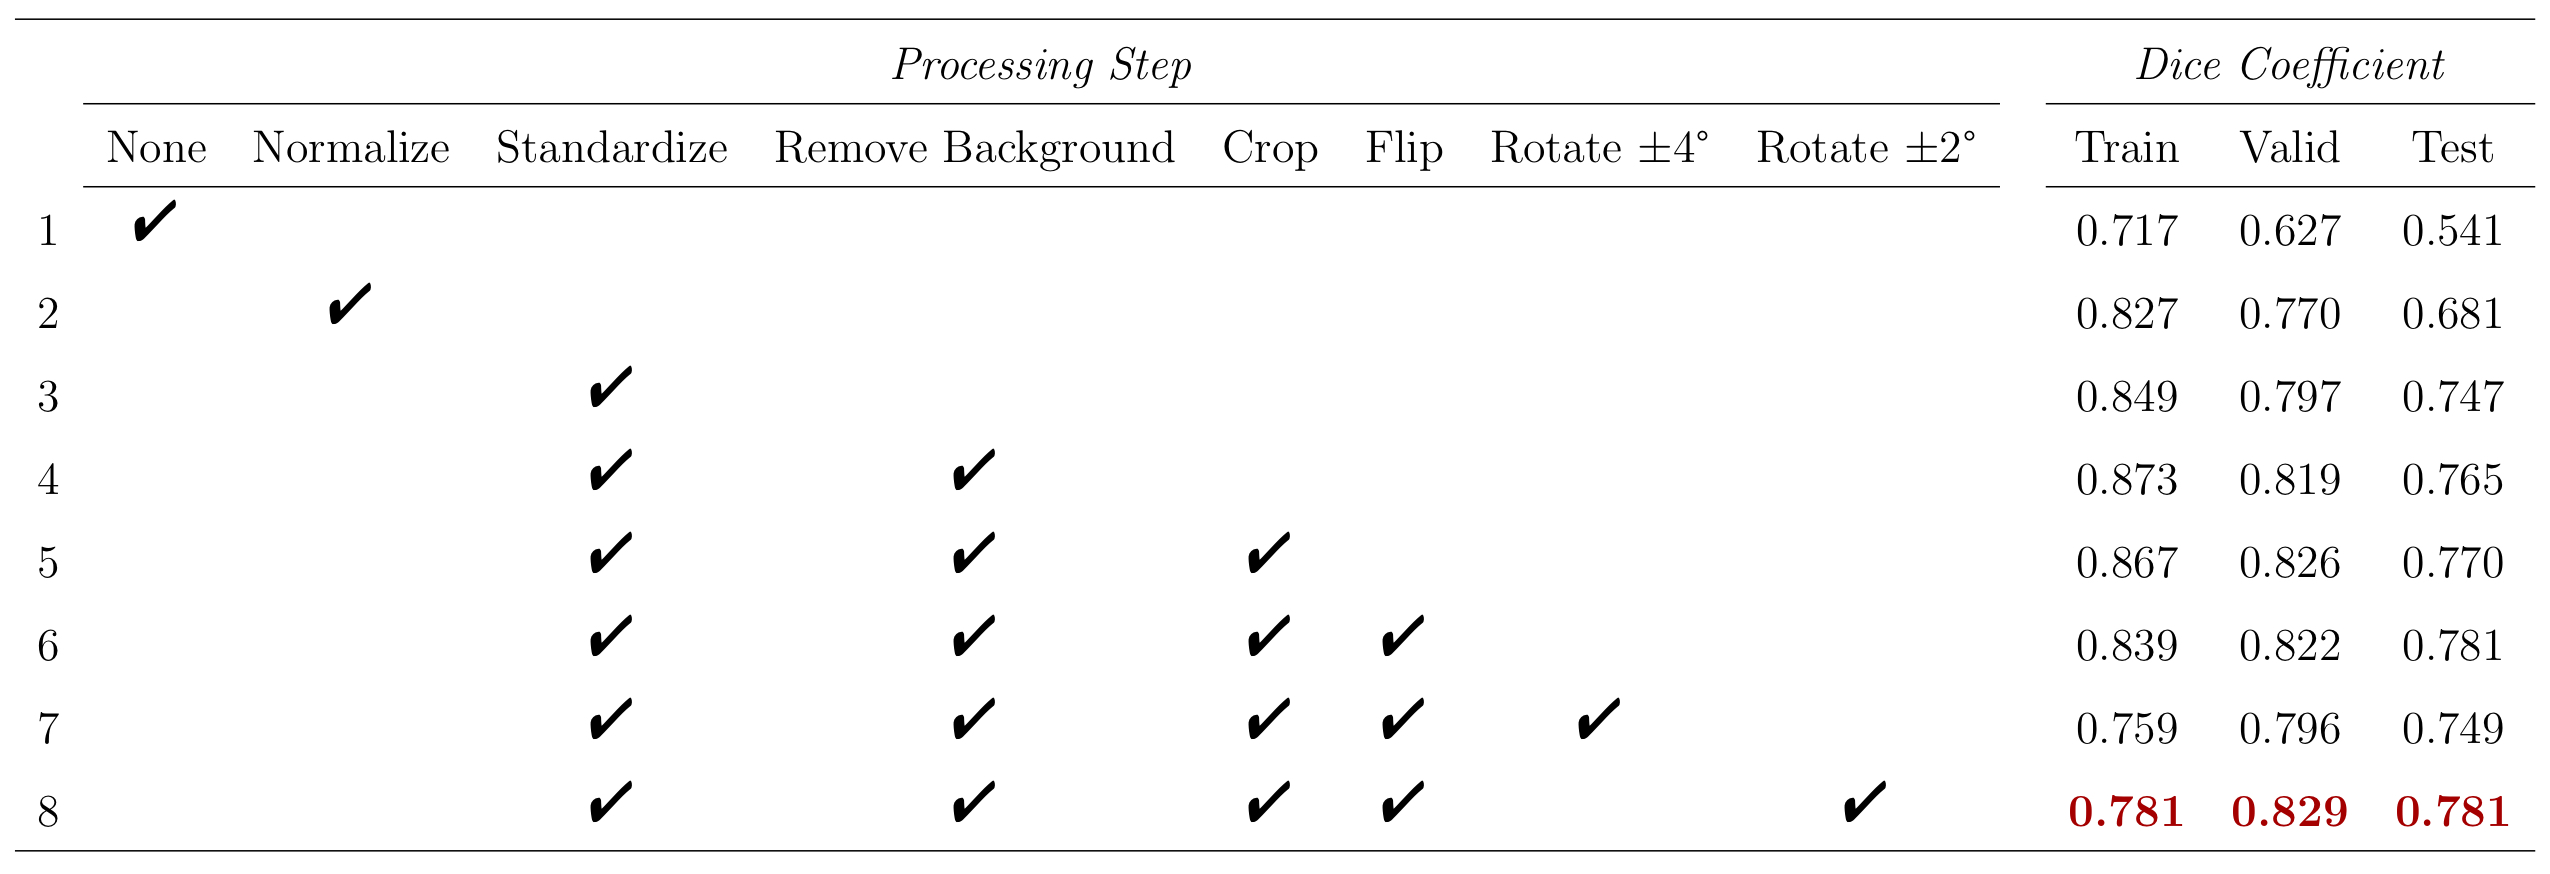
Figure 2. Data preprocessing and augmentation. Segmentation results with different pre-processing and data augmentation steps are shown with dice similarity coefficients reported for training, cross-validation and holdout test sets.
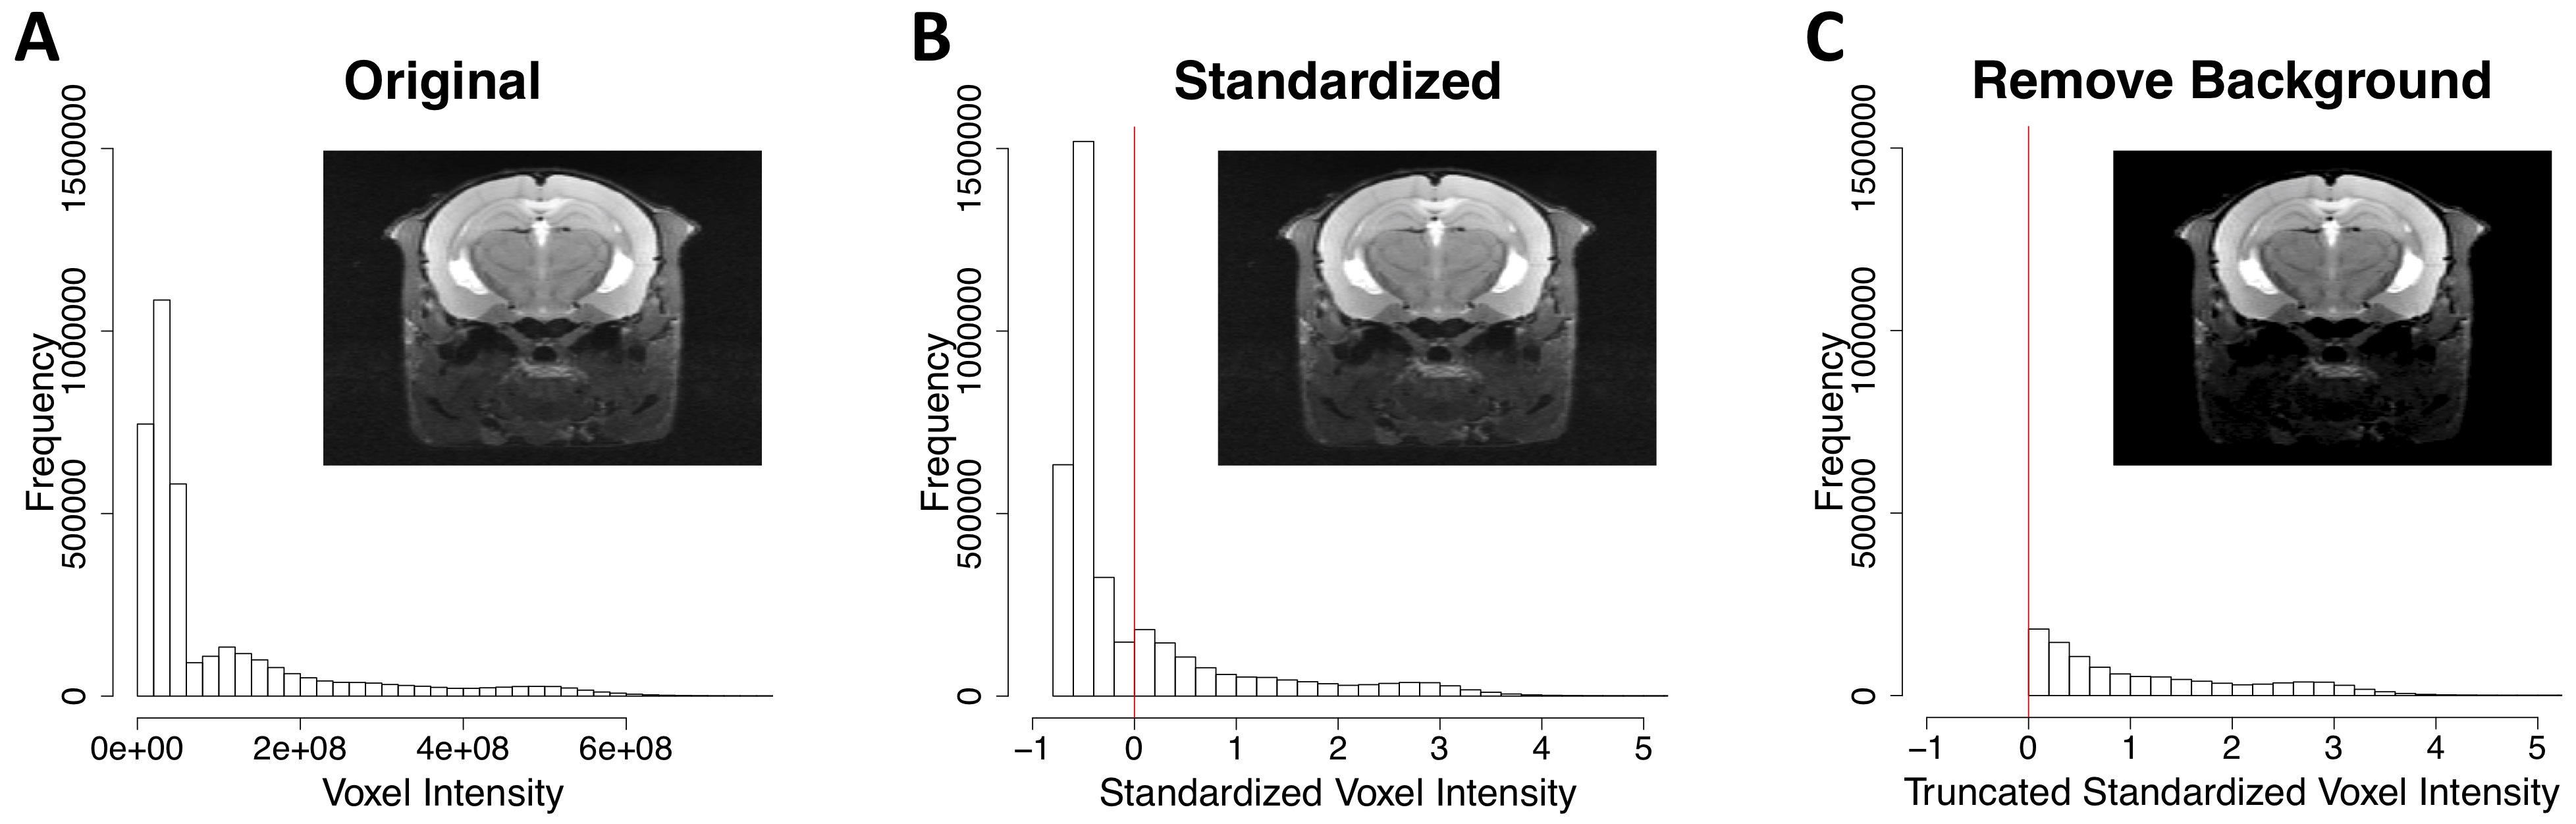
Figure 3. Per-voxel histograms. For scan 3 in Figure 1, per-voxel histograms and transverse slices approximately through the center of the lesion is shown for A) the original image, B) the standardized image where the mean voxel intensity is indicated by the red vertical line and C) the standardized image with background/low intensity voxels removed (standardized voxel intensities less than zero are set to 0).
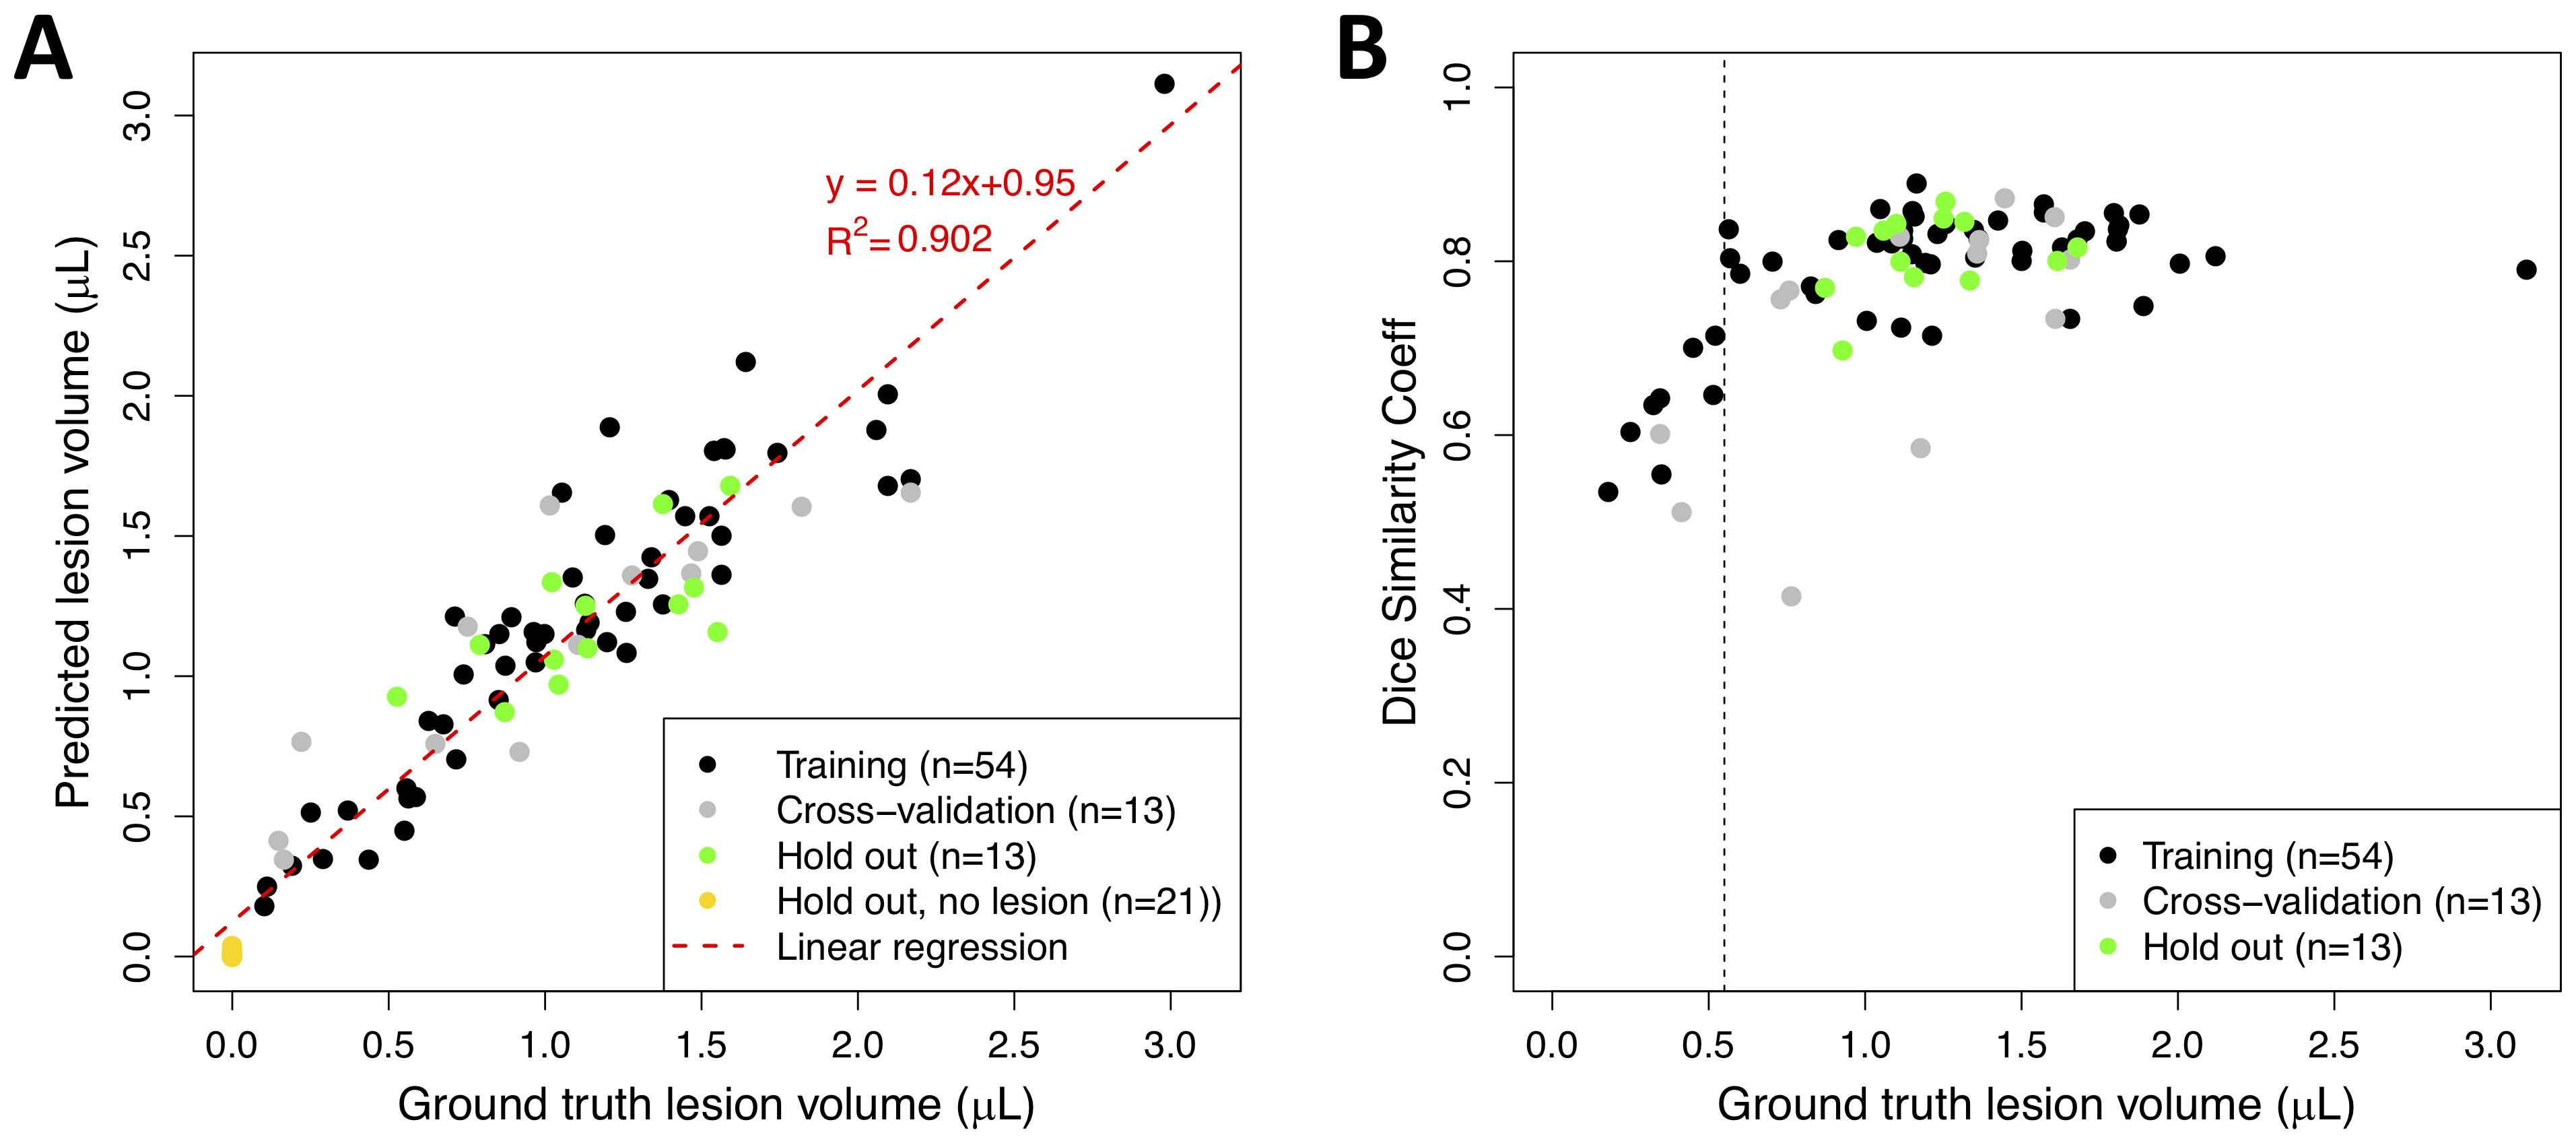
Figure 4. Per-animal predicted volumes and dice similarity coefficients. A) Distribution of DSC achieved during training (network in Figure 2, row 8) vs. volume (units are number of voxels) of ground truth ROIs. B) Predicted ROI volume vs. ground truth volume (units are number of voxels). Prediction is performed using trained network shown in Figure 2, row 8.