2572
Spatio-temporal alterations in resting-state co-activation patterns in a rat model of sporadic Alzheimer’s disease1CIBM Center for Biomedical Imaging, Lausanne, Switzerland, 2Animal Imaging and Technology, Ecole Polytechnique Fédérale de Lausanne, Lausanne, Switzerland, 3Laboratory of Functional and Metabolic Imaging, Ecole Polytechnique Fédérale de Lausanne, Lausanne, Switzerland
Synopsis
Impaired brain glucose consumption is a possible trigger of Alzheimer’s disease (AD). Previous work revealed affected brain structure and function by insulin resistance in terms of altered static functional connectivity (FC) in an intracerebroventricular-streptozotocin (icv-STZ) rat model of AD. Here, we used the co-activation patterns (CAP) method, a dynamic FC approach, to assess differences between icv-STZ rats and healthy controls. STZ rats displayed early higher predominance of states involving brain regions shown as hyperconnected by the static FC analysis. Longitudinally, specific brain states declined in the STZ rats only.
Introduction
Impaired brain glucose consumption is a possible trigger of Alzheimer’s disease (AD)1, along with amyloid plaques and neurofibrillary tangles of tau. Previous work has shown brain structure and function were affected by insulin resistance in terms of altered resting-state (rs-) functional connectivity (FC) in the default mode network (DMN) and the lateral cortical network (LCN), as well as damaged white matter microstructure in an intracerebroventricular (icv)-streptozotocin (STZ) rat model of sporadic Alzheimer’s disease2.However, the aforementioned FC which estimates correlations of fMRI signals of regions was computed from the entire length of the fMRI time courses, reflecting only static brain functional patterns. Several approaches regarded as dynamic functional connectivity (dFC) have been proposed to investigate dynamic variations within the rs-fMRI time series3, including sliding window analysis4 and co-activation patterns (CAP) analysis5. In sliding window analysis, a temporal window with a specific length and shape is chosen and FCs are computed within the window. This method is faced with many limitations such as the choice of window length3. In contrast, CAP analysis as a data driven technique clusters rs-fMRI time frames to different CAPs which represent transient brain states5,6.
Here, we used the CAP method to identify CAP states in a large cohort of icv-STZ rats and healthy controls. The spatial and temporal features of the identified CAPs were compared between the two groups and the outcome of the CAP analysis was compared to the static rs-FC.
Methods
Experimental: All experiments were approved by the local Service for Veterinary Affairs. Male Wistar rats (236±11 g at baseline) underwent a bilateral icv-injection of either streptozotocin (3 mg/kg, STZ group) or buffer (CTL group). MRI: As a result of system upgrade, two cohorts (1/2) acquired on different MRI consoles (Varian/Bruker) were pooled after verifying their consistency. Cohorts 1/2: N=17/7 rats, STZ=9/3, CTL=8/4. Rats were scanned at 3 timepoints (2 weeks, 6 weeks and 13 weeks) following surgery. Rats were anesthetized using isoflurane for initial setup and switched to medetomidine sedation (bolus: 0.1mg/kg, perfusion: 0.1mg/kg/h). Two runs of rs-fMRI data were acquired using a two-shot gradient-echo EPI sequence (TE/TR=10/800ms; Matrix: 64x64; FOV: 23x23mm2; 8 1.12-mm slices; 370 repetitions; TA=10’) one hour after isoflurane clearance.Processing: Data preprocessing included MPPCA-denoising7,8, distortion9 and slice-timing corrections, spatial smoothing10, registration to a rat brain atlas using ANTs11, and removal of physiological noise following independent component (IC) analysis decomposition12 with high-pass temporal filtering (f>0.01Hz) and 40 IC’s13.
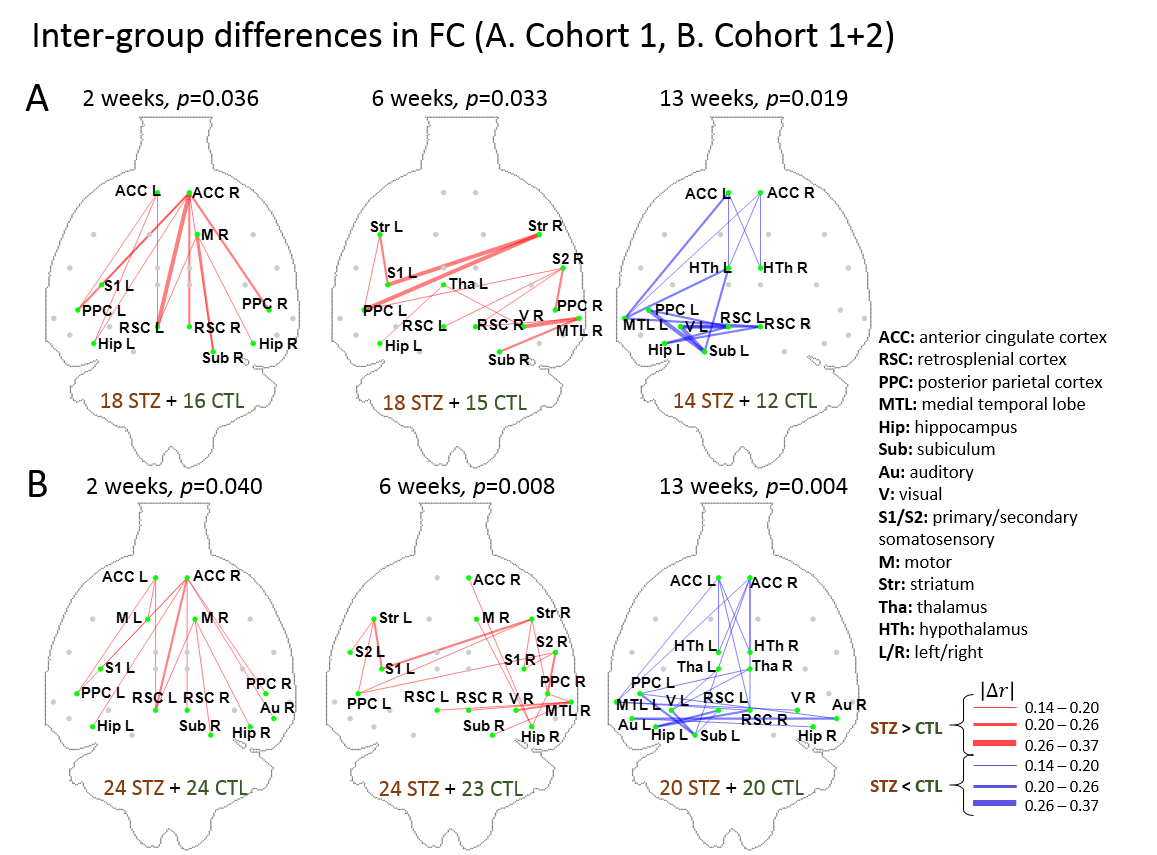
Static FC: FC between 28 atlas-defined regions of interest were computed using partial correlation, co-varying for the global signal. Group differences at each timepoint were tested using non-parametric permutation tests (N=5000) with NBS14 and family-wise error was corrected at p < 0.05.
dFC: Preprocessed images were normalized to an fMRI template using ANTs11 at each timepoint and seed-free two-group CAP analysis was performed for CTL and STZ using TbCAPs15. Moreover, all fMRI datasets were normalized to a common template and longitudinal CAP analysis with 3 timepoints was performed for each group. Significant differences in CAP metrics (CAP occurrences, average duration, resilience and betweenness centrality) were tested using t-test and ANOVA.
Results
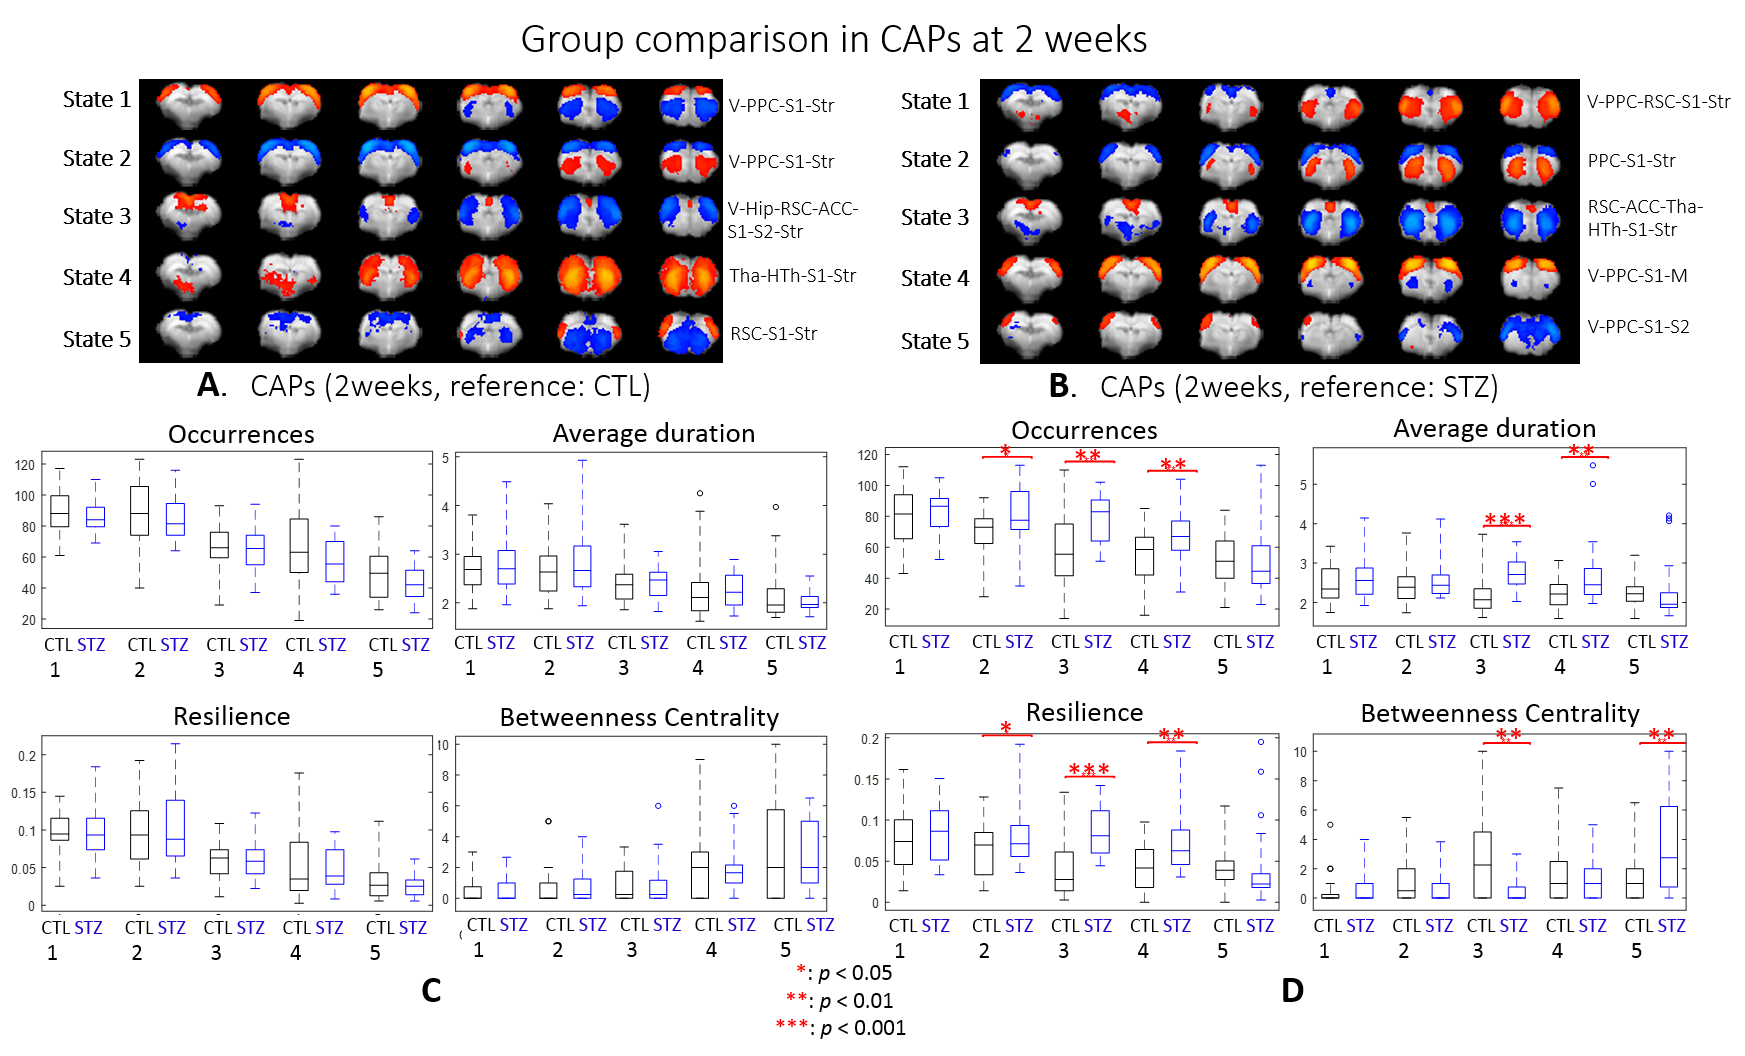
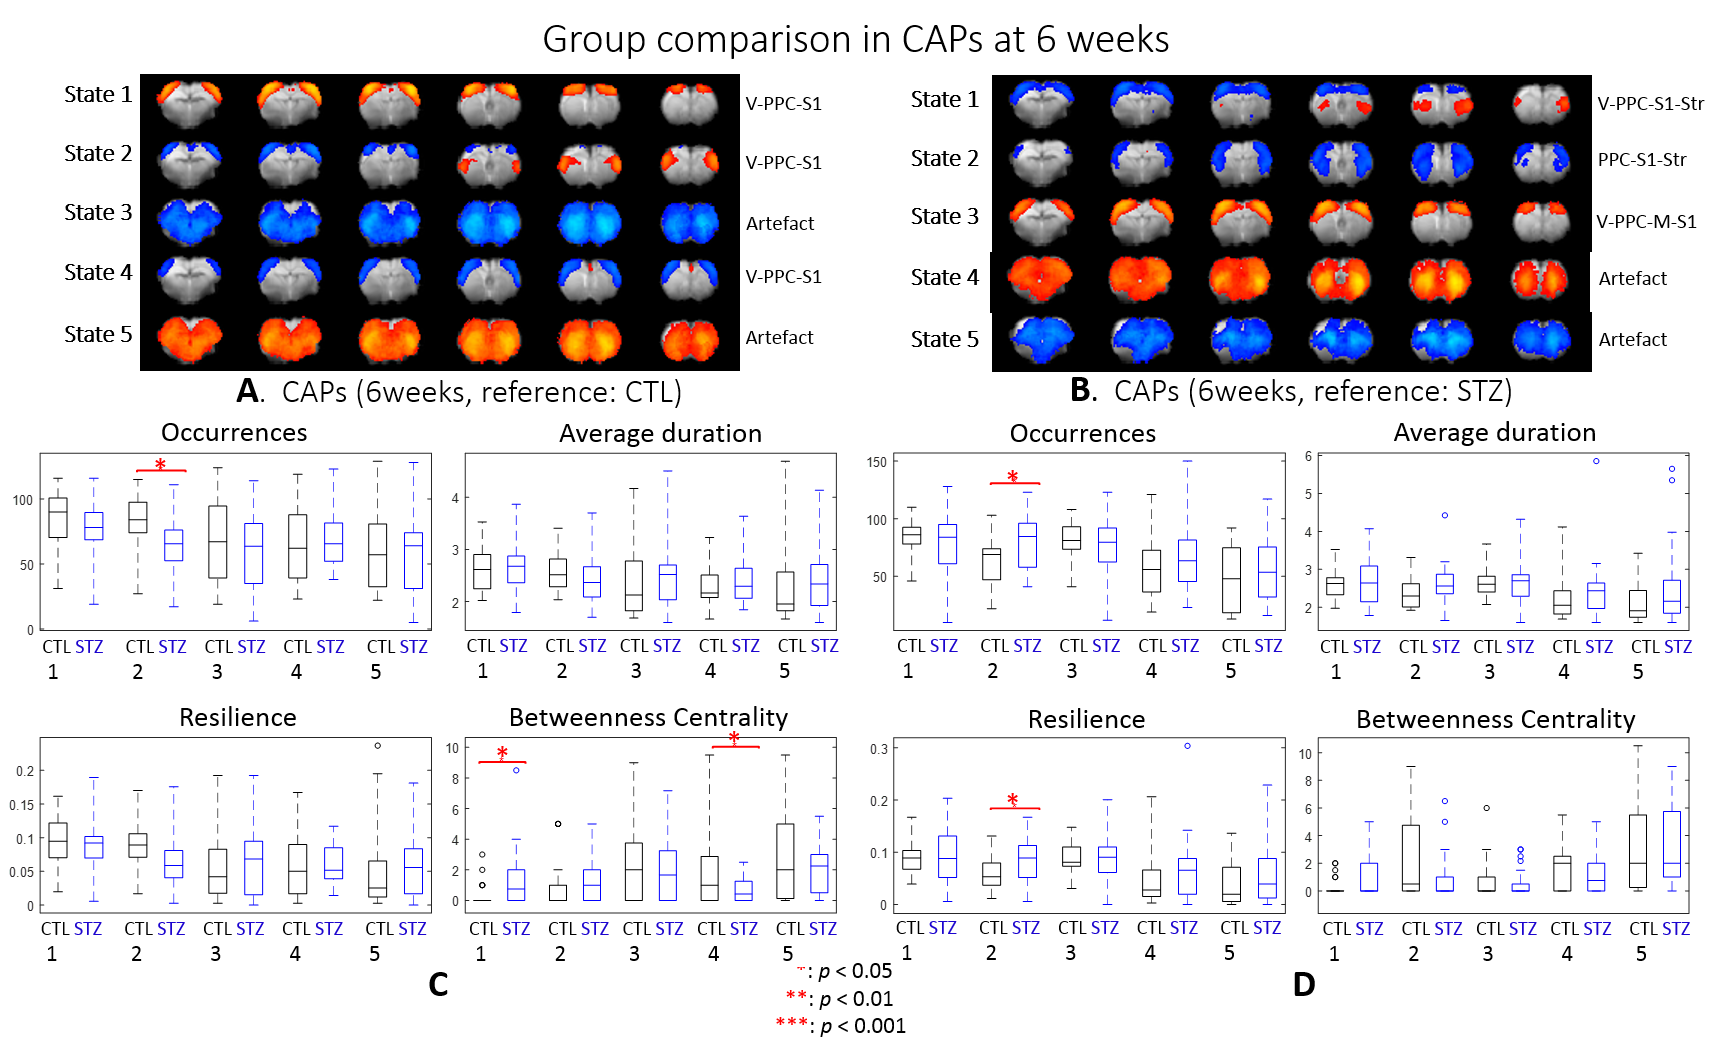
After combining two cohorts, the amount of the data was increased by 30% to 50% at each timepoint; however, the intergroup differences were largely retained, which suggests the consistency of data acquired on different MRI consoles (Fig 1).The intergroup comparison of CAPs at each timepoint revealed significant changes in STZ rats at 2 and 6 weeks in brain states covering RSC, PPC, ACC, visual cortex, motor cortex, somatosensory cortex (S1), thalamus, hypothalamus and striatum (Figs. 2 – 3).
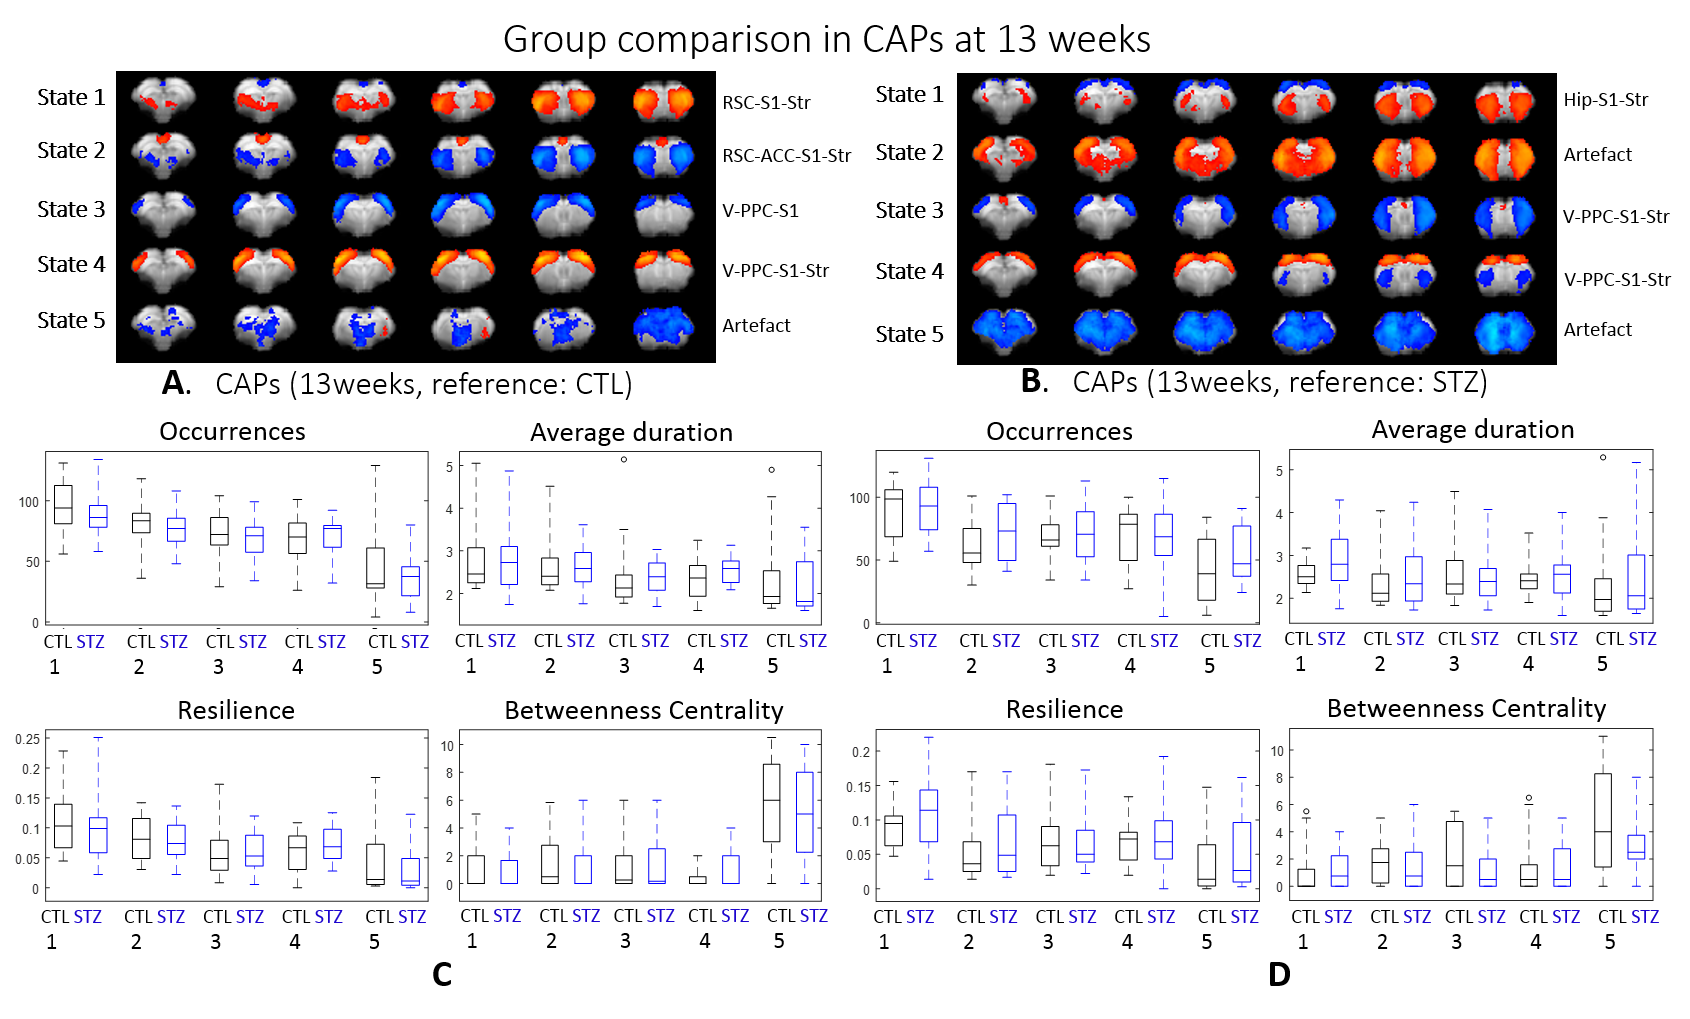
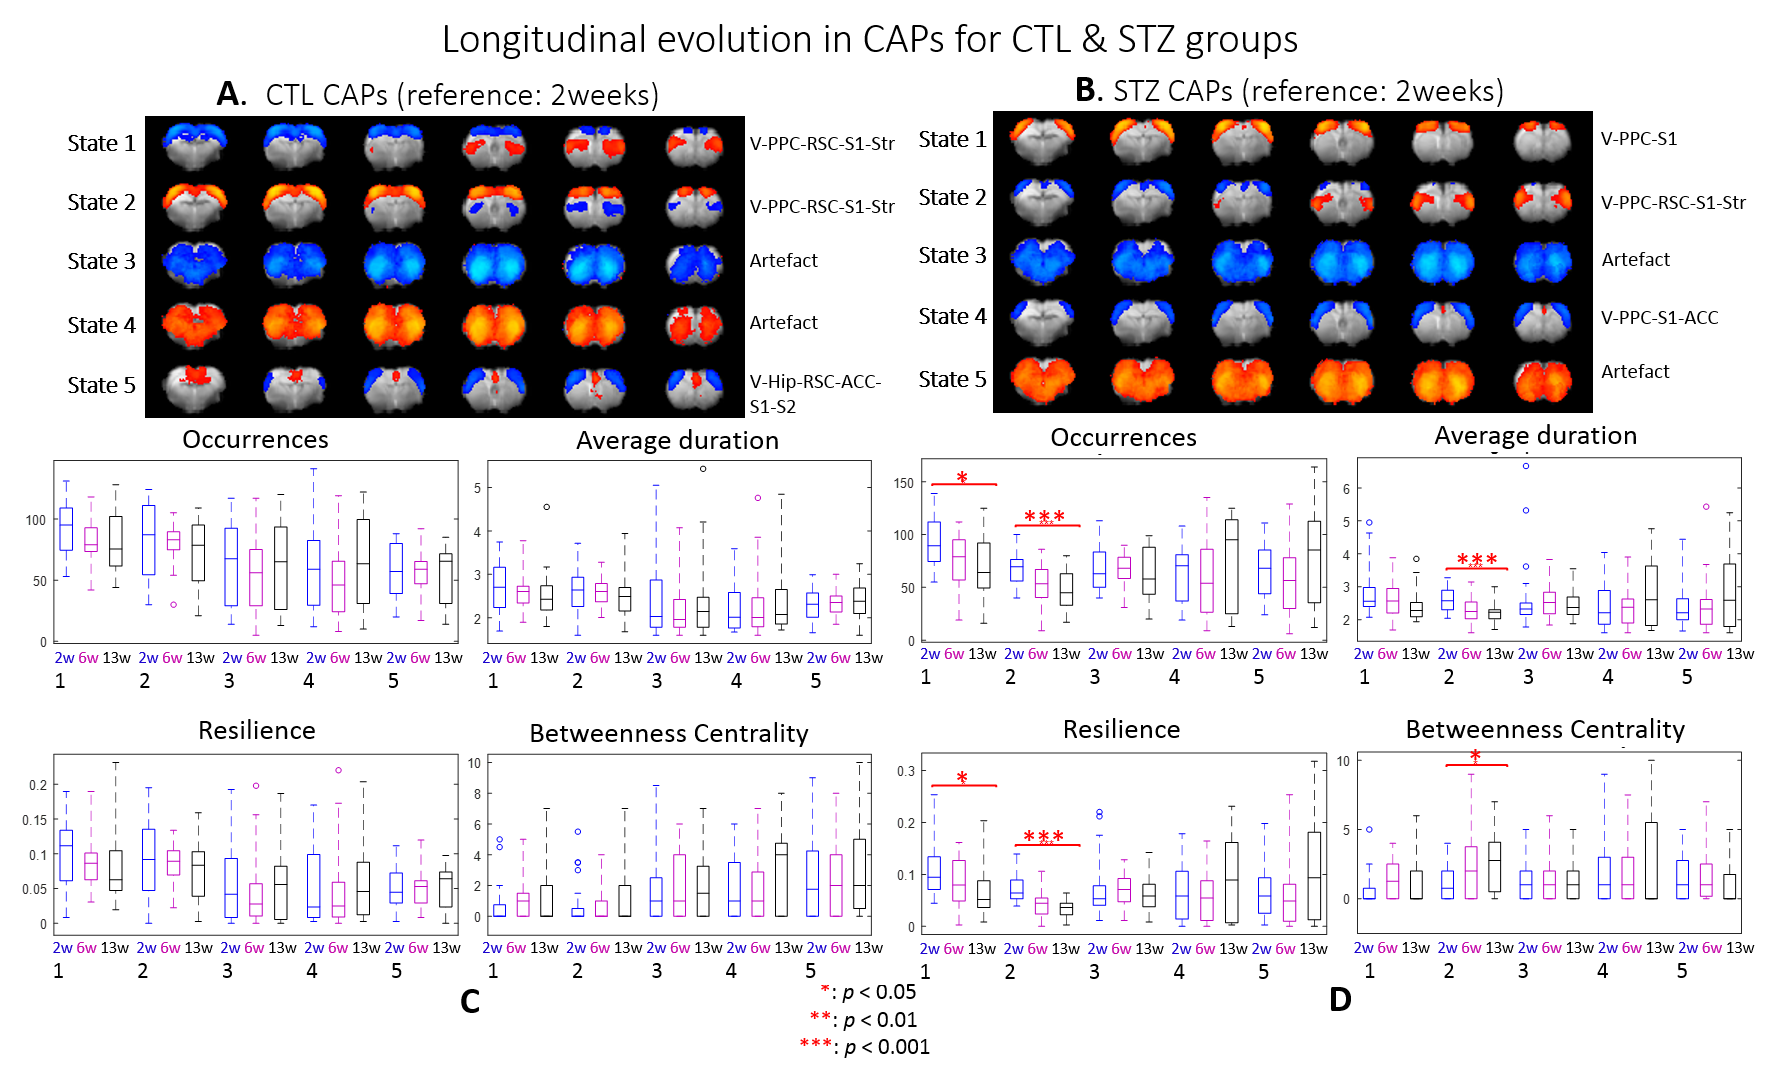
Within group longitudinal analysis detected no changes in CTL rats while in the STZ group, CAPs 1 & 2 occurred increasingly less and became brief transit states (Fig. 5). The two CAPs at stake covered regions including visual cortex, PPC, RSC, S1 and striatum
Discussion and Conclusions
Most CAPs exhibiting intergroup differences and longitudinal changes in STZ rats cover brain regions in DMN including PPC, RSC, ACC and visual cortex, LCN including S1 and motor cortex, and striatum16,17. DMN is typically affected by AD18,19 while an early disruption of striatum in STZ rats was also reported20. Intergroup differences at 2 weeks revealed increased occurrences of co-activation in PPC, visual, motor and S1 (CAP4), and co-activation in RSC and ACC while co-deactivation in thalamus, hypothalamus, striatum and S1 (CAP3) in STZ rats. This suggests increased connectivity between those regions at an early timepoint, which is consistent with literature21 and with hyper-connectivity found in static FC at 2 & 6 weeks. Longitudinal analysis showed declining occurrences of co-activation of PPC, S1 and visual cortex (CAP1), as well as opposite activation between S1, striatum and PPC, RSC, visual cortex (CAP2) in STZ rats only. This indicates reduced connectivity between these regions over time in STZ rats, consistent with hypoconnectivity in static FC at 13 weeksCAP analysis provides a complementary insight to static FC into the evolution of functional connectivity in STZ rats by reporting on the dynamics of FC. Therefore CAPs can be potent biomarkers in the investigation of neurodegeneration. Future work will focus on relating dynamic FC to other metrics such as brain glucose hypometabolism and microstructure degeneration.
Acknowledgements
We acknowledge access to the facilities and expertise of the CIBM Center for Biomedical Imaging, a Swiss research center of excellence founded and supported by Lausanne University Hospital (CHUV), University of Lausanne (UNIL), Ecole polytechnique fédérale de Lausanne (EPFL), University of Geneva (UNIGE) and Geneva University Hospitals (HUG).References
1. Talbot, K. et al. Demonstrated brain insulin resistance in Alzheimer’s disease patients is associated with IGF-1 resistance, IRS-1 dysregulation, and cognitive decline. J. Clin. Invest. 122, 1316–1338 (2012).
2. Tristão Pereira, C. et al. Synchronous nonmonotonic changes in functional connectivity and white matter integrity in a rat model of sporadic Alzheimer’s disease. NeuroImage 225, 117498 (2021).
3. Preti, M. G., Bolton, T. A. & Van De Ville, D. The dynamic functional connectome: State-of-the-art and perspectives. NeuroImage 160, 41–54 (2017).
4. Hutchison, R. M. et al. Dynamic functional connectivity: Promise, issues, and interpretations. NeuroImage 80, 360–378 (2013).
5. Liu, X. & Duyn, J. H. Time-varying functional network information extracted from brief instances of spontaneous brain activity. Proc. Natl. Acad. Sci. 110, 4392–4397 (2013).
6. Liu, X., Zhang, N., Chang, C. & Duyn, J. H. Co-activation patterns in resting-state fMRI signals. NeuroImage 180, 485–494 (2018).
7. Veraart, J. et al. Denoising of diffusion MRI using random matrix theory. NeuroImage 142, 394–406 (2016).
8. Ades-Aron, B. et al. Improved Task-based Functional MRI Language Mapping in Patients with Brain Tumors through Marchenko-Pastur Principal Component Analysis Denoising. Radiology 200822 (2020) doi:10.1148/radiol.2020200822.
9. Smith, S. M. et al. Advances in functional and structural MR image analysis and implementation as FSL. NeuroImage 23 Suppl 1, S208-219 (2004).
10. Friston, K. J., Ashburner, J., Kiebel, S. J., Nichols, T. E. & Penny, W. D. Statistical Parametric Mapping. in (2007). doi:10.1007/978-1-4615-1079-6_16.
11. Avants, B. B., Epstein, C. L., Grossman, M. & Gee, J. C. Symmetric diffeomorphic image registration with cross-correlation: Evaluating automated labeling of elderly and neurodegenerative brain. Med. Image Anal. 12, 26–41 (2008).
12. Griffanti, L. et al. Hand classification of fMRI ICA noise components. NeuroImage 154, 188–205 (2017).
13. Diao, Y., Yin, T., Gruetter, R. & Jelescu, I. O. An optimized pipeline for functional connectivity analysis in the rat brain. ArXiv200109857 Phys. Q-Bio (2020).
14. Zalesky, A., Fornito, A. & Bullmore, E. T. Network-based statistic: Identifying differences in brain networks. NeuroImage 53, 1197–1207 (2010).
15. Bolton, T. A. W. et al. TbCAPs: A toolbox for co-activation pattern analysis. NeuroImage 211, 116621 (2020).
16. Lu, H. et al. Rat brains also have a default mode network. Proc. Natl. Acad. Sci. 109, 3979–3984 (2012).
17. Sierakowiak, A. et al. Default Mode Network, Motor Network, Dorsal and Ventral Basal Ganglia Networks in the Rat Brain: Comparison to Human Networks Using Resting State-fMRI. PLOS ONE 10, e0120345 (2015).
18. Agosta, F. et al. Resting state fMRI in Alzheimer’s disease: beyond the default mode network. Neurobiol. Aging 33, 1564–1578 (2012).
19. Brier, M. R. et al. Loss of Intranetwork and Internetwork Resting State Functional Connections with Alzheimer’s Disease Progression. J. Neurosci. 32, 8890–8899 (2012).
20. Moreira-Silva, D. et al. Anandamide Effects in a Streptozotocin-Induced Alzheimer’s Disease-Like Sporadic Dementia in Rats. Front. Neurosci. 12, (2018).
21. Dickerson, B. C. et al. Increased hippocampal activation in mild cognitive impairment compared to normal aging and AD. Neurology 65, 404–411 (2005).
Figures