2567
Early Adoptive Transfer of T Cells Decreases Brain Bleeding during Vesicular Stomatitis Virus Infection: A MRI Study1National Institute of Neurological Disorders and Stroke, National Institute of Health, Bethesda, MD, United States
Synopsis
MRI was used to follow bleeding and T cell infiltration in mouse model of nasal infection of the brain with VSV. Microbleeds were identified as an early pathological and neuroimaging marker using high-resolution T2*-weighted MRI. Adoptive transfer of virus specific CD8 T cells helped clear VSV, decreased microbleeds but did not stop all microbleeds. Labeling T cells with MPIOs enabled MRI cell tracking and showed the earliest T cell infiltration in the brain. CD8 T cell infiltration and vessel rupture happened 1-day post-infection at glomerular layer, while T cells could be detected at the center of bulb before vessel breakdown.
INTRODUCTION:
Viral infection of the CNS is a major source of human morbidity and mortality. How virus invades the CNS and affects the brain vascular integrity is still unclear. Immune-CNS interactions are at the core of pathological damage in the setting of CNS viral infections and many other neurological disorders. To address the questions of where and how brain vessel damage first develops, the degree of vessel damage, and the consequences of immune cell infiltration, MRI of microbleeds and immune cell trafficking through the whole brain may be very useful. Using microbleeds as a marker of cerebrovasculature breakdown, we studied the relationship between vascular disruption and CD8 T cell infiltration through T2*-weighted MRI during neurotropic virus infection of brain using a mouse model of vesicular stomatitis virus (VSV) intranasal infection. VSV is known to enter the brain via pathways through the olfactory system1 but the cascade of events throughout the brain and throughout the course of infection has not been well described.METHODS:
Intranasal VSV infection. A dose of 3.5 x 10⁴ PFU in 10 μL of PBS was pipetted into each nostril. Timing is given as days post infection (dpi) and 6-dpi was the encephalitis peak time.OT-1 CD8 T cell labeling with MPIO and adoptive transfer. We developed a T cell labeling technique by using a micron-sized iron-oxide particle (MPIO), which provides high sensitivity to MRI2,3. CD8 T cells were incubated with MPIO-NH2-anti-CD3-antibody at the ratio of 1:5 overnight. 500,000 MPIO-labeled T cells were administered through tail vein.
MRI study. MRI experiments were done on an 11.7-T animal scanner. T2*-weighted 3D gradient-recalled echo (GRE) sequences were used for acquisitions. For in-vivo imaging: isotropic resolution=75 μm, TE/TR=10/30 ms, FA=10°, NA=3. Ex-vivo imaging: isotropic resolution=50 μm, TE/TR=20/40 ms, FA=15°, NA=12.
RESULTS:
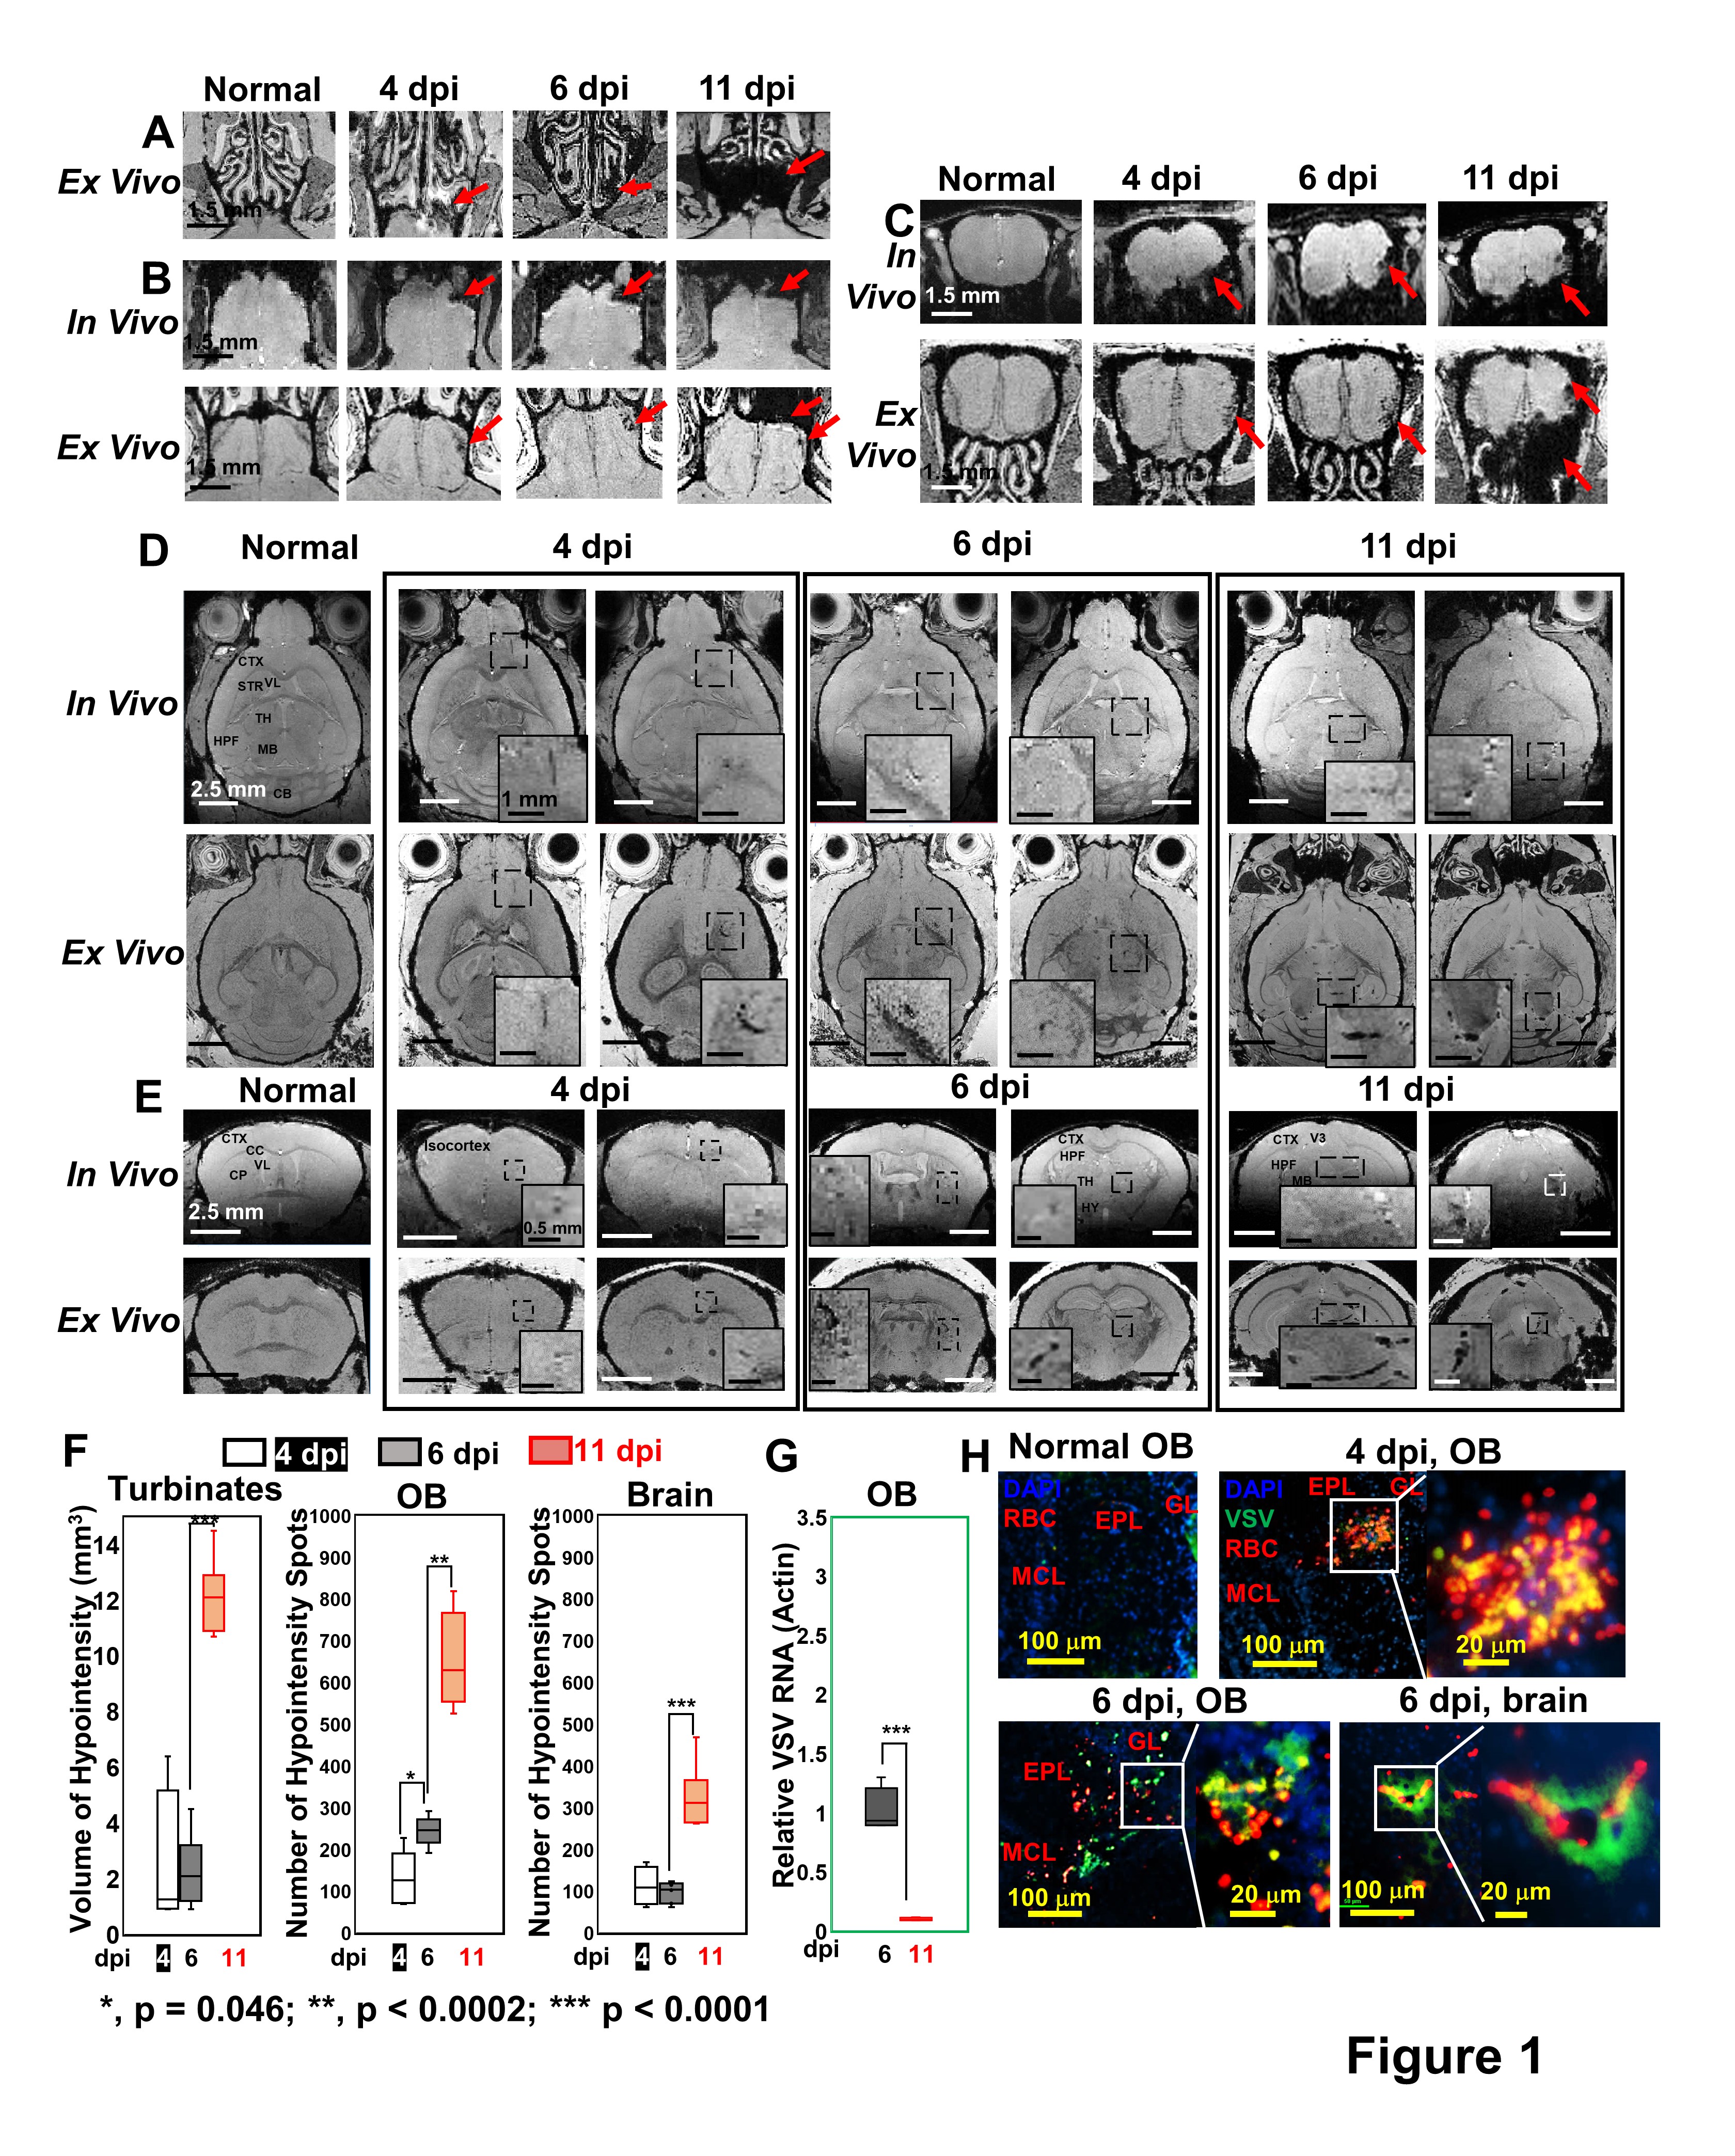
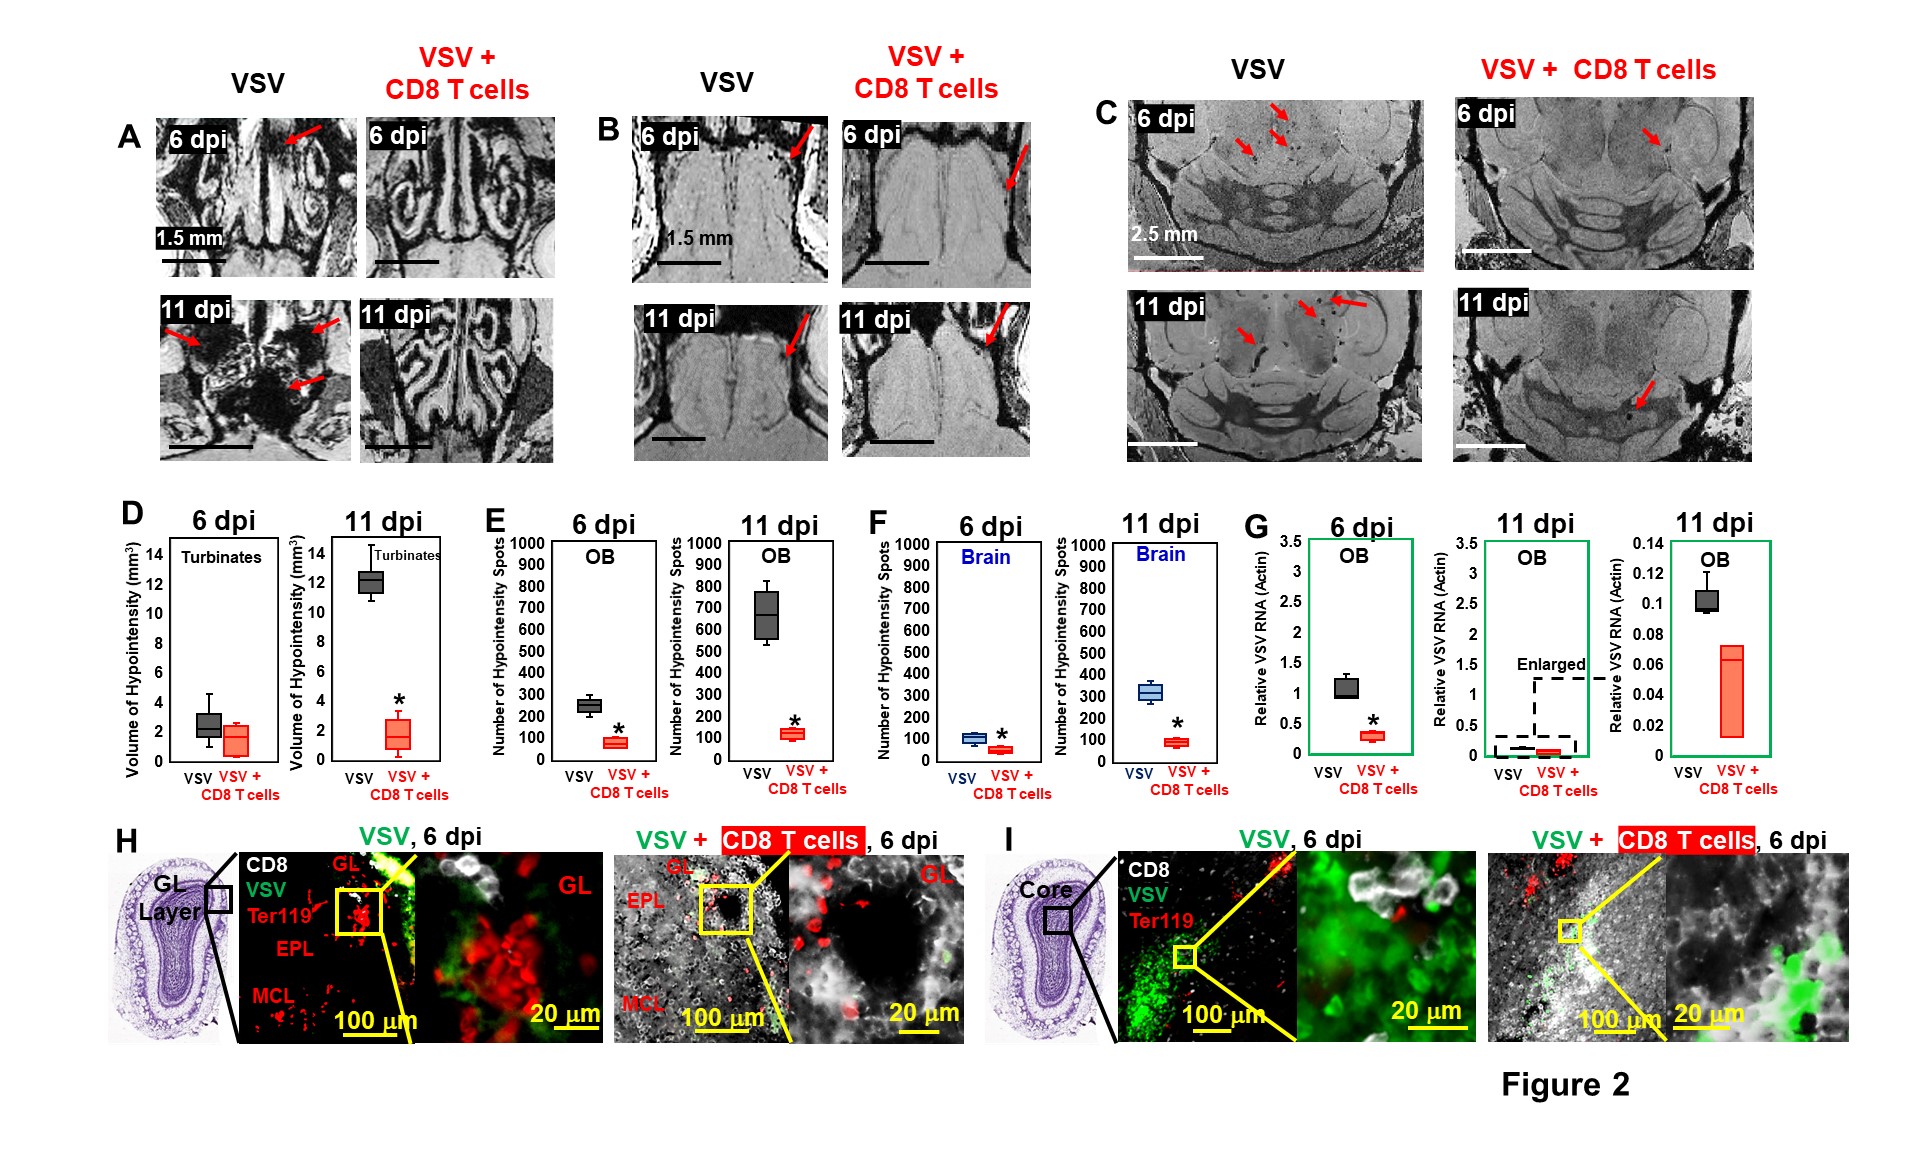
As early as 3-4 dpi, MRI detected many hypointensities on T2* MRI that were attributed to vessel rupture and bleeding at the turbinates (Fig 1A), glomerular layer (GL) of the olfactory bulb (OB, Fig 1B,C), and frontal brain (Fig 1D,E). 4-6 dpi, more hypointensities were detected in granular cell layer (GCL) of OB and mid-brain. The increasing amount of hypointensitites was quantified as a function of time (Fig 1F). Viral titers reached their peak (relative VSV RNA to actin RNA=0.95) on 6-dpi before going down to undetectable levels by 11-dpi (Fig 1G). IHC confirmed that the MRI hypointensites were due to microbleeds which largely co-localized with VSV (Fig 1H).It was next determined if increasing peripheral immune responses by adoptive transfer of virus specific CD8 T cells would show anti-viral therapeutic effects. MRI showed decreased bleeding in the turbinates, OB, and brain upon T cell transfer on 6- and 11-dpi (Fig 2A-C), as quantified in Fig 2D-F. CD8 T cells reduce viral titers on 6-dpi (Fig 2G). IHC revealed that there was a large amount of T cells, and small amount of VSV and microbleeds in the OB on 6-dpi upon T cells transfer (Fig 2H-I). However, microbleeds were still observed, especially near the regions with a high density of T cells.
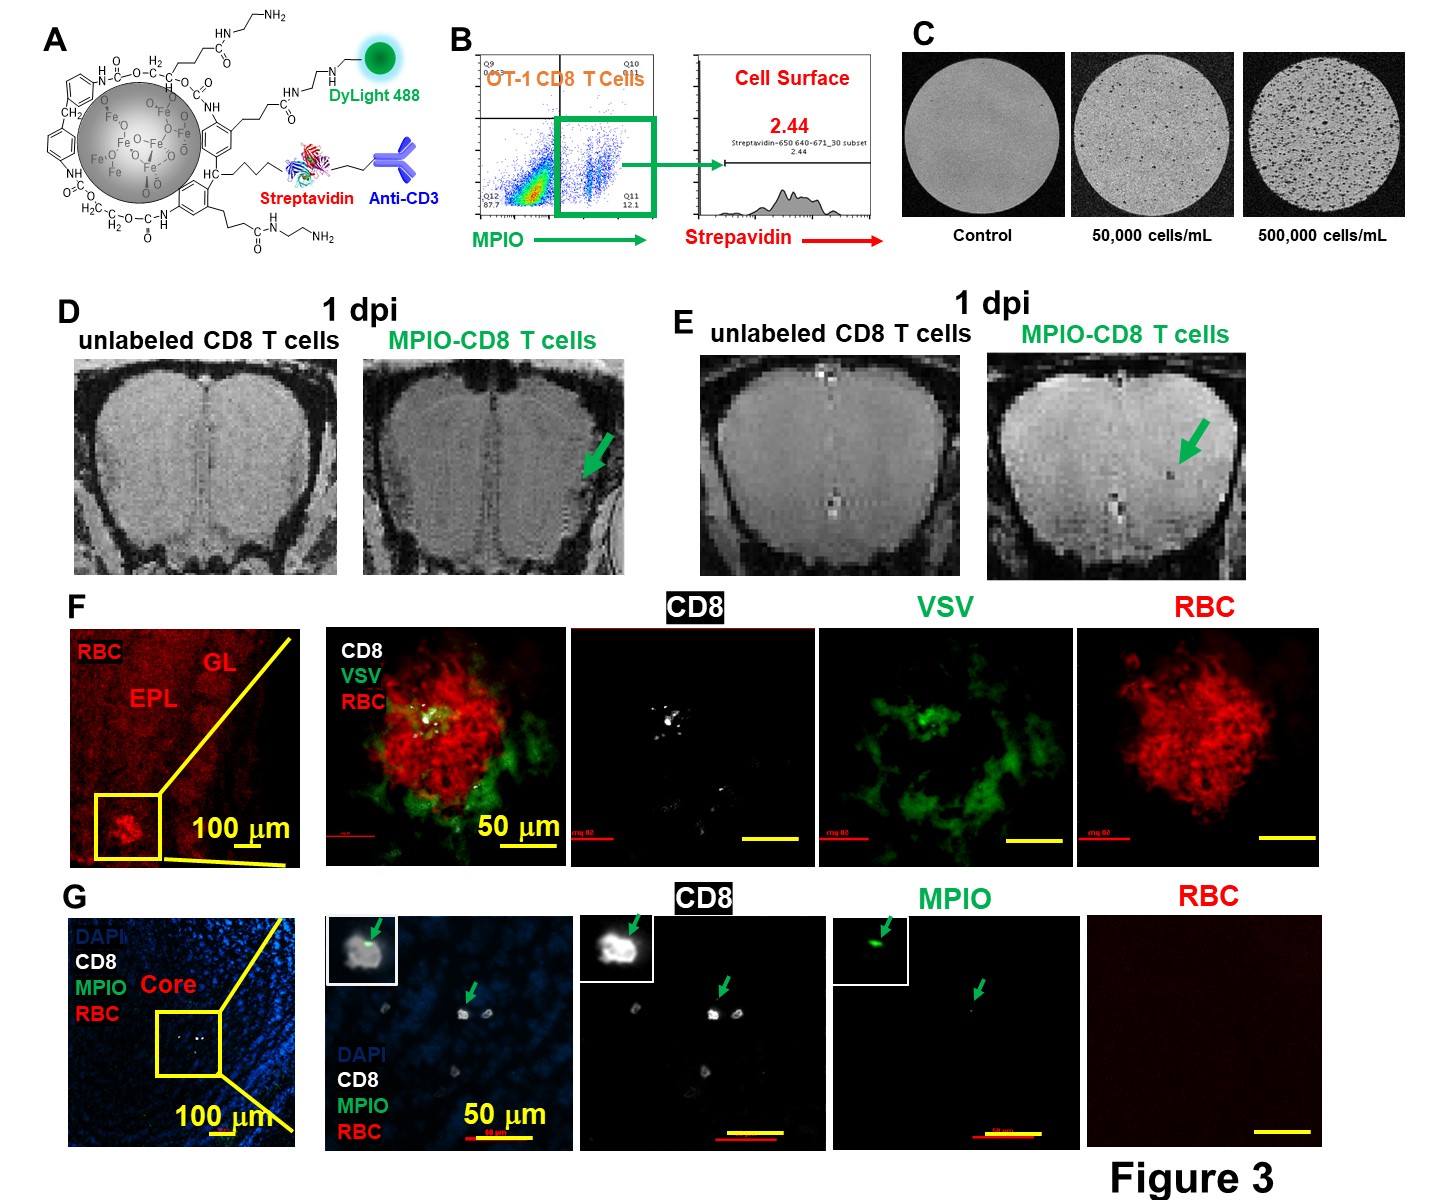
To detect T cells by MRI early in the course of viral infection, MPIO particles were modified to label T cells (Fig 3A). T cell labeling efficiency was ~12% and the majority of MPIOs were localized inside the cells (Fig 3B). MPIO-labeled T cells show high MR sensitivity, enabling single cell detection (Fig 3C). During MRI T cell tracking on 1-dpi, the earliest hypointensity spots were detected near the GL (Fig 3D) as well as in the middle of OB (Fig 3E). Similar hypointensities were not detected in controls infused with unlabeled CD8 T cells. IHC showed that, in the GL, CD8 T cell infiltration and vessel rupture were both present at this early time point (Fig 3F). Since MPIOs and blood give similar T2* effects it required histology to distinguish. The hypointensity spot in the GL was caused by the combination of MRI contrast from MPIO-labeled T cells and microbleeds. While in the center, MPIO-labeled T cells were detected prior to vessel breakdown (Fig 3G).
DISCUSSION:
The earliest CD8 T cells infiltration was detected in the center of OB before vessel breakdown. It is likely that ability of virus specific T cells to traffic to sites of virus reproduction prior to vascular damage explains why adoptive transfer greatly reduced brain bleeding. Future studies should enable us to track T cells to determine if they migrate from sites of vessel disruption to other areas of the brain or if they take other routes to get into the brain.CONCLUSION:
High resolution MRI of brain VSV infection enabled using microbleeds as a measure of neuroinflammation and to assess the therapeutic response of adoptive T cell transfer. MRI T cell tracking at early stages of the infection allowed identification of sites of earliest T cell response to virus prior to MRI detectable bleeding. The combination of MRI contrast from MPIO-labeled T cells and microbleeds may provide an approach for early detection of neuroinflammation. In addition to understanding timing and routes of T cell entry into the brain, MRI cell tracking may also be helpful for optimizing cell therapies.Acknowledgements
No acknowledgement found.References
1. Moseman EA, Blanchard AC, Nayak D, and McGavern DB. T cell engagement of cross-presenting microglia protects the brain from a nasal virus infection. Sci. Immunol. 2020;5(48):eabb1817.
2. Shapiro EM, Skrtic S, Sharer K, Hill JM, Dunbar CE, and Koretsky AP. MRI detection of single particles for cellular imaging. Proc Natl Acad Sci U S A. 2004;101(30):10901-6.
3. Pothayee N, Cummings DM, Schoenfeld TJ, Dodd S, Cameron HA, Belluscio L, et al. Magnetic resonance imaging of odorant activity-dependent migration of neural precursor cells and olfactory bulb growth. Neuroimage. 2017;158:232-41.
Figures