2566
High-Resolution, Whole-Brain T1 and T2 Mapping of Monkey Using 3D Magnetic Resonance Fingerprinting at 9.4 T1Biomedical Engineering, Case Western Reserve University, Cleveland, OH, United States, 2High Magnetic Field Laboratory, Chinese Academy of Sciences, Hefei, China, 3Radiology, Case Western Reserve University, Cleveland, OH, United States, 4Physiology and Biophysics, Case Western Reserve University, Cleveland, OH, United States
Synopsis
A 3D MRF method was developed for T1 and T2 mapping of the entire monkey brain with high spatial resolution (0.35x0.35x1 mm3). A conformal head coil was used for improved SNR, which enabled a 24-fold acceleration in data acquisition. B1 inhomogeneity was corrected in dictionary matching. Comparison of the T1 and T2 maps showed a ~20% reduction of T2 in the globus pallidus of 6-year-old monkeys compared to 4-year-old monkeys.
Introduction
3D magnetic resonance fingerprinting (MRF) allows whole-brain T1 and T2 mapping at 0.8 to 1 mm resolution in human subjects.1,2 In combination with parallel imaging, an acceleration factor of 144 can be achieved. Translation of 3D MRF to preclinical studies has been challenging because of the requirement for higher spatial resolution and the lack of parallel imaging capability. In this study, we aimed to develop a 3D MRF method for high-resolution, whole-brain T1 and T2 mapping in monkeys. A conformal head coil was used for improved SNR, which enabled 0.35x0.35x1 mm3 resolution with 24-fold acceleration.Methods
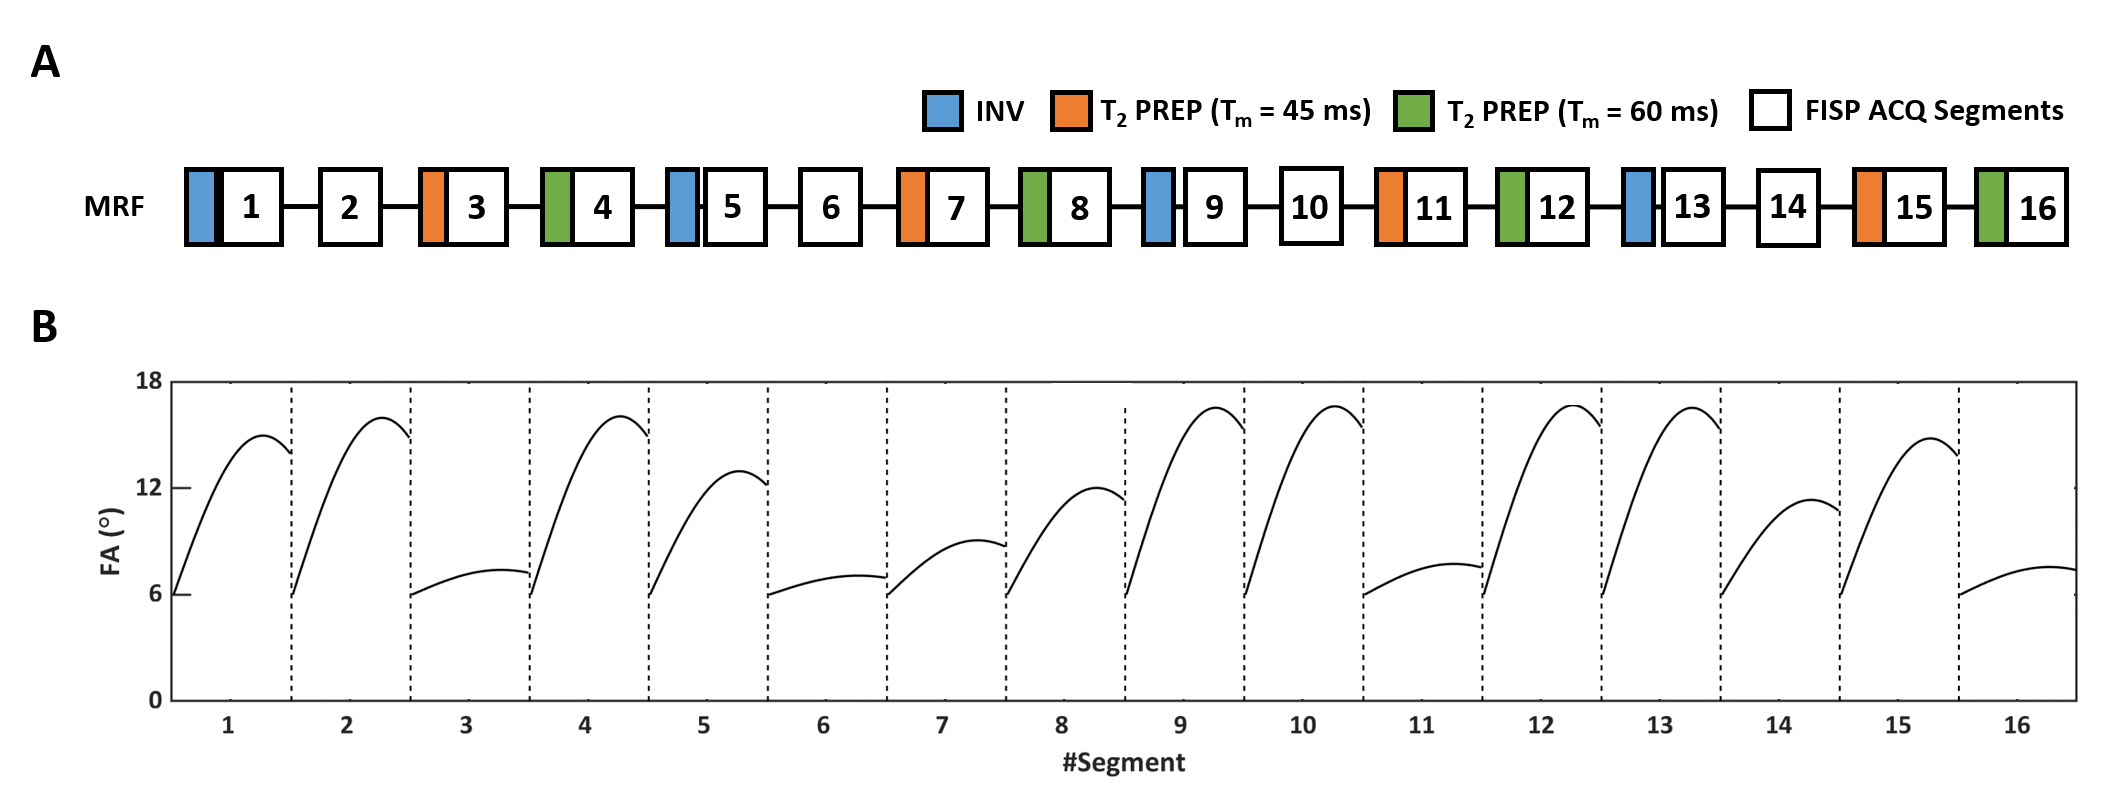
MRF Sequence: The MRF sequence consisted of FISP acquisitions of 768 frames partitioned into 16 segments (48 frames/segment) (Fig. 1). 4 segments were preceded by an adiabatic inversion pulse with an inversion time (TI) of 21, 56, 400, and 150 ms, respectively. 8 segments were preceded by a T2-preparation module with the mixing time (TM) alternated between 45 and 60 ms.3,4 Data acquisition used flip angles ramping up sinusoidally from 6° to a maximal value between 8° and 17° in each segment. Constant TE/TR of 1.7/10 ms was used. Acquisition time of a single fingerprint was ~21 s.3D MRF data were acquired using a stack-of-spirals trajectory. The spiral trajectory sampled the entire k-space in 96 interleaves with an FOV of 90x90 mm2 and a matrix size of 256x256. A dephasing gradient was used to induce a 4π dephasing per voxel along the slice-selective direction.
B1-Corrected Dictionary Matching: Dictionaries with a B1 factor ranging from 0.2 to 1.5 were simulated. When matching an acquired fingerprint to the dictionary, the B1 factor from a separately acquired B1 map was used to select the dictionary for matching. Normalized inner product between the acquired fingerprint and the simulated dictionary was used to find the best match to derive the T1 and T2 values.
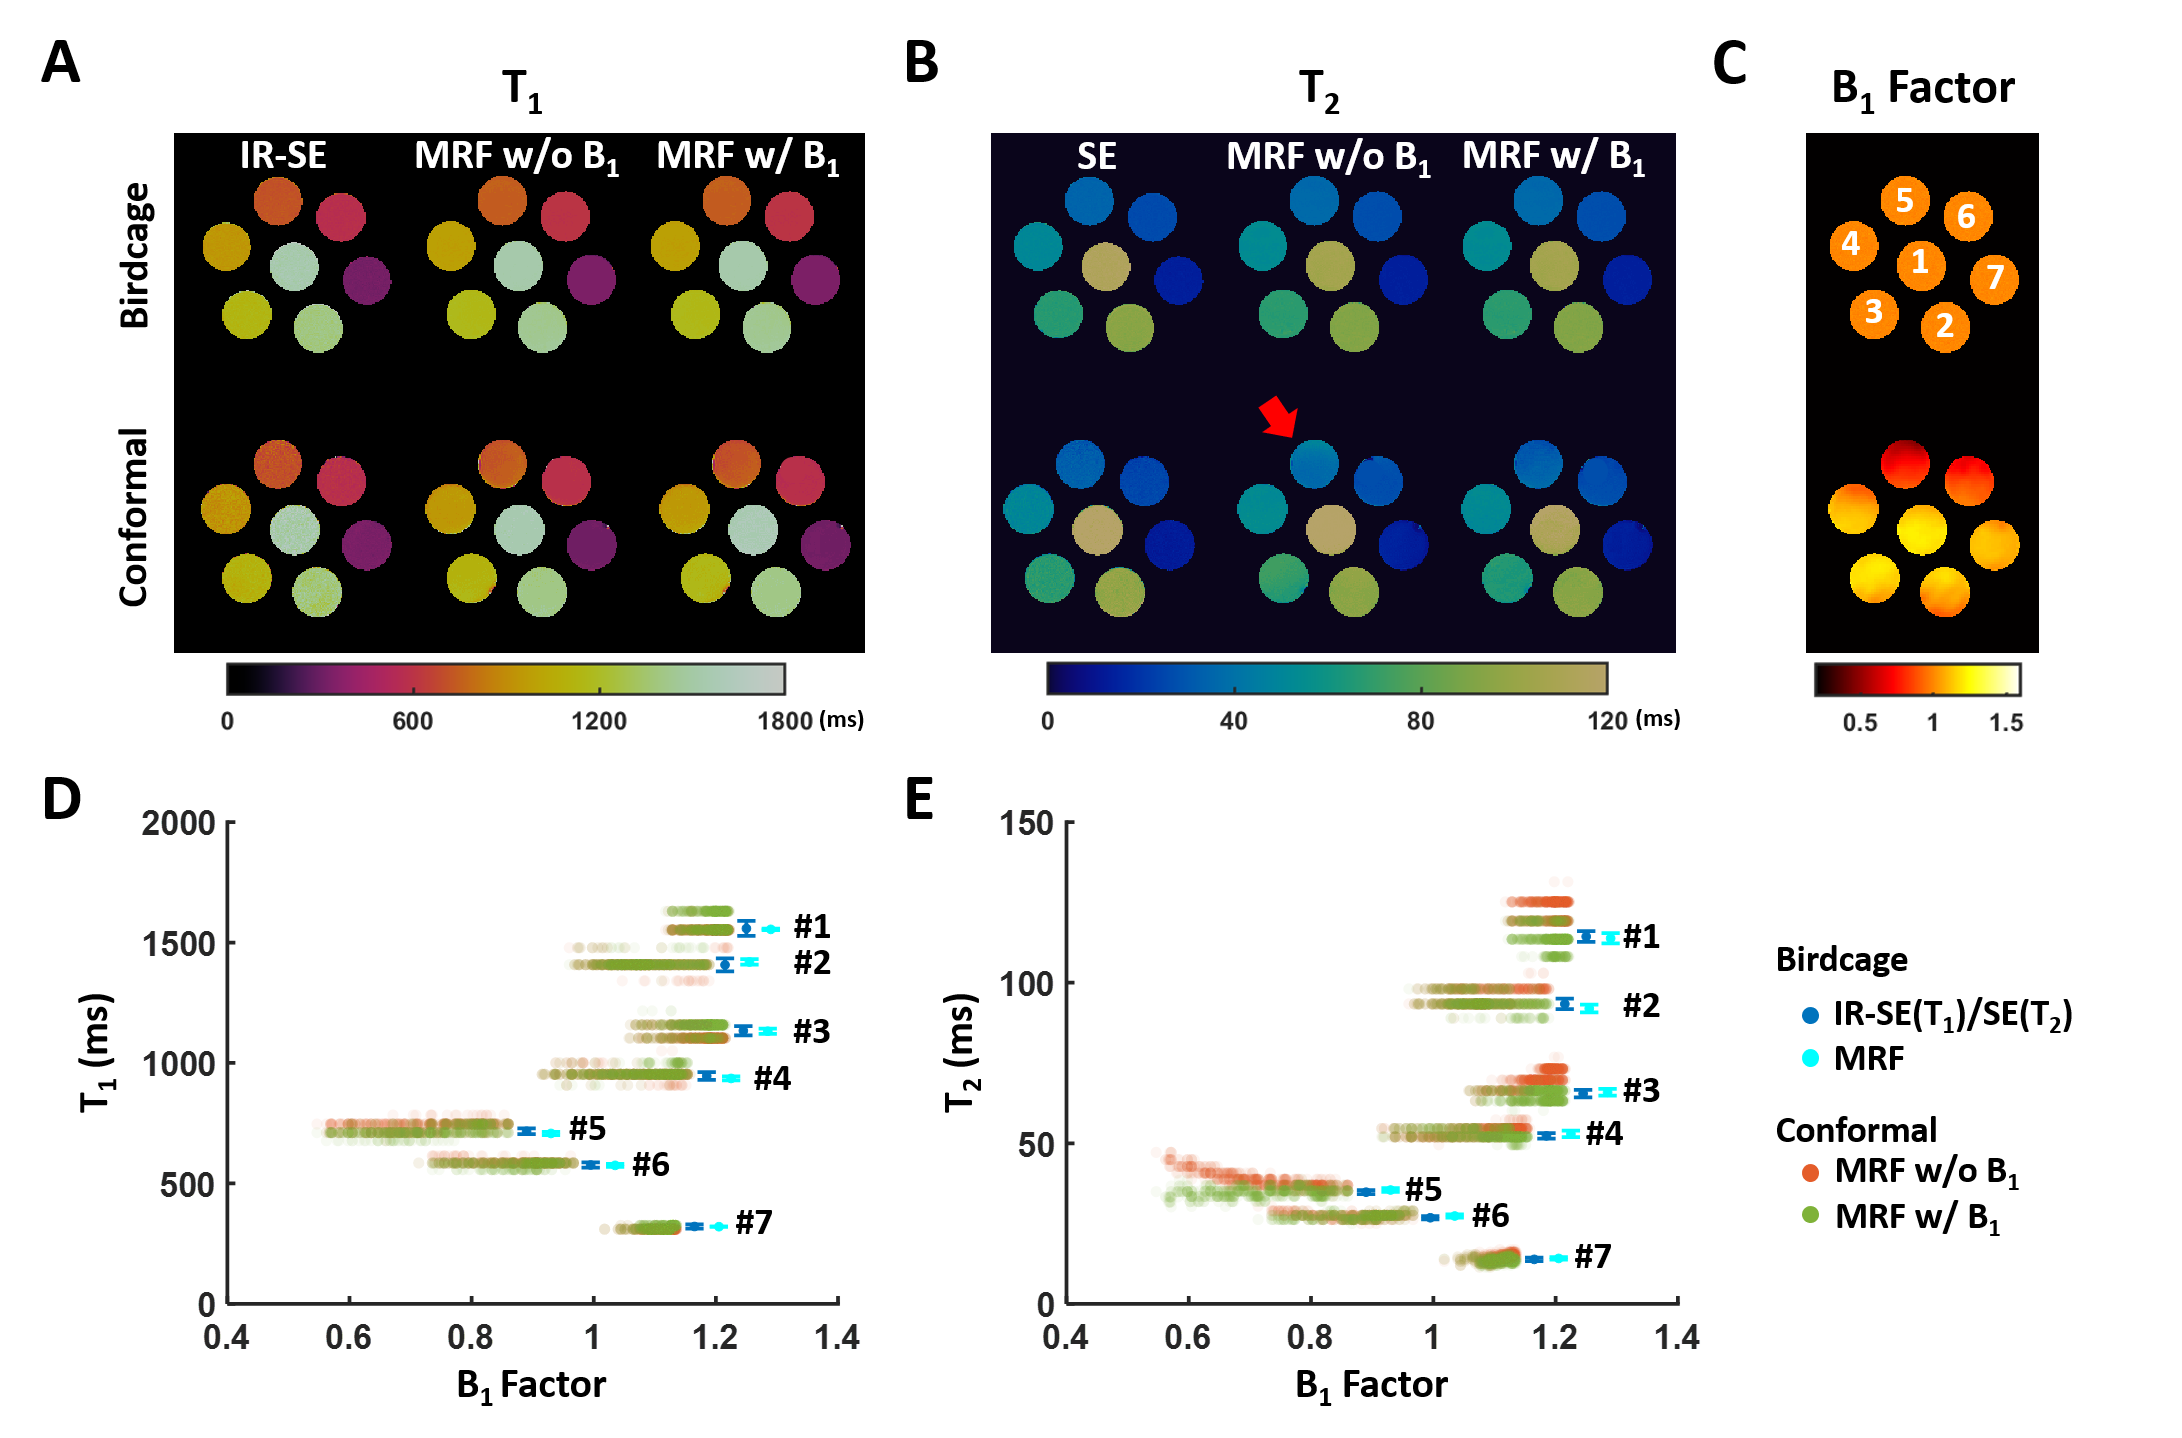
Phantom Validation: All MRI studies were performed on a Bruker 9.4-T scanner. The MRF method was evaluated on a 7-compartment phantom with MnCl2 concentration varied from 40 to 400 μM. The accuracy of T1 and T2 mapping was first evaluated using an 80-mm birdcage coil without the cofounding B1 inhomogeneity. The efficacy of B1 correction was then assessed using a custom-built 100-mm conformal head coil. A fully sampled dataset with an FOV of 90x90x8 mm3 and a matrix size of 256x256x8 was acquired in ~4.3 hours. B1 maps were acquired using the double-angle method with 45° and 90° FA, respectively.5 T1 and T2 maps acquired using the inversion recovery spin-echo (IR-SE) and spin-echo (SE) method, respectively, were used as the gold-standard for comparison.
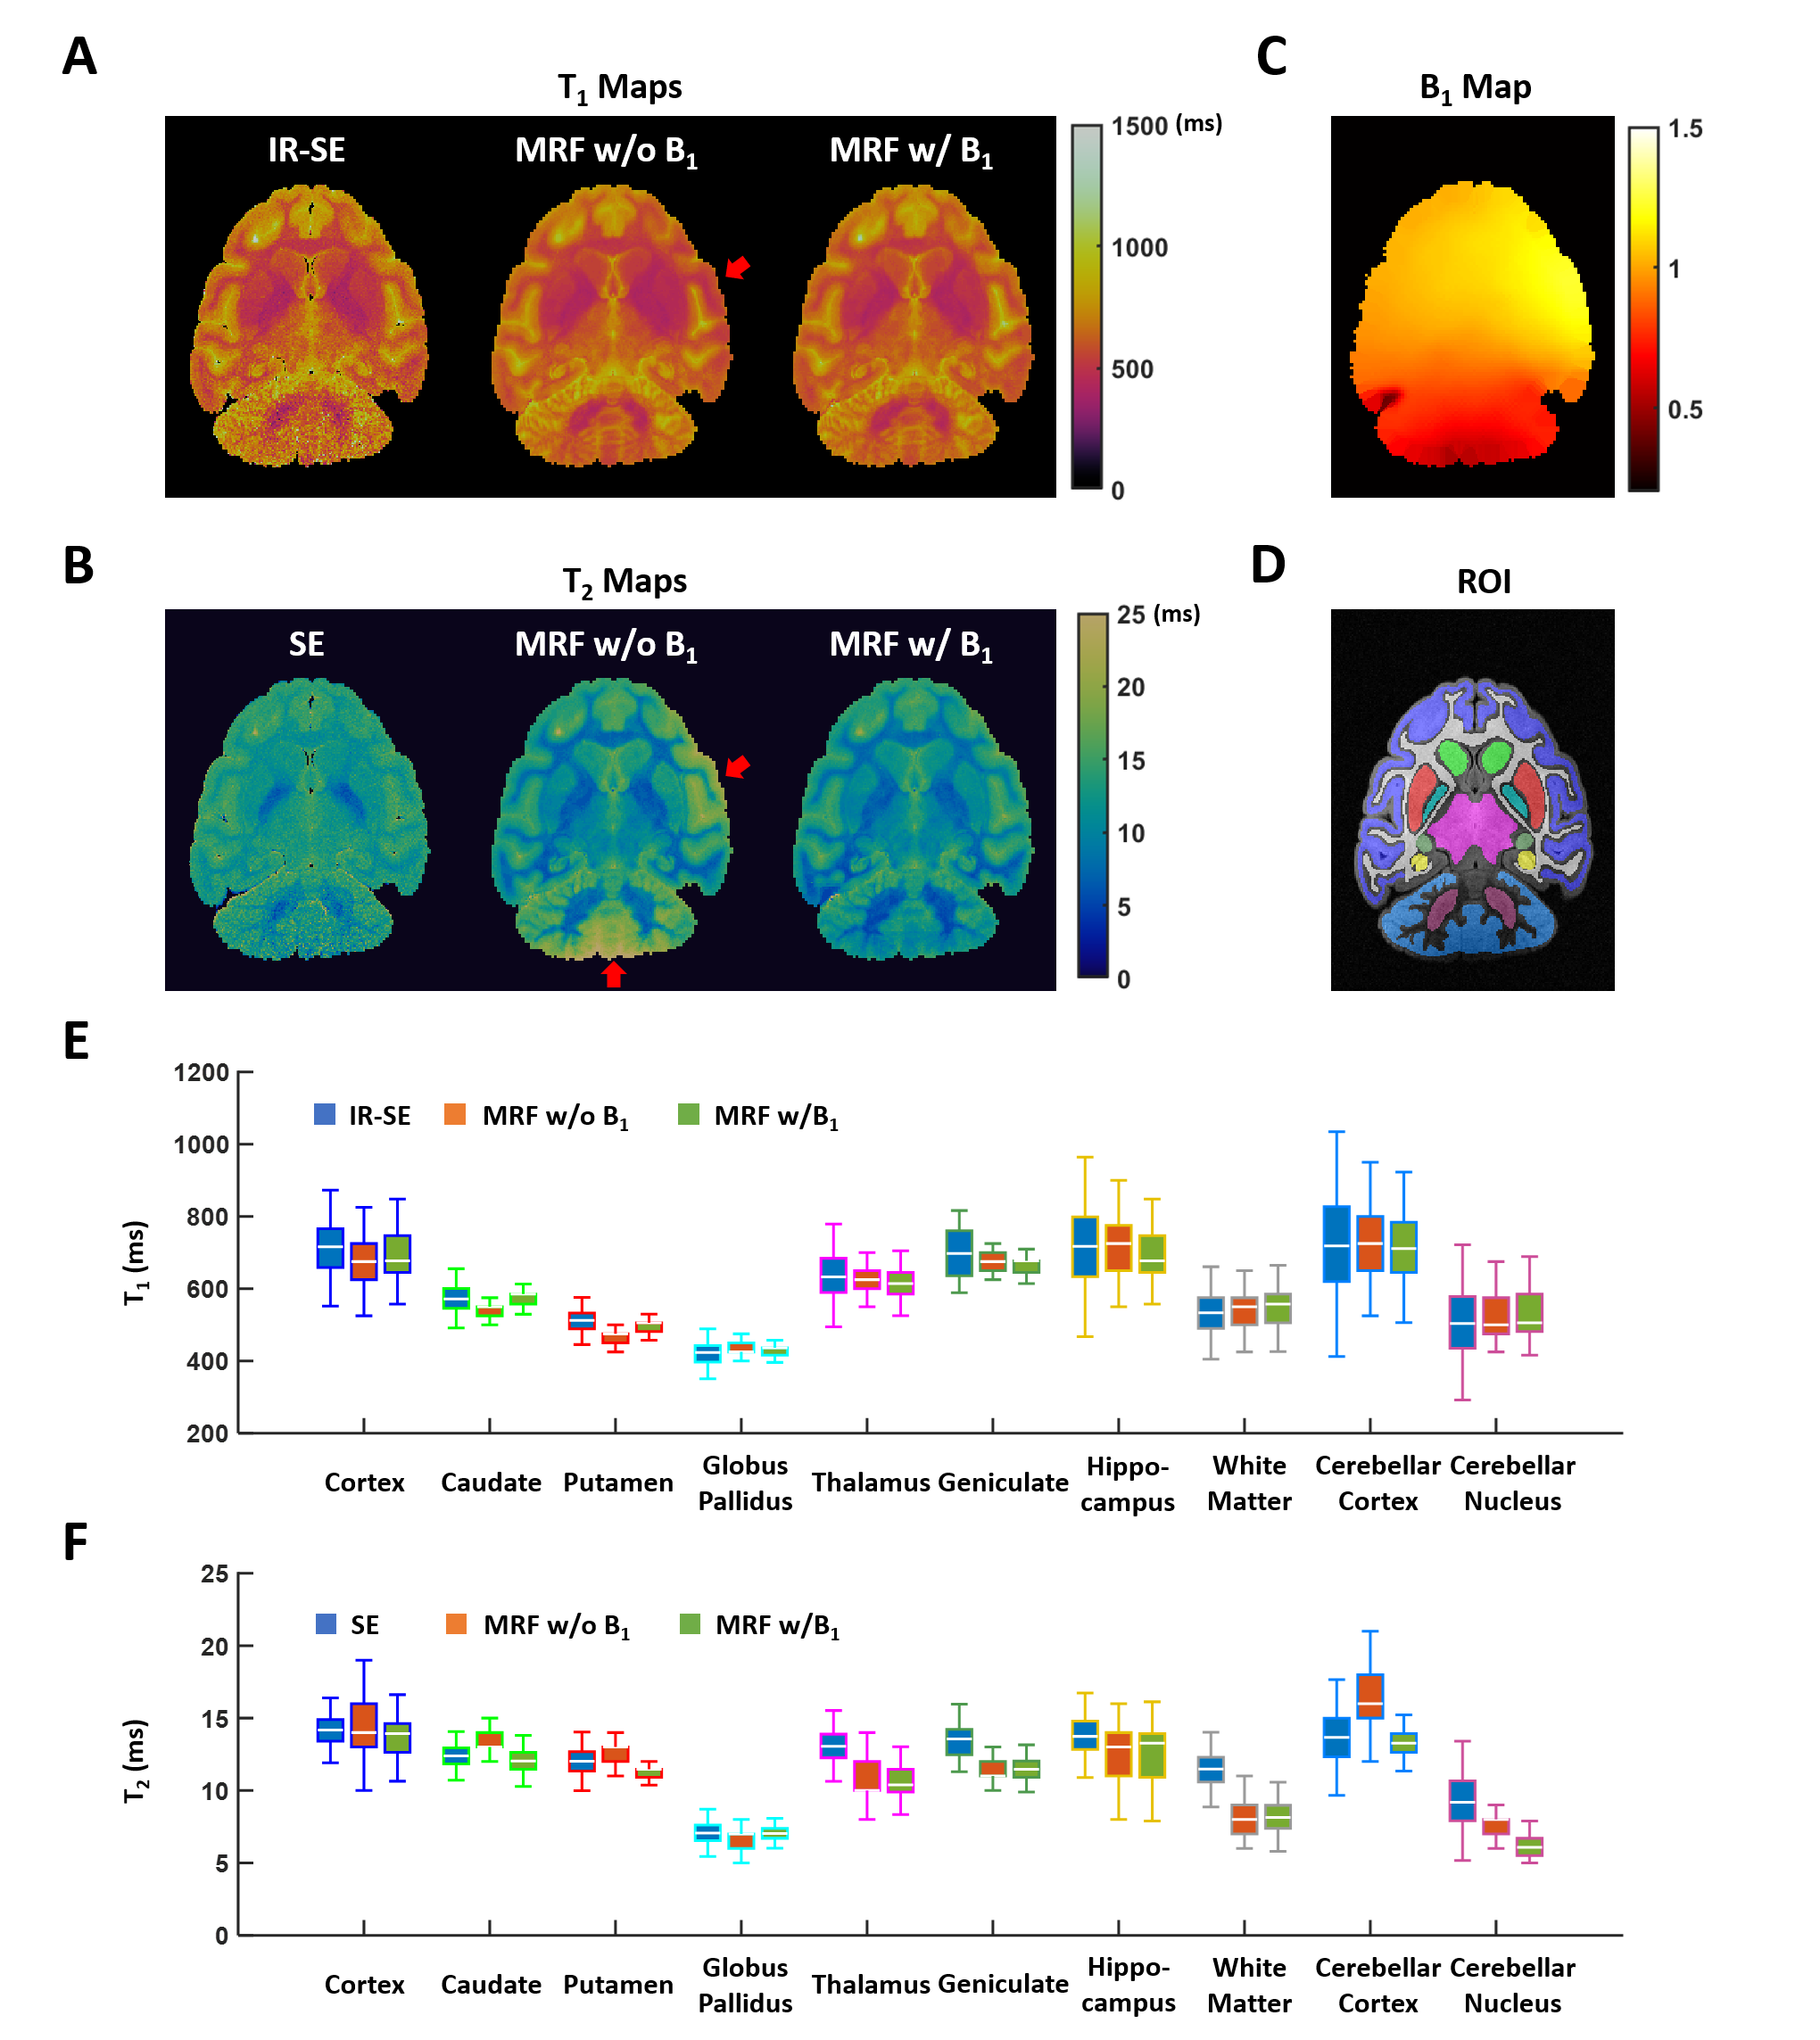
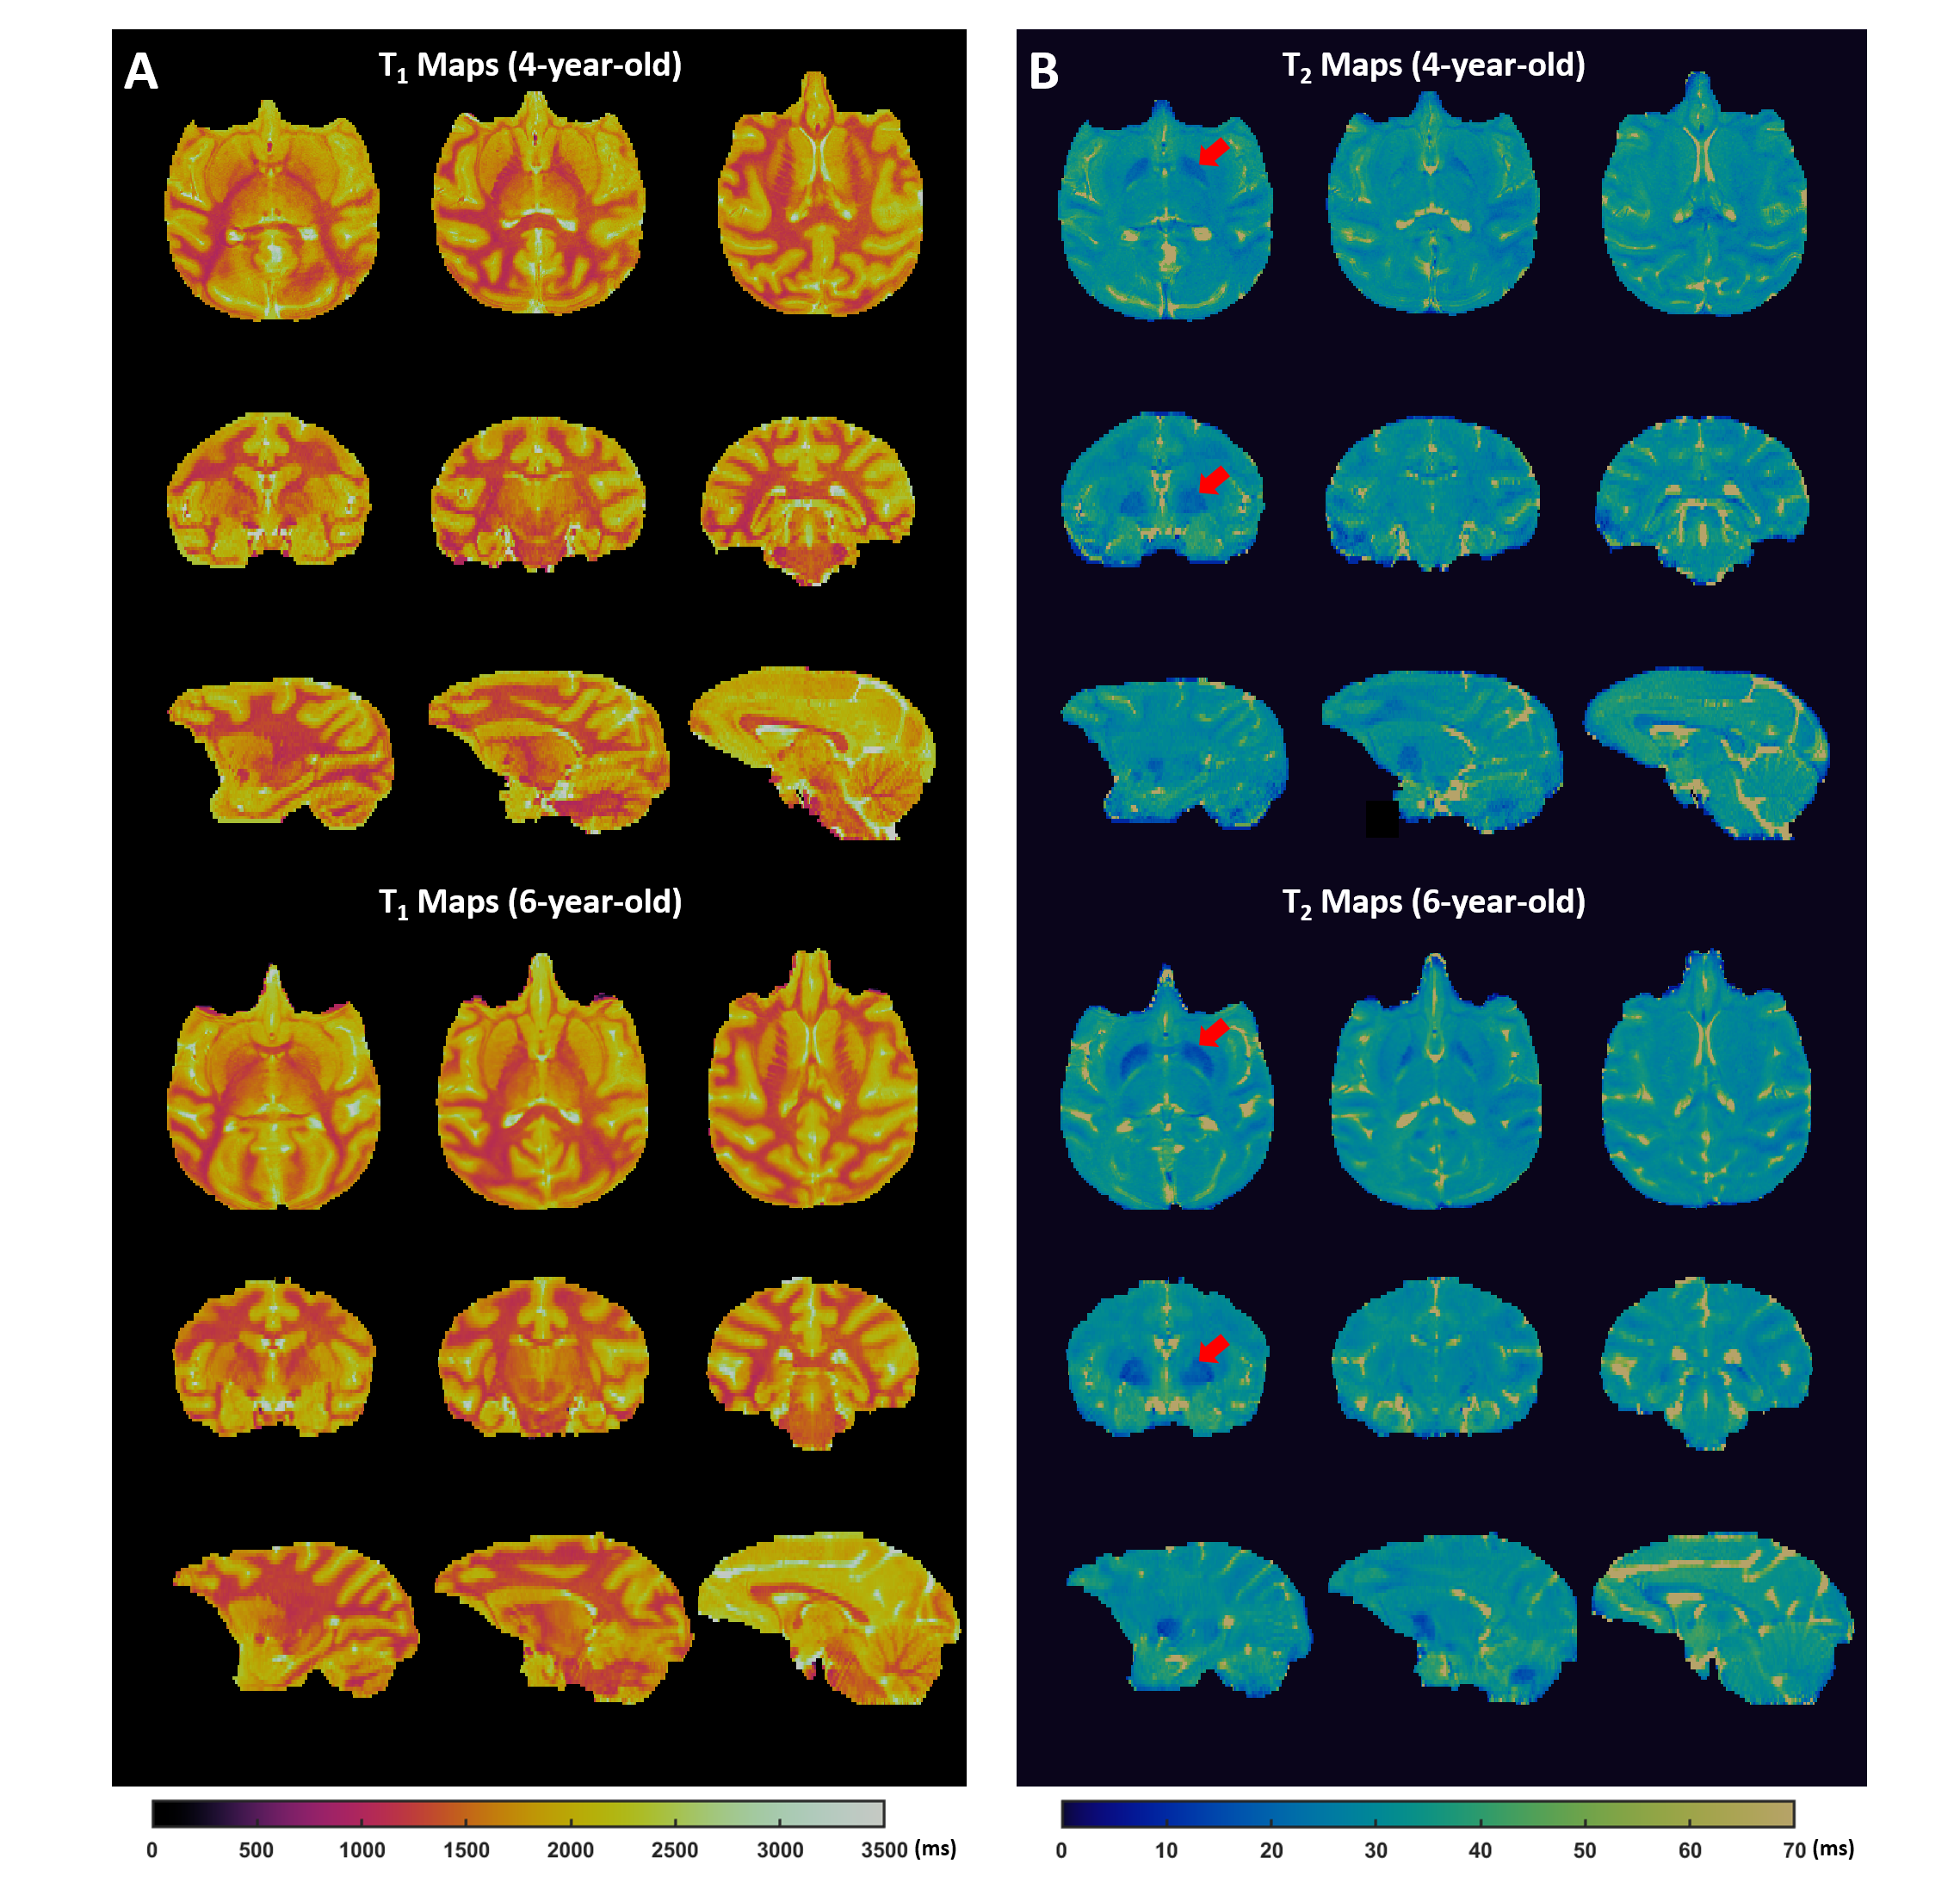
Ex Vivo and In Vivo Studies: MRI studies were performed ex vivo on an excised monkey brain, and in vivo on four female macaques with 4 and 6 years of age (N = 2/age group). 3D MRF data were acquired using the conformal coil with an FOV of 90x90x80 mm3 and a matrix size of 256x256x80, leading to a spatial resolution of 0.35x0.35x1 mm3. Total acquisition was ~1.4 hours with an acceleration factor of 24 (12 in-plane and 2 through-plane).1 B1 maps were acquired in 0.4 hours. IR-SE and SE scans were also acquired from ex vivo brain.
Results
Phantom Results: Fig. 2 shows the comparison of T1 and T2 mapping using the conformal and birdcage coil. While T1 mapping showed insensitivity to B1 inhomogeneity, T2 overestimation (>5%) occurred when there was a >15% deviation in B1 from its nominal value. Applying B1 correction in dictionary matching can effectively reduce the T2 overestimation.Ex Vivo Results: T1 maps by MRF and IR-SE showed less than 5% difference in all selected ROIs (Fig. 3). Consistent with the phantom results, T2 overestimation was evident in regions with significant B1 inhomogeneity (cerebellum and right cortex) if no B1 correction was applied. T2 maps by MRF after B1 correction showed good agreement with SE in most structures of gray matter. However, there was ~20% underestimation in regions with short T2 such as in the white matter and cerebellar nucleus, which might be related to the long mixing time used in T2 preparation modules.
In Vivo Results: T1 and T2 of selected ROIs in ex vivo and in vivo monkey brains are summarized in Table 1. Both T1 and T2 measured in vivo are longer than that measured ex vivo. In vivo T1 was in the range of 1200 to 2000 ms in the brain and ~3500 ms in the CSF. T2 varied between 20 and 40 ms in the brain and was ~215 ms in the CSF. Comparing T1 and T2 values in the two age groups, there was ~20% T2 reduction in the area of globus pallidus in 6-year-old monkeys (Fig. 4).
Discussion and Conclusion
The current study presents the first in vivo whole-brain T1 and T2 mapping of monkey at high spatial resolution. The high SNR provided by the conformal coil, in combination with B1 correction, enabled accurate T1 and T2 mapping with 24-fold acceleration. The reduced T2 in globus pallidus at older age is in agreement with a previous human study, possibly related to increased iron deposition.6 Further acceleration can be achieved by sequence optimization.Acknowledgements
This work was supported by a grant from the National Institute of Health (R01 EB23704).References
1. Ma D, Jiang Y, Chen Y, McGivney D, Mehta B, Gulani V, Griswold M. Fast 3D magnetic resonance fingerprinting for a whole-brain coverage. Magn Reson Med. 2018;79:2190–2197.
2. Liao C, Bilgic B, Manhard MK, Zhao B, Cao X, Zhong J, Wald LL, Setsompop K. 3D MR fingerprinting with accelerated stack-of-spirals and hybrid sliding-window and GRAPPA reconstruction. Neuroimage. 2017;162:13–22.
3. Nezafat R, Stuber M, Ouwerkerk R, Gharib AM, Desai MY, Pettigrew RI. B1-Insensitive T2 Preparation for Improved Coronary Magnetic Resonance Angiography at 3 T. 2006;864:858–864.
4. Hamilton JI, Jiang Y, Chen Y, Ma D, Lo W-C, Griswold M, Seiberlich N. MR fingerprinting for rapid quantification of myocardial T1, T2, and proton spin density. Magn Reson Med. 2017;77:1446–1458.
5. Stollberger R, Wach P. Imaging of the active B1 field in vivo. Magn Reson Med. 1996;35:245–251.
6. Schenker C, Meier D, Wichmann W, Boesiger P, Valavanis A. Age distribution and iron dependency of the T2 relaxation time in the globus pallidus and putamen. Neuroradiology. 1993;35:119–124.
Figures