2565
Reproducibility evaluation on resolving complex fiber orientations using diffusion spectrum imaging at 3T and 7T
Nan-Hao Chen1,2, Kuan-Hung Cho2, Yi-Ping Chao3,4, Sheng-Min Huang2, Norihiro Sadato5, Li-Wei Kuo2,6, and Masaki Fukunaga5
1Biomedical engineering and Environmental sciences, National Tsing Hua University, Hsinchu, Taiwan, 2Institute of Biomedical Engineering and Nanomedicine, National Health Research Institutes, Miaoli, Taiwan, 3Department of Computer Science and Information Engineering, Chang Gung University, Taoyuan, Taiwan, 4Graduate Institute of Biomedical Engineering, Chang Gung University, Taoyuan, Taiwan, 5Division of Cerebral Integration, Department of System Neuroscience, National Institute for Physiological Sciences, Okazaki, Japan, 6Institute of Medical Device and Imaging, National Taiwan University College of Medicine, Taipei, Taiwan
1Biomedical engineering and Environmental sciences, National Tsing Hua University, Hsinchu, Taiwan, 2Institute of Biomedical Engineering and Nanomedicine, National Health Research Institutes, Miaoli, Taiwan, 3Department of Computer Science and Information Engineering, Chang Gung University, Taoyuan, Taiwan, 4Graduate Institute of Biomedical Engineering, Chang Gung University, Taoyuan, Taiwan, 5Division of Cerebral Integration, Department of System Neuroscience, National Institute for Physiological Sciences, Okazaki, Japan, 6Institute of Medical Device and Imaging, National Taiwan University College of Medicine, Taipei, Taiwan
Synopsis
Diffusion spectrum imaging (DSI) is a model-free diffusion MRI technique capable of resolving complex fiber orientations. The capability of DSI at different field strengths and spatial resolutions remains unexplored. This study aimed to investigate the reproducibility of DSI quantified by orientational similarity and deviation angle at 3T and 7T. Our results show that DSI reproducibility at 3T and 7T for single-fiber group are comparable, whereas DSI at 7T could provide relatively better reproducibility than that at 3T for crossing-fiber group. The comparison of spatial resolutions for crossing-fiber group suggests that partial volume effect may be less dominant than signal-to-noise ratio.
Introduction
Diffusion spectrum imaging (DSI) is a model-free diffusion MRI technique capable of resolving complex fiber orientations [1]. Previously, the DSI protocol within clinically acceptable scan time has been established and optimized on 3T MRI [2]. Furthermore, a comparative diffusion tensor imaging (DTI) study has demonstrated that higher field strength is advantageous for DTI by assessing effects of SNR on DTI quantitative metrics [3]. However, the capability of DSI at different field strength and spatial resolution remains unexplored. In this study, we aimed to investigate the effects of magnetic field strength and spatial resolution on the reproducibility of DSI. A multi-site and repeated DSI study have been conducted at 3T and 7T. The reproducibility has been quantified by orientation distribution function (ODF) and deviation angle, and further evaluated by statistical comparisons.Materials & Methods
The overall workflow of this study is shown in figure 1. A total of 8 healthy subjects were recruited in this study. MR experiments were performed on a 7T MRI system (5 subjects; Magnetom 7T, Siemens Healthineers, Erlangen, Germany) and a 3T MRI system (3 subjects; Prisma 3T, Siemens Healthineers, Erlangen Germany). For each subject, the MR experiments were performed twice to obtain two DSI datasets (scan#1 and scan#2). DSI data was acquired by using the diffusion-weighted spin-echo EPI sequence. A DSI protocol with 203 grid sampling points and maximum b-value of 4500 s/mm2 was used within clinically acceptable scan time. We acquired three different voxel sizes (2.5 mm, 2.0 mm, and 1.5 mm isotropic resolution) on both systems. The FOV (mm) / matrix size / slice number are 240 / 96 / 36 for 2.5-mm resolution, 216 / 108 / 46 for 2.0-mm resolution, and 216 / 144 / 60 for 1.5-mm resolution. The TR and TE were optimized by using the parallel imaging (GRAPPA) on both systems. On 7T, TR/TE (ms) are 4400/91 for 2.5 mm, 5800/92 for 2.0 mm, and 7700/94 for 1.5 mm. On 3T, they are 5500/59 for 2.5 mm, 7800/60 for 2.0 mm, and 10800/61 for 1.5 mm. All diffusion-weighted images (DWIs) were pre-processed using FSL (https://fsl.fmrib.ox.ac.uk/fsl/fslwiki), including eddy current distortion and motion correction, co-registration and normalization of T1-weighted images (T1WIs) onto MNI space. DSI reconstruction was performed on DSI Studio to obtain the voxel-wise ODF, major fiber orientations (the first five in our case), and fractional anisotropy along the maximum ODF (FAODFMAX) (http://dsi-studio.labsolver.org/). The white matter (WM) region was segmented by T1WIs and a FAODFMAX threshold (0.3 in our case). All voxels within the WM region were divided into two groups, i.e. single-fiber and crossing-fiber, based on the ratio of lengths of second ODF and the maximum ODF (0.4 in our case). Two quantitative metrics, i.e. orientational similarity (SIM) and deviation angle (AngleDev) for assessing the reproducibility in both fiber groups were calculated.Results
Figure 2 shows the maps of major fiber orientations of DSI among different spatial resolutions and field strengths. For each field strength, the enlarged views in fiber-crossing regions show that the reconstructed fiber orientations are visually consistent between two scans in each spatial resolution. Compared with lower spatial resolution, higher spatial resolution reveals more details of intra-voxel fiber orientations. Figure 3 shows the voxel-wise SIM map and plot of averaged SIM among different spatial resolutions and field strengths. Generally, SIM of single-fiber groups (0.9 – 0.95) are consistently higher than SIM of crossing-fiber groups (0.65 – 0.8). In single-fiber group, there are no obvious differences of SIM between different spatial resolutions and field strengths. In crossing-fiber group, SIM tends to increase as the voxel size becomes larger for both field strengths. By comparing 3T and 7T, higher field strength yields relatively higher SIM among all spatial resolutions. Figure 4 shows the voxel-wise AngleDev map and plot of averaged AngleDev among different spatial resolutions and field strengths. Generally, AngleDev of single-fiber groups (5 – 10 degrees) are consistently lower than AngleDev of crossing-fiber groups (20 – 35 degrees). Similar as SIM results, in single-fiber group, there are no obvious differences of AngleDev between different spatial resolutions and field strengths. In crossing-fiber group, AngleDev tends to decrease as the voxel size becomes larger for both field strengths. By comparing 3T and 7T, higher field strength yields relatively lower AngleDev among all spatial resolutions except 1.5 mm.Discussion and Conclusion
To our best knowledge, this is the first study to quantitatively investigate the effects of field strengths and spatial resolutions on DSI reproducibility. Our results show that DSI at 3T and 7T for single-fiber group are comparable, whereas DSI at 7T could provide relatively better reproducibility than that at 3T for crossing-fiber group. Among different spatial resolutions, no differences of reproducibility have been found in single-fiber group. However, our results of SIM and AngleDev for crossing-fiber group show that larger voxel size has incrementally better reproducibility than smaller voxel size, suggesting that partial volume effect may be less dominant than signal-to-noise ratio (SNR). A future work to control the SNR by manipulating the sequence parameters is needed to further understand the effects of partial volume and SNR on DSI reproducibility and their associations with field strengths and spatial resolutions.Acknowledgements
This work was supported by the grants from the Ministry of Science and Technology (MOST-109-2221-E-400-001-MY2), the National Health Research Institutes (NHRI-BN-109-PP-06 and NHRI-BN-109-SP-11), and the Japan Society for the Promotion of Science (19K22985).References
- Van J. Wedeen, Patric Hagmann, Wen-Yih Isaac Tseng, Timothy G. Reese, and Robert M. Weisskoff, Mapping complex tissue architecture with diffusion spectrum magnetic resonance imaging. Magnetic Resonance in Medicine 54 (2005) 1377–1386.
- Li-Wei Kuo, Jyh-Horng Chen, Van Jay Wedeen, and Wen-Yih Isaac Tseng, Optimization of diffusion spectrum imaging and q-ball imaging on clinical MRI system. NeuroImage 41 (2008) 7–18.
- Seongjin Choi, Dustin T. Cunningham, Francisco Aguila, John D. Corrigan, Jennifer Bogner, W. Jerry Mysiw, Michael V. Knopp, and Petra Schmalbrock, DTI at 7 and 3 T: systematic comparison of SNR and its influence on quantitative metrics. Magnetic Resonance Imaging 29 (2011) 739-751.
Figures
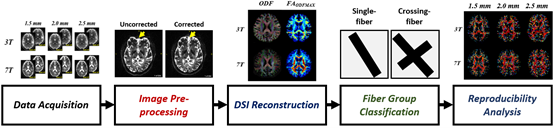
The
overall workflow of this study, including data acquisition, image
pre-processing, DSI reconstruction, fiber group classification, and
reproducibility analysis.
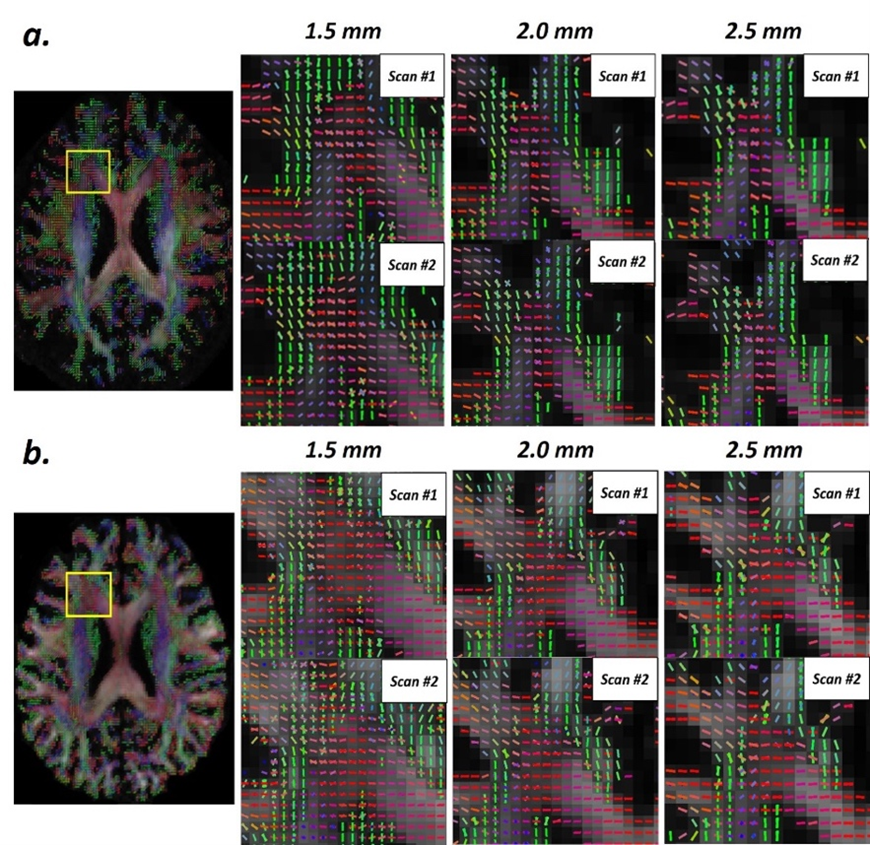
The enlarged maps of major fiber orientations of
DSI in crossing-fiber regions. (a) 7T results and (b) 3T results.
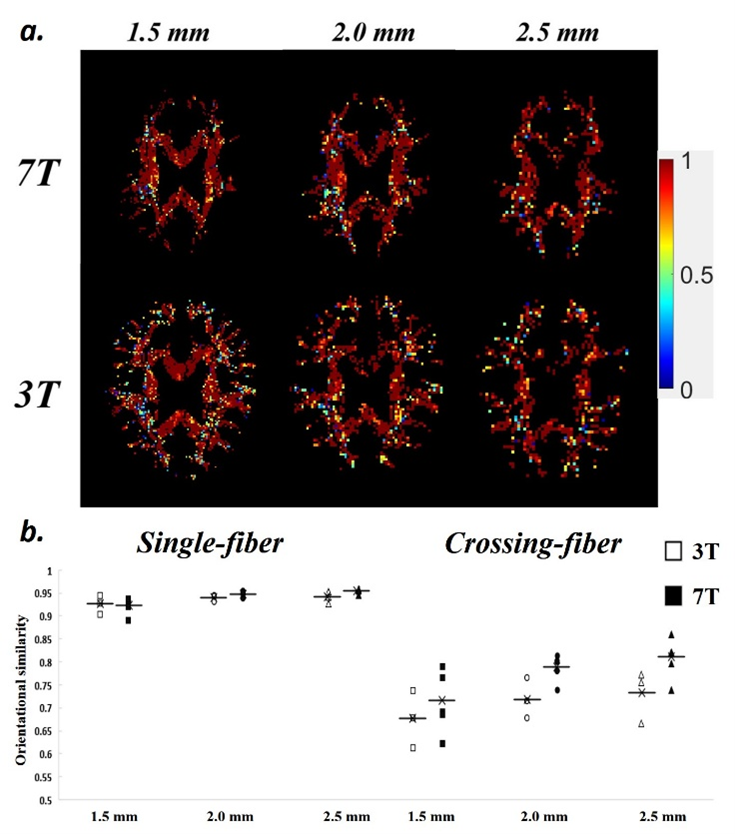
(a) Orientational similarity (SIM) maps of different
voxel sizes and field strengths. (b) Averaged SIM of single-fiber and
crossing-fiber groups.
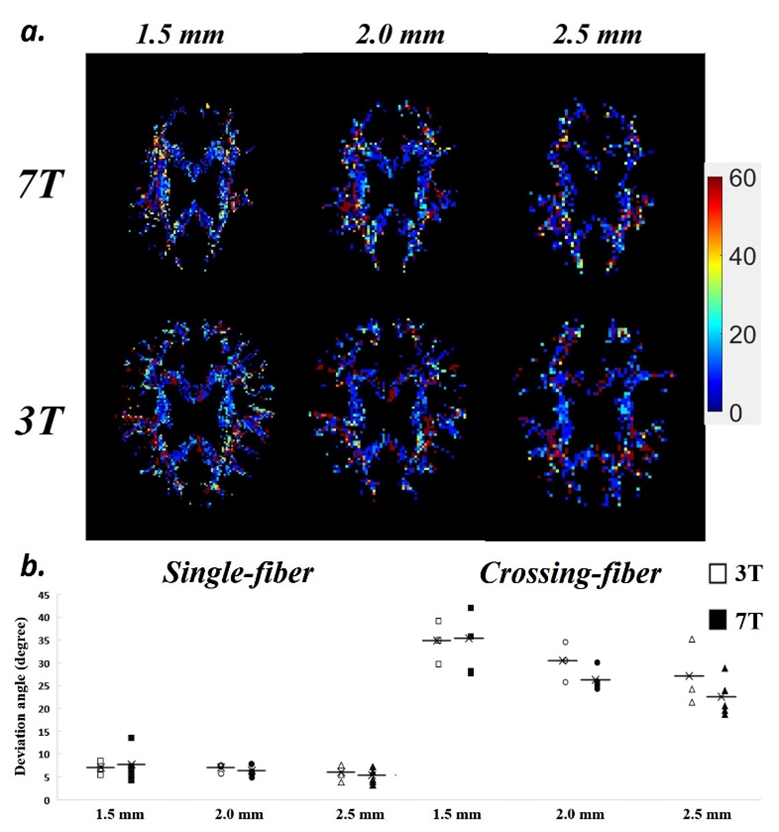
(a) Deviation angle (AngleDev) maps of
different voxel sizes and field strengths. (b) Averaged AngleDev of single-fiber
and crossing-fiber groups.