2562
High Resolution DTI Tractographic Analysis in a Mouse Model of Pruritis
Talaignair N Venkatraman1, Ouyang Chen2, Allen W Song3, Ru-Rong Ji2, and Christopher D Lascola1
1Radiology, Duke University Medical Center, Durham, NC, United States, 2Neurobiology, Duke University Medical Center, Durham, NC, United States, 3BIAC, Duke University Medical Center, Durham, NC, United States
1Radiology, Duke University Medical Center, Durham, NC, United States, 2Neurobiology, Duke University Medical Center, Durham, NC, United States, 3BIAC, Duke University Medical Center, Durham, NC, United States
Synopsis
A high resolution tractographic ROI analysis was carried out on ex vivo brain in mice with cutaneous T-cell lymphoma (CTCL), a mouse model of chronic pruritis. Our results show statistically significant differences between CTCL and control mice in DTI markers of fiber tract integrity and fiber number primarily involving the thalamus and hippocampus.
Introduction:
Pathological itch (pruritis) is a common condition associated with many dermatological, systemic, and neurological diseases that, in chronic form, results in immense suffering. Mechanisms of itch appear to overlap generally with those of pain, centrally integrating peripheral sensory inputs by way of spinal pathways, and recruiting central mechanisms critical to learning and memory. Recent reports, however, now reveal a multitude of chemical and neural processes unique to itch. We’ve undertaken a high resolution tractographic ROI analysis of intact ex vivo brain in mice with cutaneous T-cell lymphoma (CTCL), a mouse model of chronic pruritis. Our results show statistically significant differences between CTCL and control mice in DTI markers of fiber tract integrity and fiber number primarily involving the thalamus and hippocampus, CNS subregions critical to sensory processing and memory, respectively.Materials and Methods:
Total Mice n=9 (Control = 6, CTCL = 3). CTCL and control brains were perfused and harvested at 50 days of age and stored in fixative solution of 0.5% ProHance-doped formalin. Image Acquisition: Brains in Fomblin solution were scanned on a Bruker 7.0T system with quadrature volume-transmit and surface-receive coils. MRI protocol: (A) 3D T1-weighted FLASH sequence with FOV = 1.8 x 1.8 x 1.8 cm; matrix = 256 x 256 x 256; resolution = 70 x 70 x 70 μm/pixel; TE/TR = 6/30 ms; averages = 16; flip-angle = 34; scan time = 6 hrs 33 mins; (B) High resolution spin-echo based 3D DTI with FOV = 1.8 x 1.8 x 1.8 cm; matrix = 128 x 128 x 128; resolution = 141 x 141 x 141 μm/pixel; TE/TR = 25/250 ms; diffusion directions = 60; Ao images = 5; B-value per direction = 1500 S/mm2.Post-Processing: Brains were registered to a reference template from Wake forest University’s Mouse Database and segmented using ITK-SNAP. DTI parameters were calculated using TrackVis.Results:
Figure 1 shows changes in Fiber Tract numbers (FTN) and Fractional Anisotropy (FA) of Thalamus and Hippocampus without parcellation. Both parameters show statistically significant increases in CTCL mice as compared to control. Figure 2 show FTN and FA changes after parcellation. Among these parcellations Fiber Tract Numbers (FTN) of Hippocampus - Thalamus (Figure 2B) and Thalamus--Caudate-Putamen (Figure 2C) are significantly increased. Thalamus (Figure 3) shows significant changes in DTI metrics among all the regions studied. We observe in both left (Figure 3A) and right (figure 3B) hemispheres an increase in Fractional Anisotropy (FA) and normalized Axial Diffusivity (nAD), as well as a decrease in normalized Radial Diffusivity (nRD).Conclusions:
In a CTCL mouse model of chronic pruritis, we show a statistically significant increase in fiber tract number and other DTI markers of tract integrity through the thalamus and hippocampus, providing microanatomical support for the central role of these CNS subregions in the pathophysiology of itch. In particular, these results provide evidence that chronic itch, like pain, involves significant ‘hardwire’ changes in the neural circuitry essential to sensory processing (thalamus) and learning and memory (hippocampus).Acknowledgements
No acknowledgement found.References
No reference found.Figures
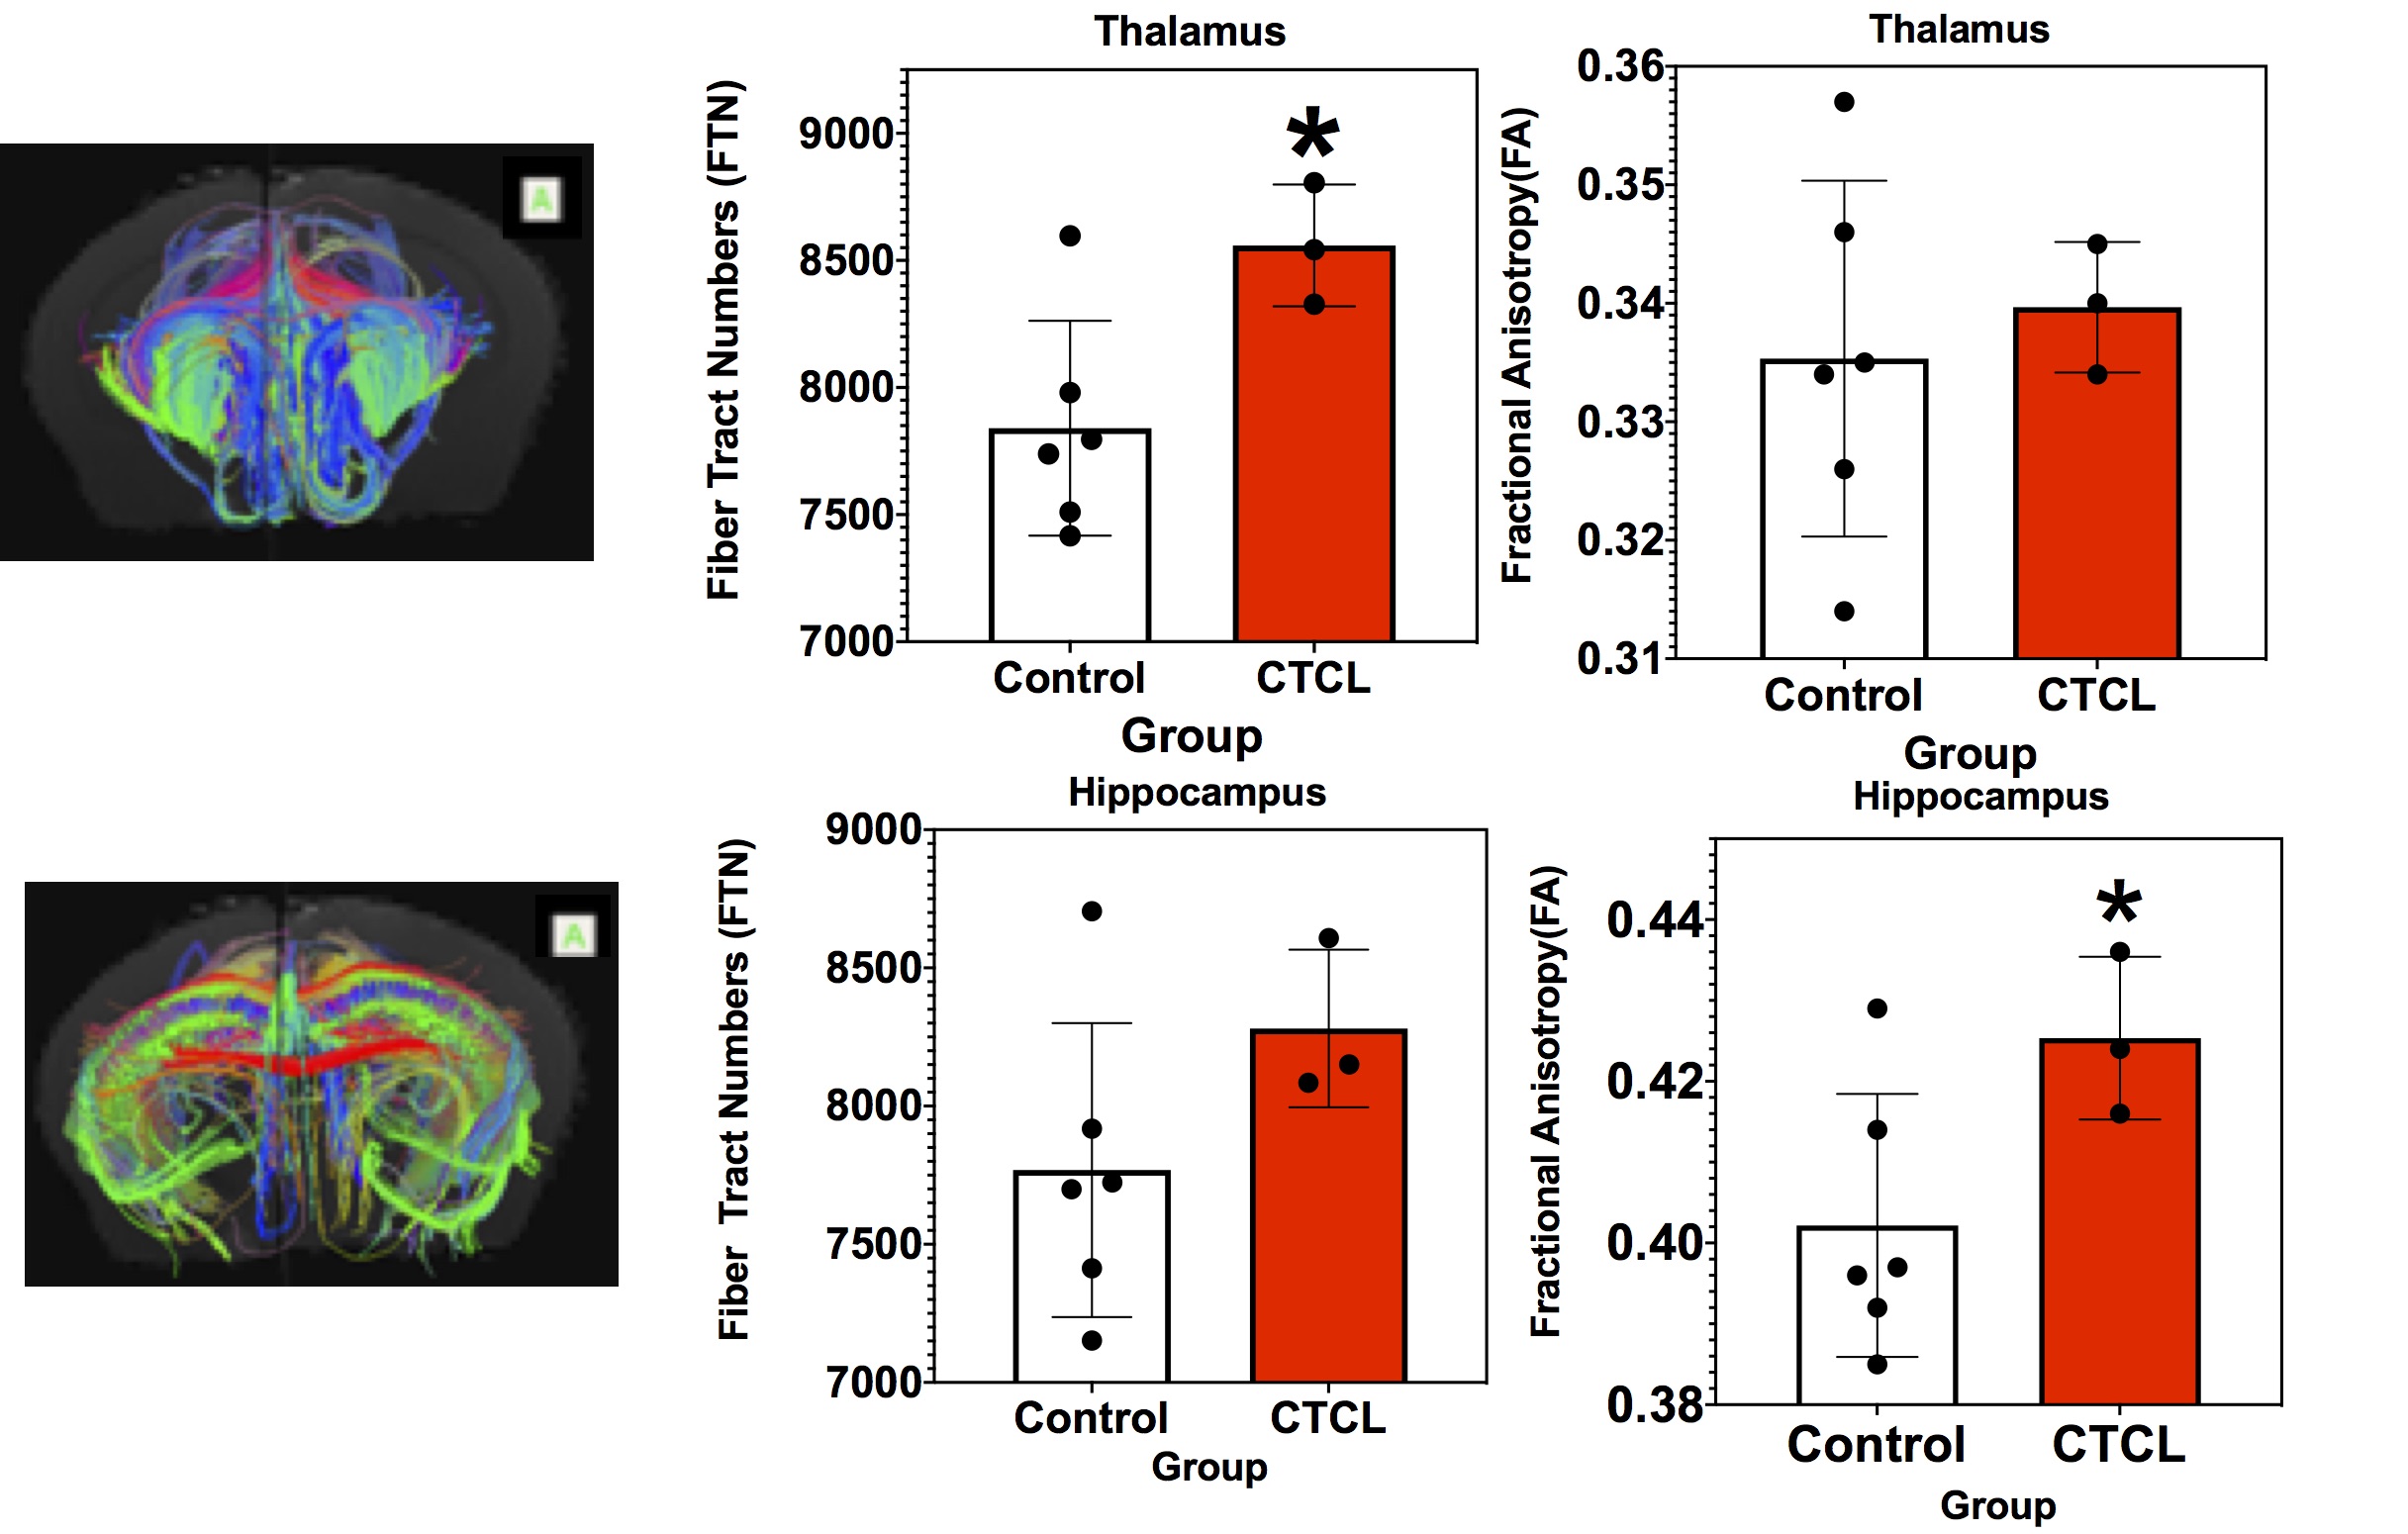
Figure 1: The fiber Tracts pass through Thalamus (Top Row) and Hippocampus (Bottom Row) without parcellation. Fiber Tract Numbers (FTN) and corresponding Fractional Anisotropy (FA) with Control and CTCL groups are also shown. t-test * p0.05.
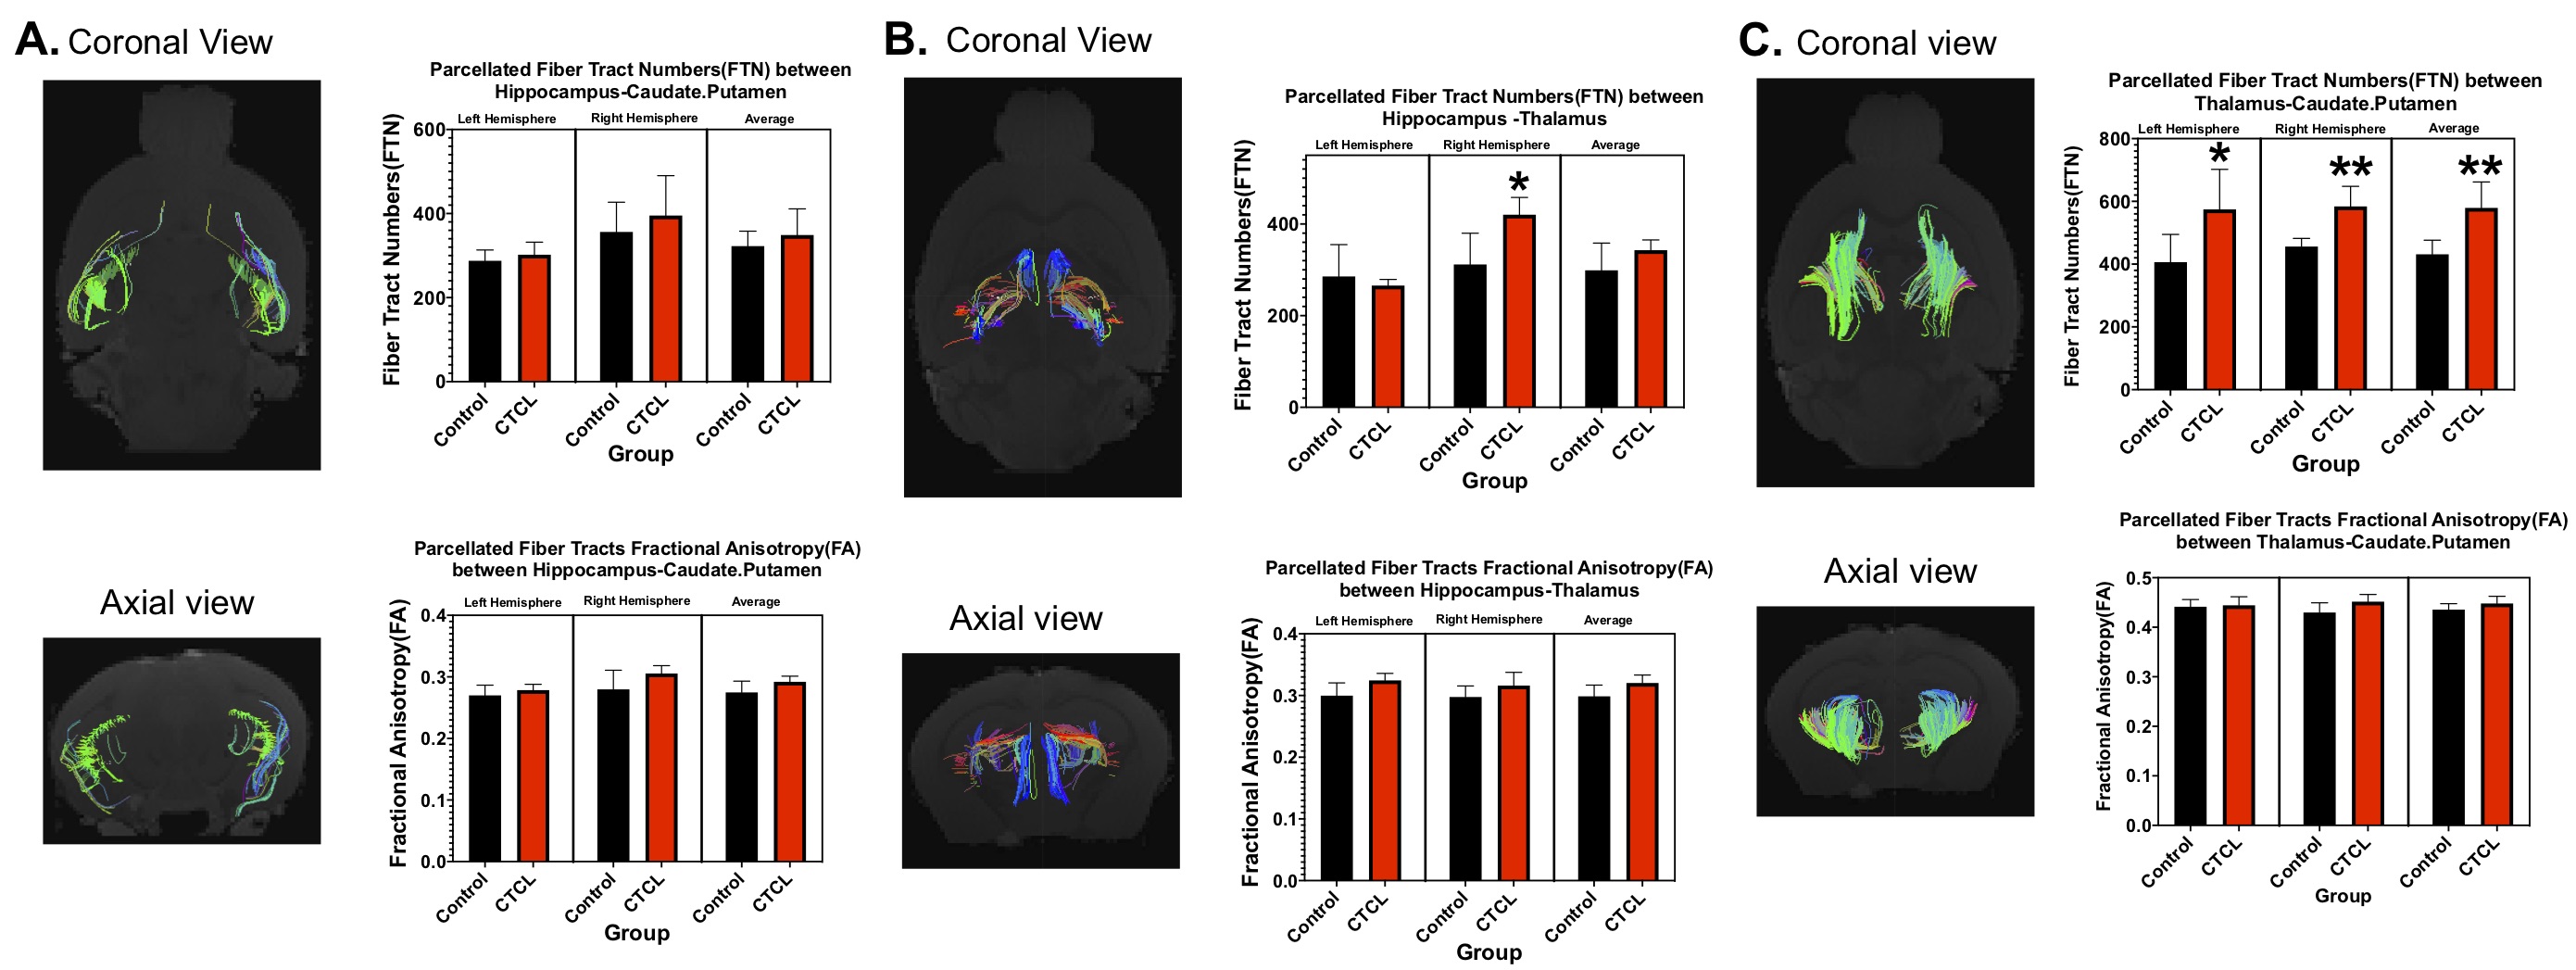
Figure 2: After Parcellation, Fiber Tract Numbers (FTN) and Fractional Anisotropy (FA) for (A) Hippocampus-Caudate.Putamen, (B) Hippocampus-Thalamus and (C) Thalamus-Caudate-Putamen are shown. t-test * p 0.05 and ** p 0.01.
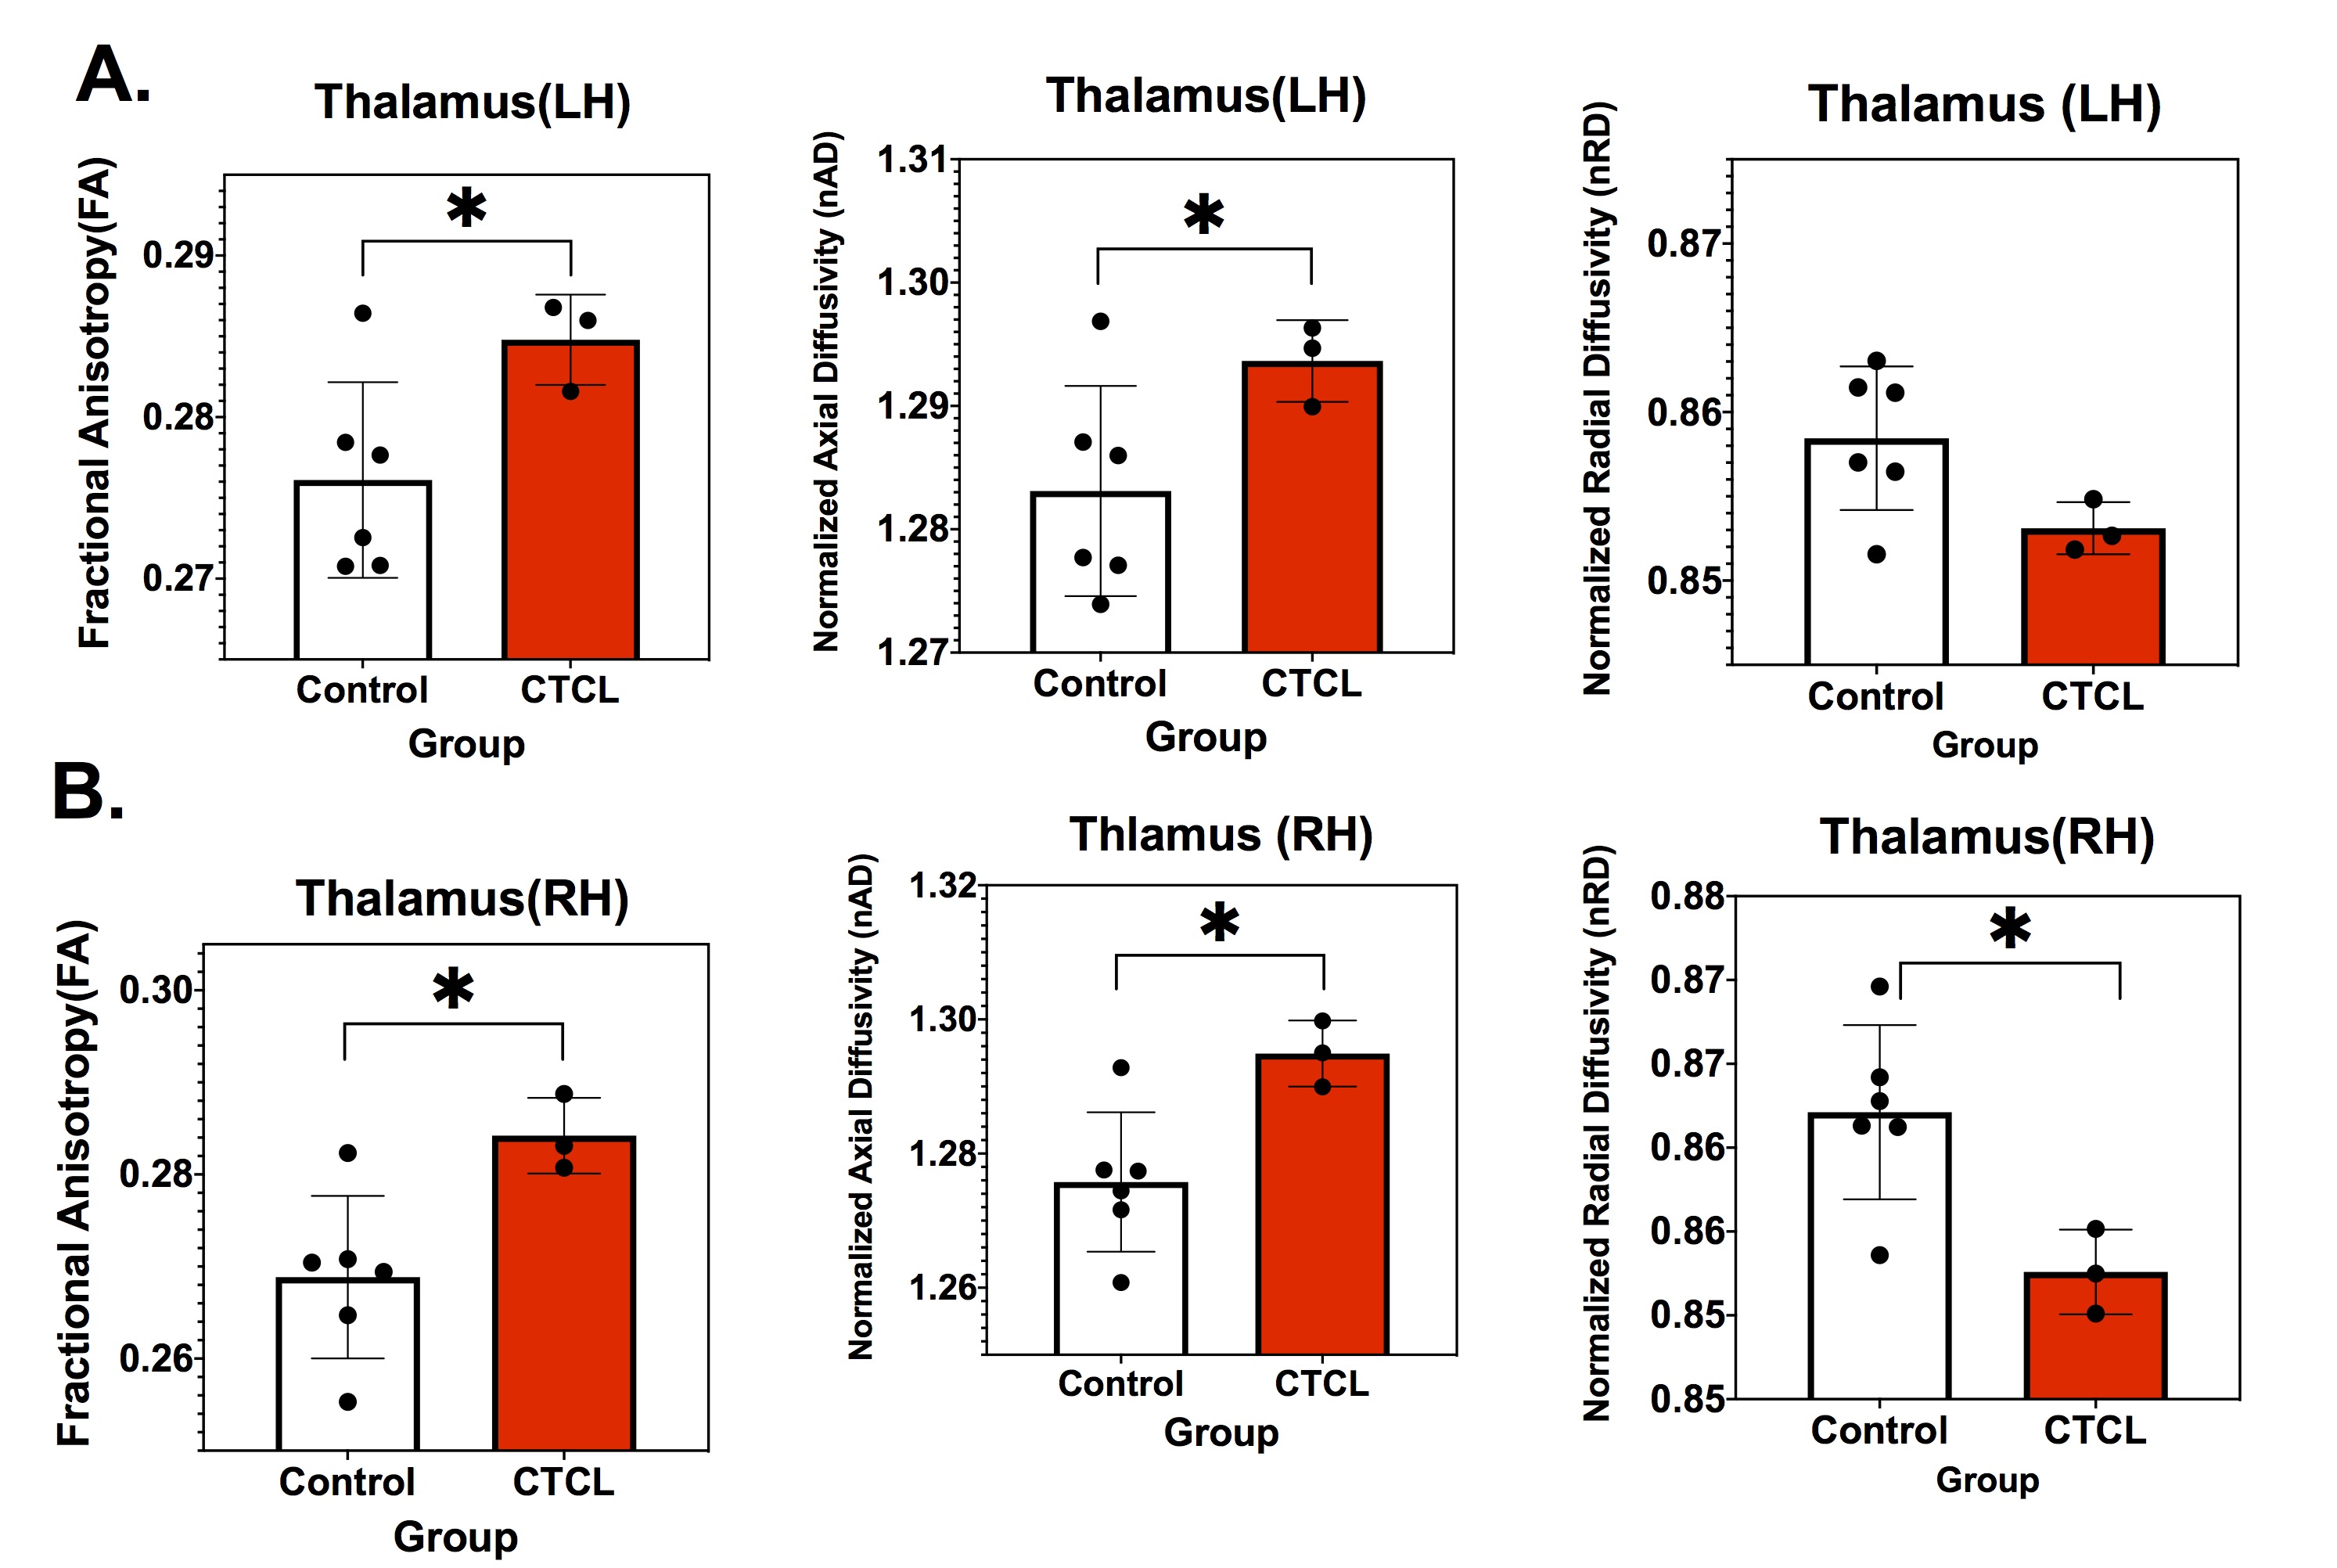
Figure 3: DTI Metrics of Thalamus using ROI analysis on both (A) Left (LH) and (B) Right (RH) hemispheres. Significant increase of Fractional Anisotropy (FA) and Normalized Axial Diffusivity(nAD) and decrease of Normalized Radial Diffusivity (nRD) noted * p 0.05.