2561
Brain connectivity impairments revealed by DTI and resting-state fMRI in a mouse model of Huntington’s disease1Université Paris-Saclay, Commissariat à l’Energie Atomique et aux Energies Alternatives (CEA), Centre National de la Recherche Scientifique (CNRS), Molecular Imaging Research Center (MIRCen), Laboratoire des Maladies Neurodégénératives, Fontenay-aux-Roses, France
Synopsis
Huntington’s Disease (HD) is a neurodegenerative disorder caused by the expansion of CAG repeats on the exon 1 of the HTT gene. Atrophy of the striatum is currently the main biomarker of the disease’s progression, but there is a need to find earlier and more functional biomarkers. Here, we evaluated Diffusion Tensor Imaging (DTI) and resting-state fMRI (rs-fMRI) as biomarkers in heterozygous zQ175 mice, a model mimicking the presymptomatic phase of HD. Our protocol allowed detection of vulnerable brain networks that would be of great interest for better understanding of the pathogenesis in clinical HD.
Purpose
Huntington’s Disease (HD) is a neurodegenerative disorder caused by the expansion of CAG repeats on the exon 1 of the HTT gene1. The mutation causes progressive neurodegeneration with vulnerability of the striatum. Atrophy of this structure is currently the main biomarker of the disease2 but there is a need to find more functional biomarkers to better understand disease’s progression. To this end, animal models of HD are valuable tools to study specific pathways of the disease.In the present study, we used the zQ175 mouse model3 characterized by the progressive appearance of the symptoms, which mimics the early phase of pathology in human gene carriers. Thanks to Diffusion Tensor Imaging (DTI) and resting-state functional MRI (rs-fMRI), we highlighted specific brain networks involved in the disease pathogenesis that could be used as relevant and early biomarkers of HD.
Material & Methods
Mouse model: Knock-in mice expressing mouse/human exon 1 containing 175 CAG repeats inserted in the murine huntingtin (Htt) gene were used3. Heterozygous mice for the Htt gene (zQ175, n=4 males and 3 females) were compared to their relative age-matched littermates (WT, n=4 males and 5 females).MRI protocol: 12-months-old animals were scanned on a horizontal 11.7T Bruker magnet using a Cryoprobe. The MRI protocol was composed by an anatomical (TSE sequence, 100 slices, 0.1 x 0.1 mm², 0.2 mm slice thickness), DTI (EPI, 10 slices, 0.1125 x 0.1125 mm², 0.5 mm slice thickness, b-value=1000 s/mm², 30 directions) and rs-fMRI sequences (TE/TR=10/1000 ms, 0.2 x 0.2 mm2, 0.7 mm slice thickness, 12 slices, 450 repetitions). Anesthesia protocol included induction with 3.5% isoflurane followed by medetomidine bolus (0.1 µL/g) and perfusion (0.1 µL/g/h) combined with 0.5% isoflurane.
Image Analysis: Images were co-registered and automatically segmented using an atlas composed of a high-resolution template based on Allen mouse brain atlas4. The registration pipeline used an in-house python library (Sammba-MRI5). DTI images were analyzed using the Tract-Based Spatial Statistics (TBSS6) pipeline (FSL7). Rs-fMRI data was analyzed with Nilearn8 using Dictionary Learning (DL, 10 components, smoothing=0.4 mm).
Statistical analysis: After Shapiro-Wilk normality test, one-way ANOVA with repeated measures was used for statistical analysis and was followed by Fisher LSD post-hoc test.
Results
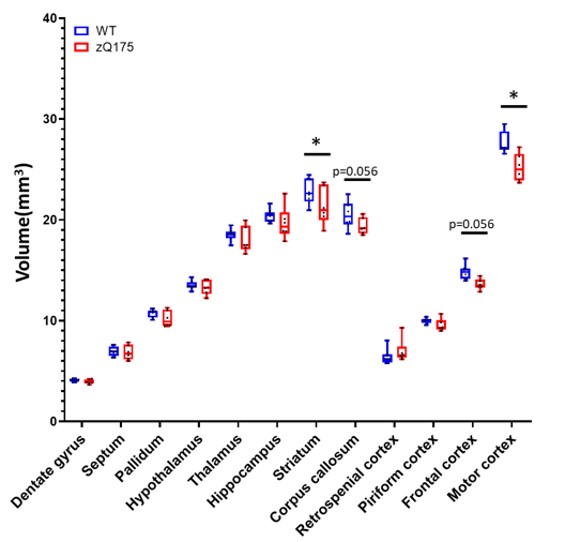
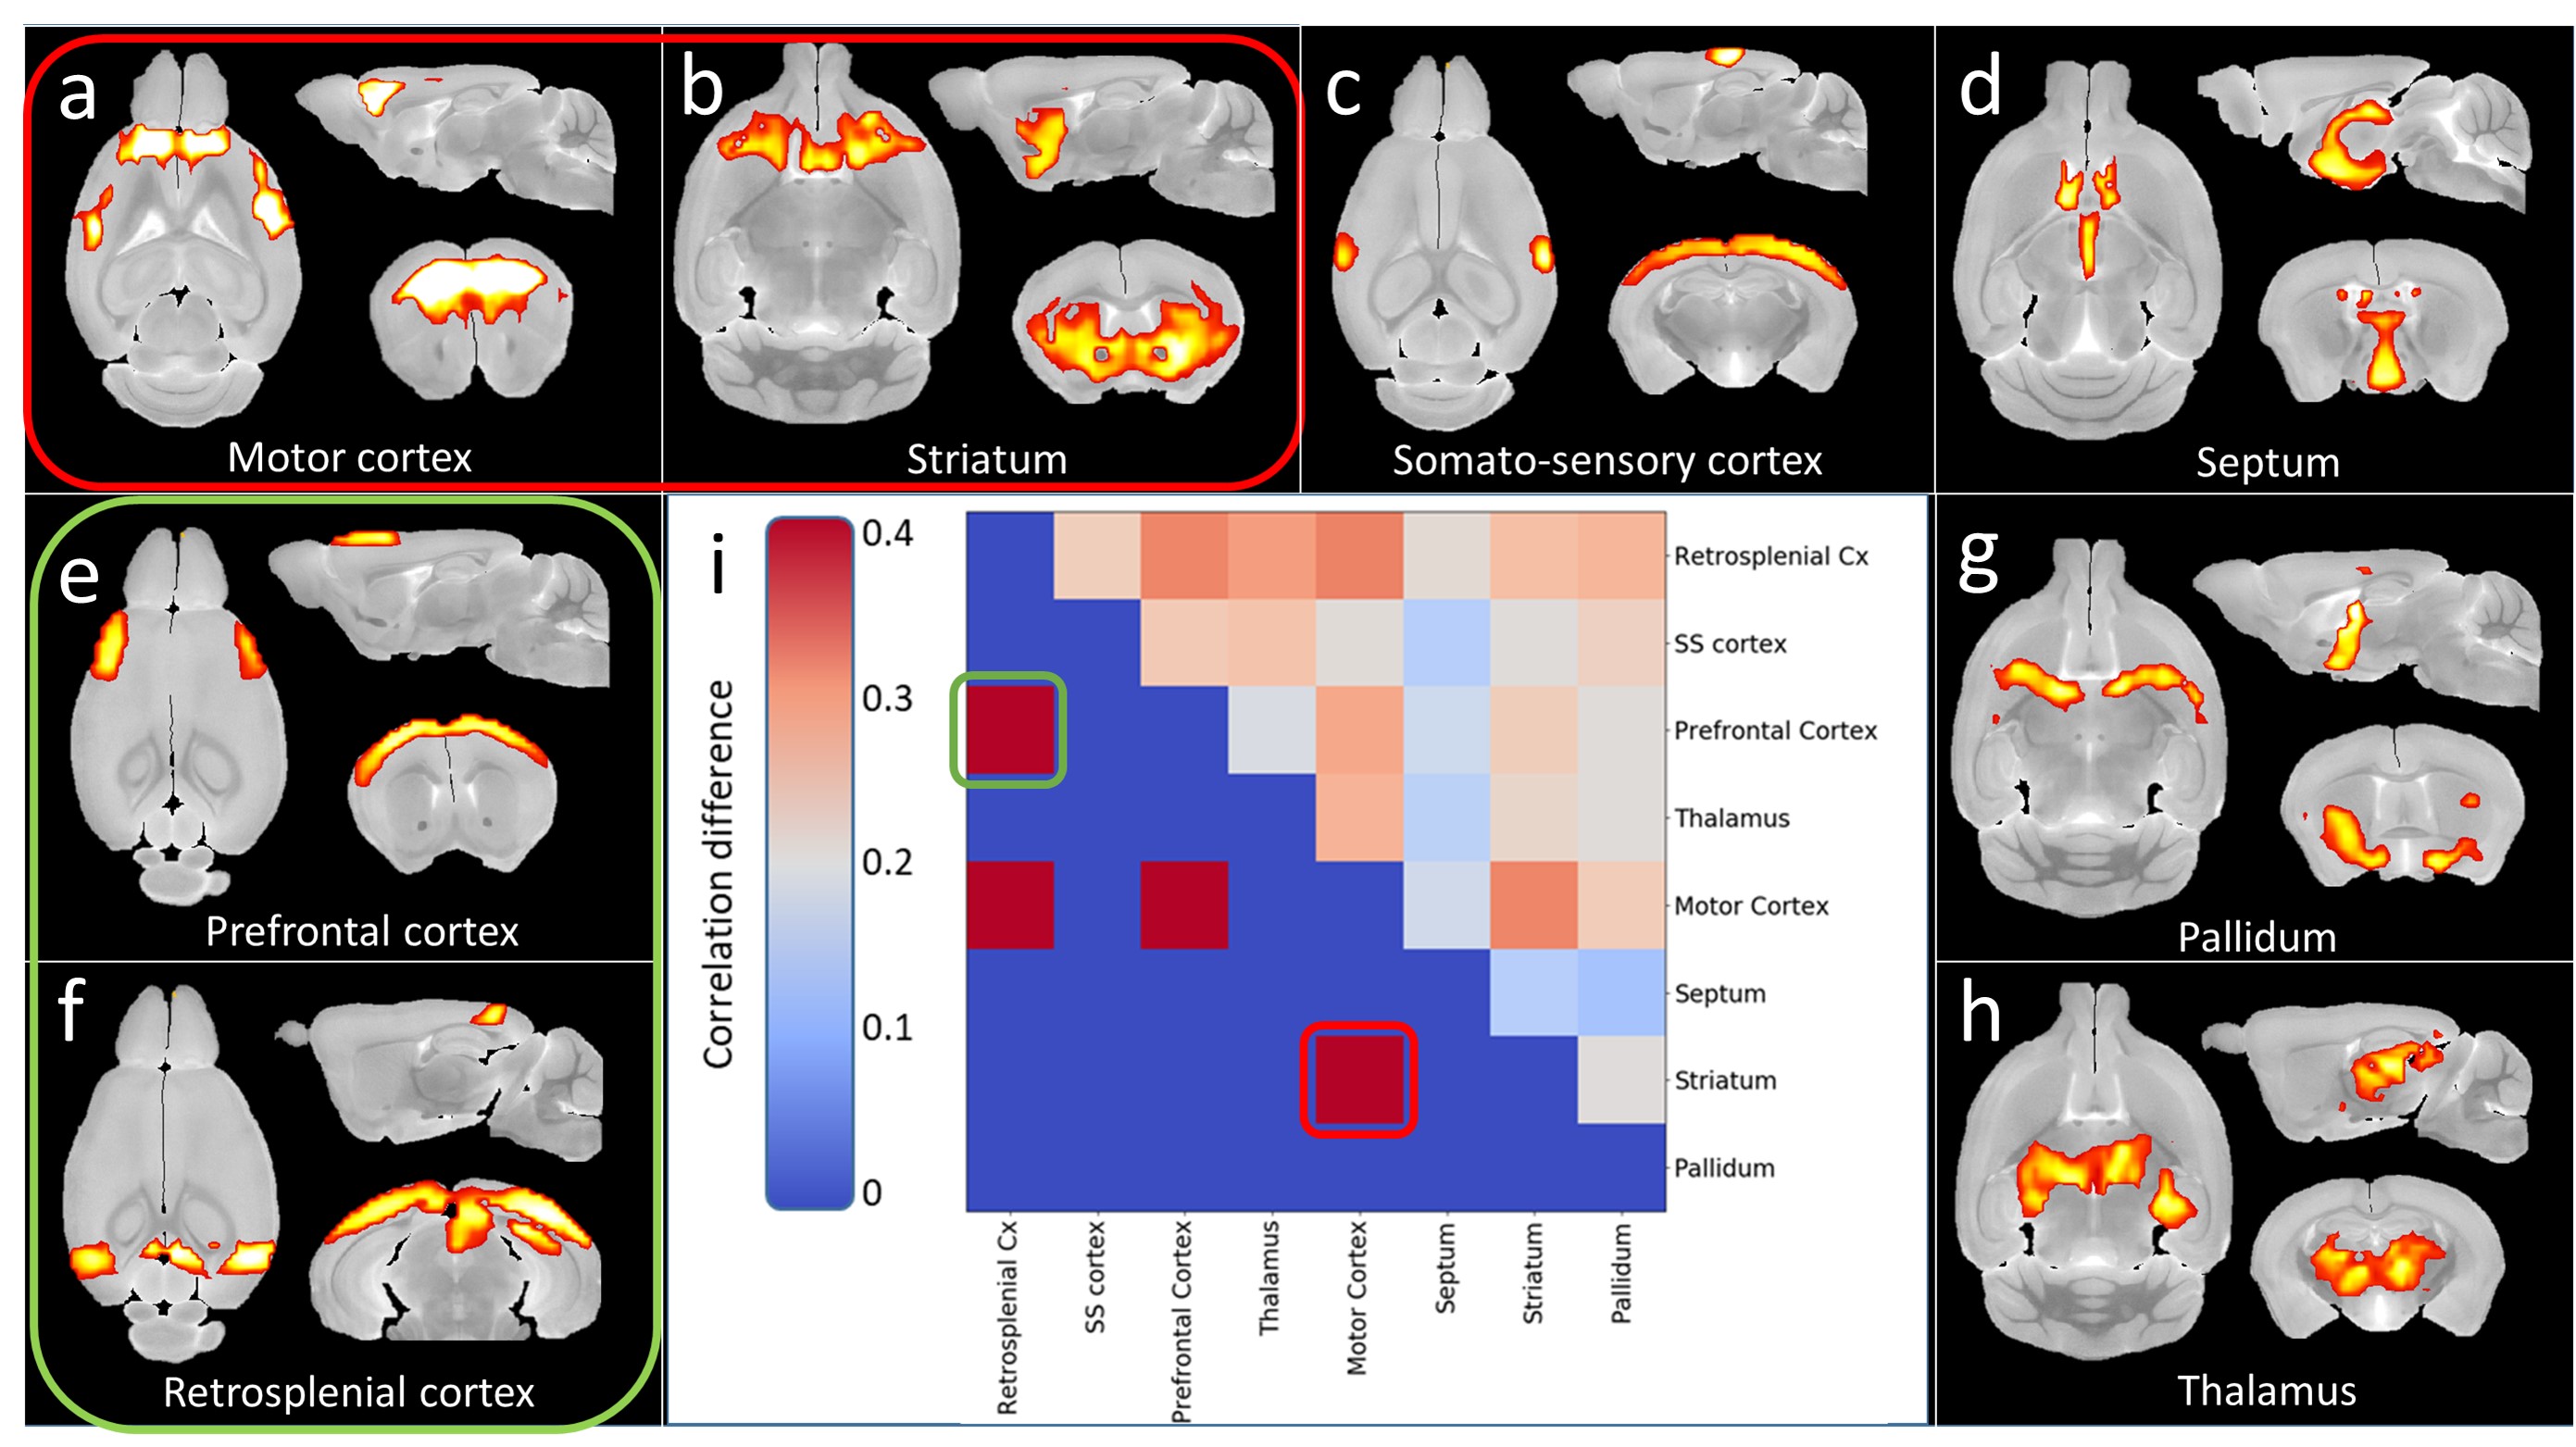
Morphometry: Variation maps of brain structures volume were calculated from anatomic images (Fig.1). zQ175 mice showed significant atrophy of the motor cortex (-8.7%, p<0.05) and striatum (-6.3%, p<0.05), as well as trends in the frontal cortex (-8.1%, p=0.056) and corpus callosum (-5.6%, p=0.056).Rs-fMRI: Decomposition of the BOLD signal in the brain into 10 components with DL revealed 4 cortical components (motor, prefrontal, somato-sensory and retrosplenial cortices, Fig.2a,c,e-f) and 4 subcortical components (striatum, septum, pallidum, thalamus, Fig.2b,d,g-h). Correlation matrix analysis among these components showed significant decrease of the Functional Connectivity (FC) between prefrontal and motor and retrosplenial cortices, as well as between motor cortex and striatum (Fig.2i).
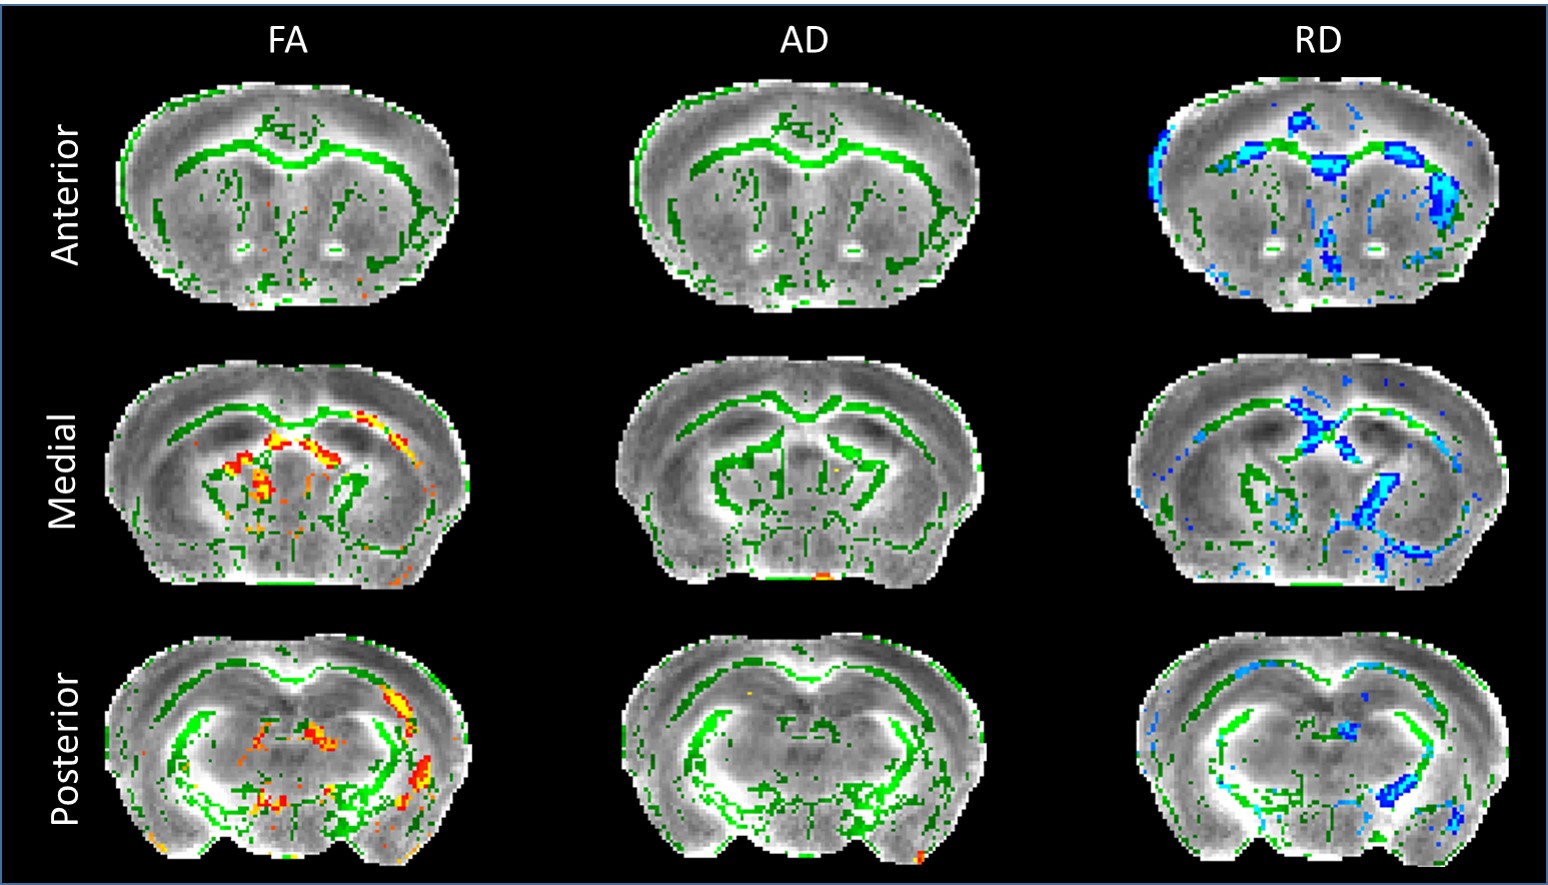
DTI: Voxel-wise analysis following skeleton-based registration of white matter revealed clusters of voxels exhibiting decreased Fractional Anisotropy (FA) in the corpus callosum of zQ175 (Fig.3, left panel). Similar analysis on Axial Diffusivity (AD) and Radial Diffusivity (RD) showed large effect of the genotype on RD, with numerous clusters of voxels with increased RD in the corpus callosum of HD mice (Fig.3, right panel), while AD did not seem to be affected (Fig.3, central panel).
Discussion
Thanks to our atlas-based segmentation pipeline allowing accurate identification of sub-structures5, we identified frontal and motor cortices as vulnerable structures in heterozygous zQ175 mice, which was consistent with cortical atrophy already reported in 4-months-old mice9.Activation of the frontal cortex in response to an almond odor has also been reported to be reduced in heterozygous mice using functional MRI10. However, to our knowledge, no study had yet explored Functional Connectivity between brain regions. The 10 components DL analysis used allowed to precisely delineate functional regions of the mouse brain and to measure their FC. The loss of connectivity between prefrontal and retrosplenial cortices, two regions of the Default-Mode Network (DMN) is consistent with the alterations of this network reported in several neurodegenerative diseases11. In addition, we discovered a FC defect between the motor cortex and the striatum of zQ175 mice, two regions of the somato-motor network well known to be vulnerable in HD.
This loss of FC seems to be related to RD impairments in anterior corpus callosum revealed by DTI. RD increase may be construed as axonal alteration or myelination defect. Furthermore, FA modifications in the corpus callosum of HD mice seem to support the idea of a key role of white matter in functional and morphologic deficiencies.
Conclusion
Thanks to our imaging protocol and analysis pipeline, we evidenced vulnerable brain networks in zQ175 mice. We showed that DTI and rs-fMRI were able to detect variations of biomarkers with more functional information than atrophy. In the future, we think that a longitudinal study using the same protocol on a cohort of heterozygous zQ175 mice would be of great interest to better understand HD pathogenesis in this mouse model. This study seems to point out the key role of brain connectivity in HD. It could be of high interest to evaluate such methods in clinical studies involving HD patients, especially in pre-manifest HD patients.Acknowledgements
Project was supported by eRARE ERA-Net (“TreatPolyQ” ANR-17-RAR3-0008-01) and NeurATRIS, (“Investissements d'Avenir”, ANR-11-INBS-0011). The 11.7T scanner was funded by NeurATRIS (“Investissements d'Avenir”, ANR-11-INBS-0011).References
1. Walker, F.O., Huntington's disease. Lancet, 2007. 369(9557): p. 218-28.
2. Tabrizi, S.J. et al., Predictors of phenotypic progression and disease onset in premanifest and early-stage Huntington's disease in the TRACK-HD study: analysis of 36-month observational data. Lancet Neurol., 2013. 12(7): p.637-49.
3. L. B. Menalled et al., Comprehensive behavioral and molecular characterization of a new knock-in mouse model of Huntington’s disease: zQ175, PloS One, vol. 7, no 12, p. e49838, 2012
4. Lein, E.S. et al. Genome-wide atlas of gene expression in the adult mouse brain, Nature, 2007. 445: 168-176.
5. Célestine, M. et al. Sammba-MRI: A Library for Processing SmAll-MaMmal BrAin MRI Data in Python. Frontiers in Neuroinformatics, 2020. 14:24.
6. Smith, S.M. et al. Tract-based spatial statistics: voxelwise analysis of multi-subject diffusion data. Neuroimage. 2006 Jul 15;31(4):1487-505.
7. Smith, S.M. et al., Advances in functional and structural MR image analysis and implementation as FSL. NeuroImage, 2004 23(S1):208-219.
8. Abraham A et al., Machine learning for neuroimaging with scikit-learn. Front. Neuroinform., 2014, 8:14.
9. T. Heikkinen et al., Characterization of neurophysiological and behavioral changes, MRI brain volumetry and 1H MRS in zQ175 knock-in mouse model of Huntington’s disease, 2012, PloS One, vol. 7, no 12, p. e50717
10. T C. F. Ferris et al., Studies on the Q175 Knock-in Model of Huntington’s Disease Using Functional Imaging in Awake Mice: Evidence of Olfactory Dysfunction, Front. Neurol., 2014, vol. 5
11. Chhatwal JP et al. Impaired default network functional connectivity in autosomal dominant Alzheimer disease. Neurology. 2013 Aug 20;81(8):736-44.
Figures