2560
Brain aging in cynomolgus macaques and common marmosets explored by mapping the magnetic susceptibility and R2*1Functional Imaging Laboratory, German Primate Center, Göttingen, Germany, 2Georg August Universität Göttingen, Göttingen, Germany, 3Leibniz Science Campus Primate Cognition, Göttingen, Germany
Synopsis
QSM and R2* both are promising MRI methods to detect subtle variations in tissue composition. The present study demonstrates the potential of QSM and R2* to characterize healthy brain aging in macaques and marmosets.
Introduction
Brain aging has been considered as a complex process of restructuring, including, but not limited to volume loss in specific tissues, changes in white matter integrity, and iron accumulation1. All these findings have likewise been observed in neurodegenerative diseases in humans indicating a close link of the underlying mechanisms3. Research on brain aging and neurodegenerative diseases depends on both, valid animal models and diagnostic tools applicable in both, animal models and humans. Due to the similarities between macaques, marmosets, and humans, both non-human primates (NHP) have become indispensable models in aging research. Quantitative susceptibility mapping (QSM) and R2* maps are methods being particularly sensitive to iron and myelin concentrations. But the different manner they respond to changes in those concentrations may be used to disentangle processes evolving in parallel during aging. Here we present magnetic susceptibility and R2* values of white and grey matter regions obtained from healthy macaques and marmosets. Region and species-specific differences are analyzed and discussed in relation to the age of the monkeys ranging from young adult to geriatric.Methods
Subjects: 13 healthy female Cynomolgus macaques (Macaca fascicularis) with an age between 7 and 20 years, and 32 healthy marmosets (Callithrix jacchus) with an age between 2 and 15 years were included in the study. The animals were grouped as following: Cynomolgus macaques: group 1, mean age 8 years, N = 4, group 2, mean age 18 years, N = 9; marmosets: group 1-4, mean age 2 (N = 7), 5 (N = 7), 8 (N = 10), and 12 years.Data Acquisition:
Macaque: acquisitions were carried out at 3 T (MAGNETOM Prisma, Siemens) using a 3D multi-echo gradient echo (ME-GRE) sequence with TE1/ spacing/ TE9/ TE10 of 3.7/ 4.9/ 43/ 50.4 ms, TR = 57 ms, and FA = 20˚. The spatial resolution was 0.312 x 0.312 x 0.312 mm3.
Marmoset: acquisitions were carried out at 9.4 T (Bruker BioSpin) using a 3D ME-GRE sequence with TE1/ spacing/ TE10 of 3/ 3/ 30 ms, TR = 42 ms, and FA = 25°. The spatial resolution was 0.21 x 0.21 x 0.21 mm3.
Data analysis: Macaque and marmoset brain masks were manually created based on the mean of ME-GRE across echo times (mGRE) using the ITK-SNAP. Brain masks along with coil-combined ME-GRE phase and magnitude data were used to calculate QSM maps. Macaque mGRE images across subjects were nonlinearly registered using ANTs to create a group average. This mGRE average was then registered to the NMT v22 and INIA194 templates to extract cortical, subcortical, and white matter regions-of-interest (ROIs). Similarly, marmoset mGRE data sets were nonlinearly registered to each other to create an average image which was then nonlinearly registered to the NIH atlas to extract the cortical, subcortical, and white matter ROIs. All macaque and marmoset ROIs were transferred into the subject native space, manually assessed, and refined wherever required. Nonlinear warp fields generated during the registration from the native subject space to the species-specific average image space were used to create average QSM and R2* maps for the respective age groups. All QSM maps were referenced to the whole brain QSM values. For statistical analyses two-sided t-tests, Bonferroni-corrected for multiple comparisons (8 ROIs) were used.
Results
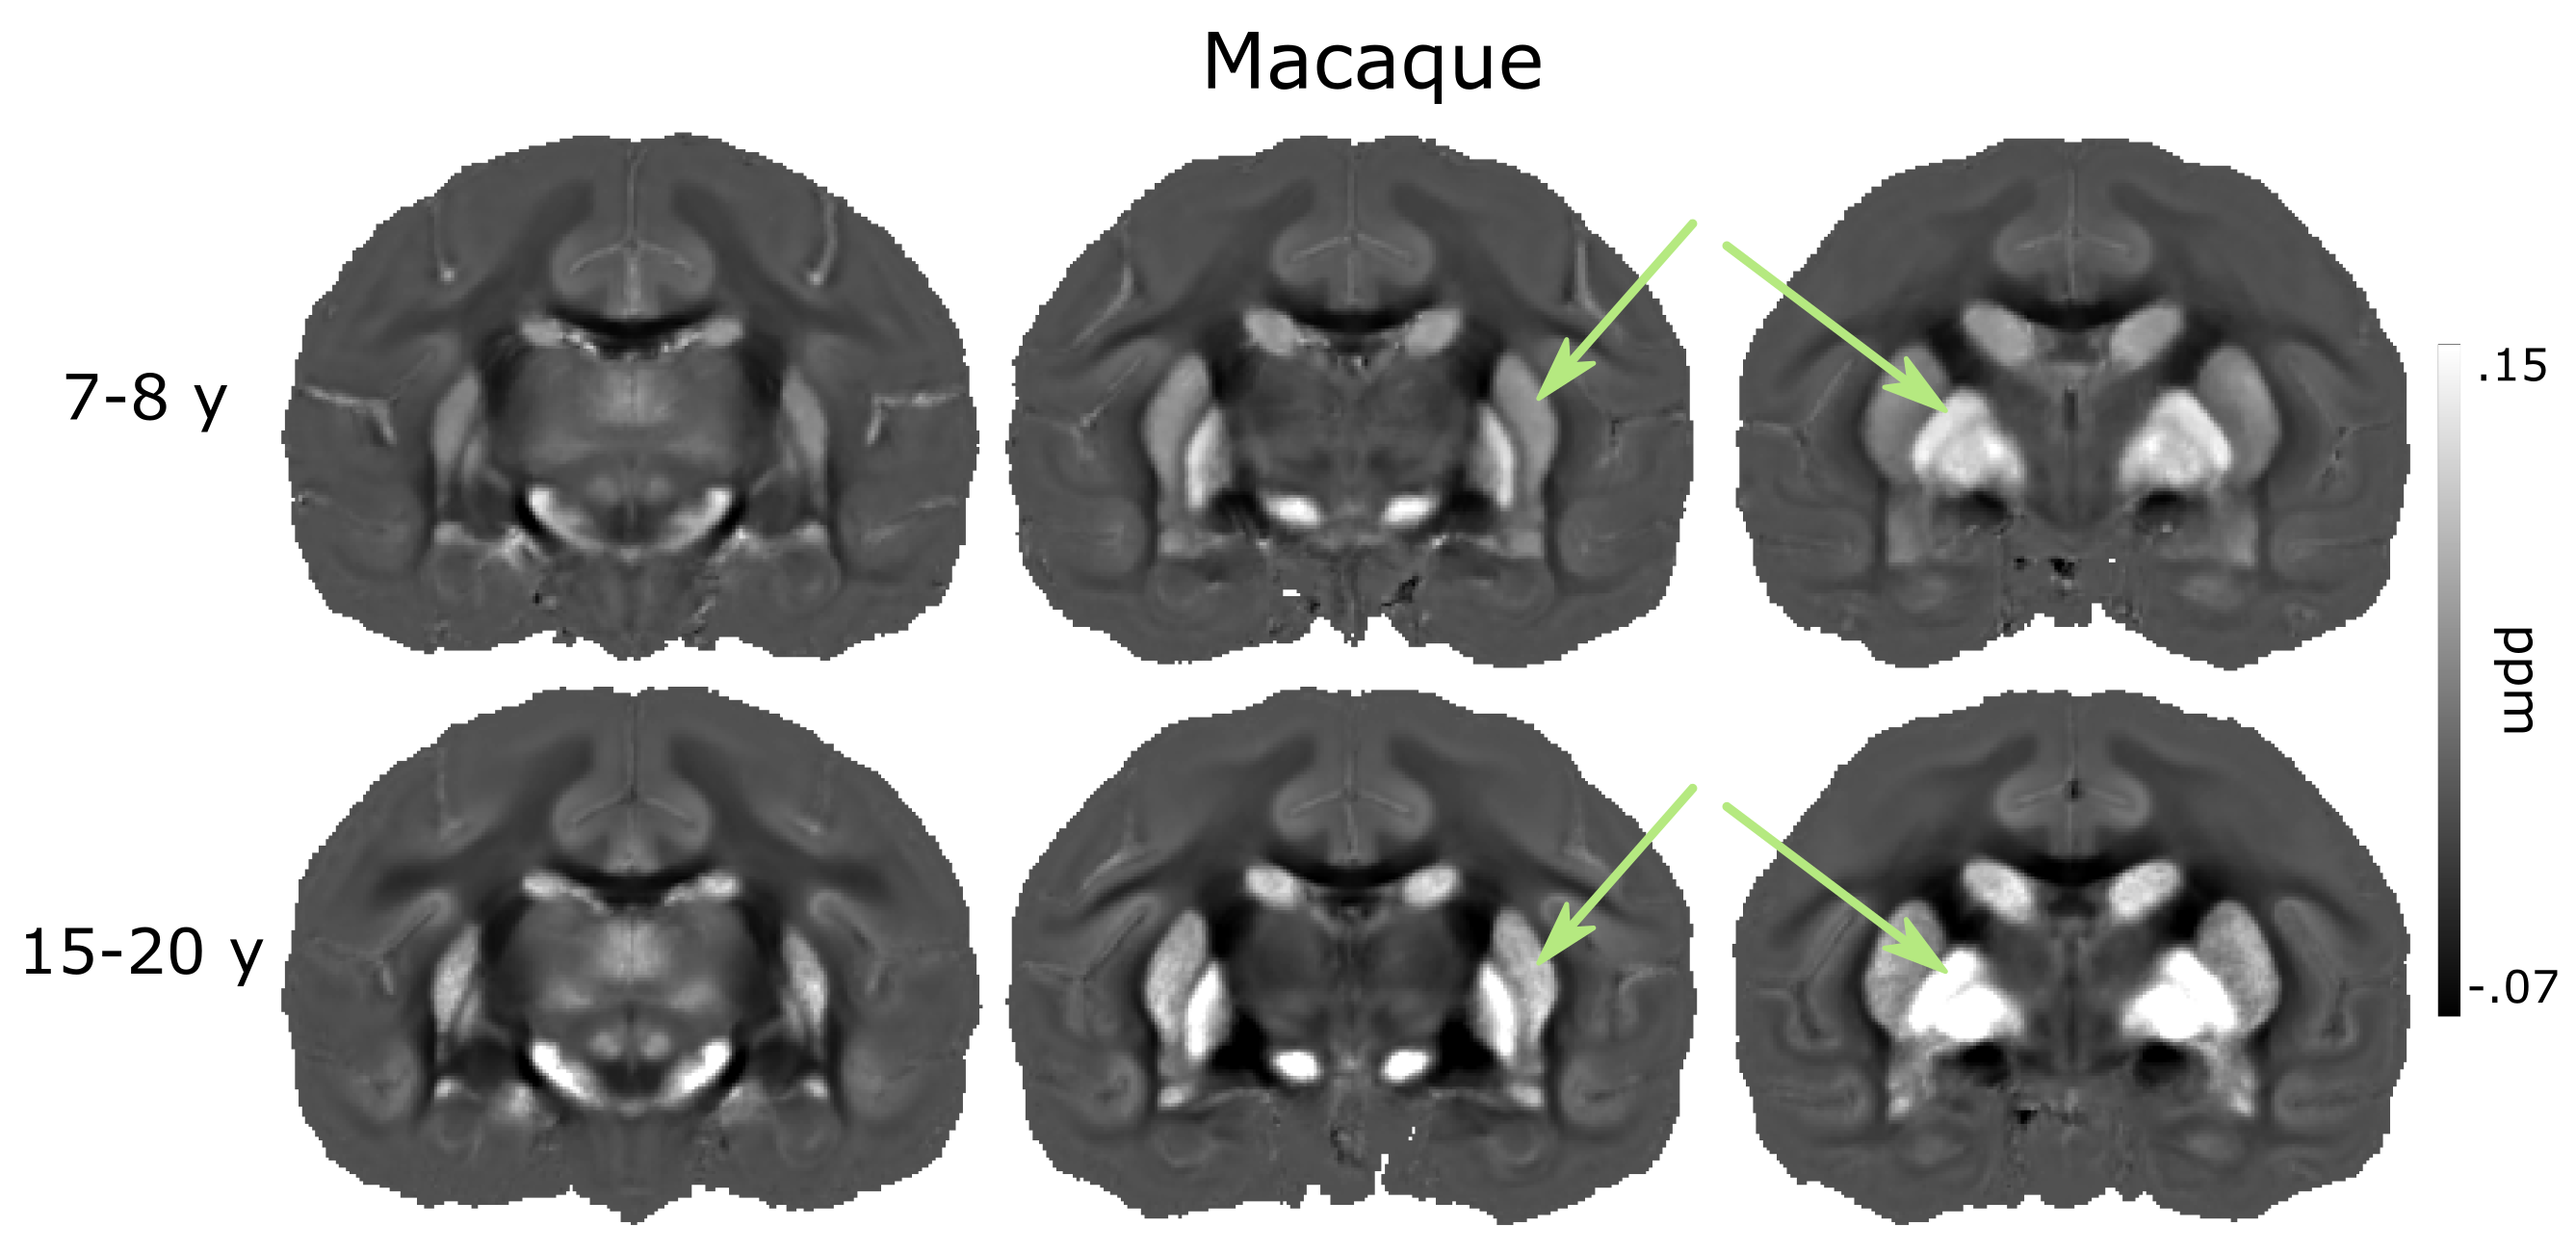
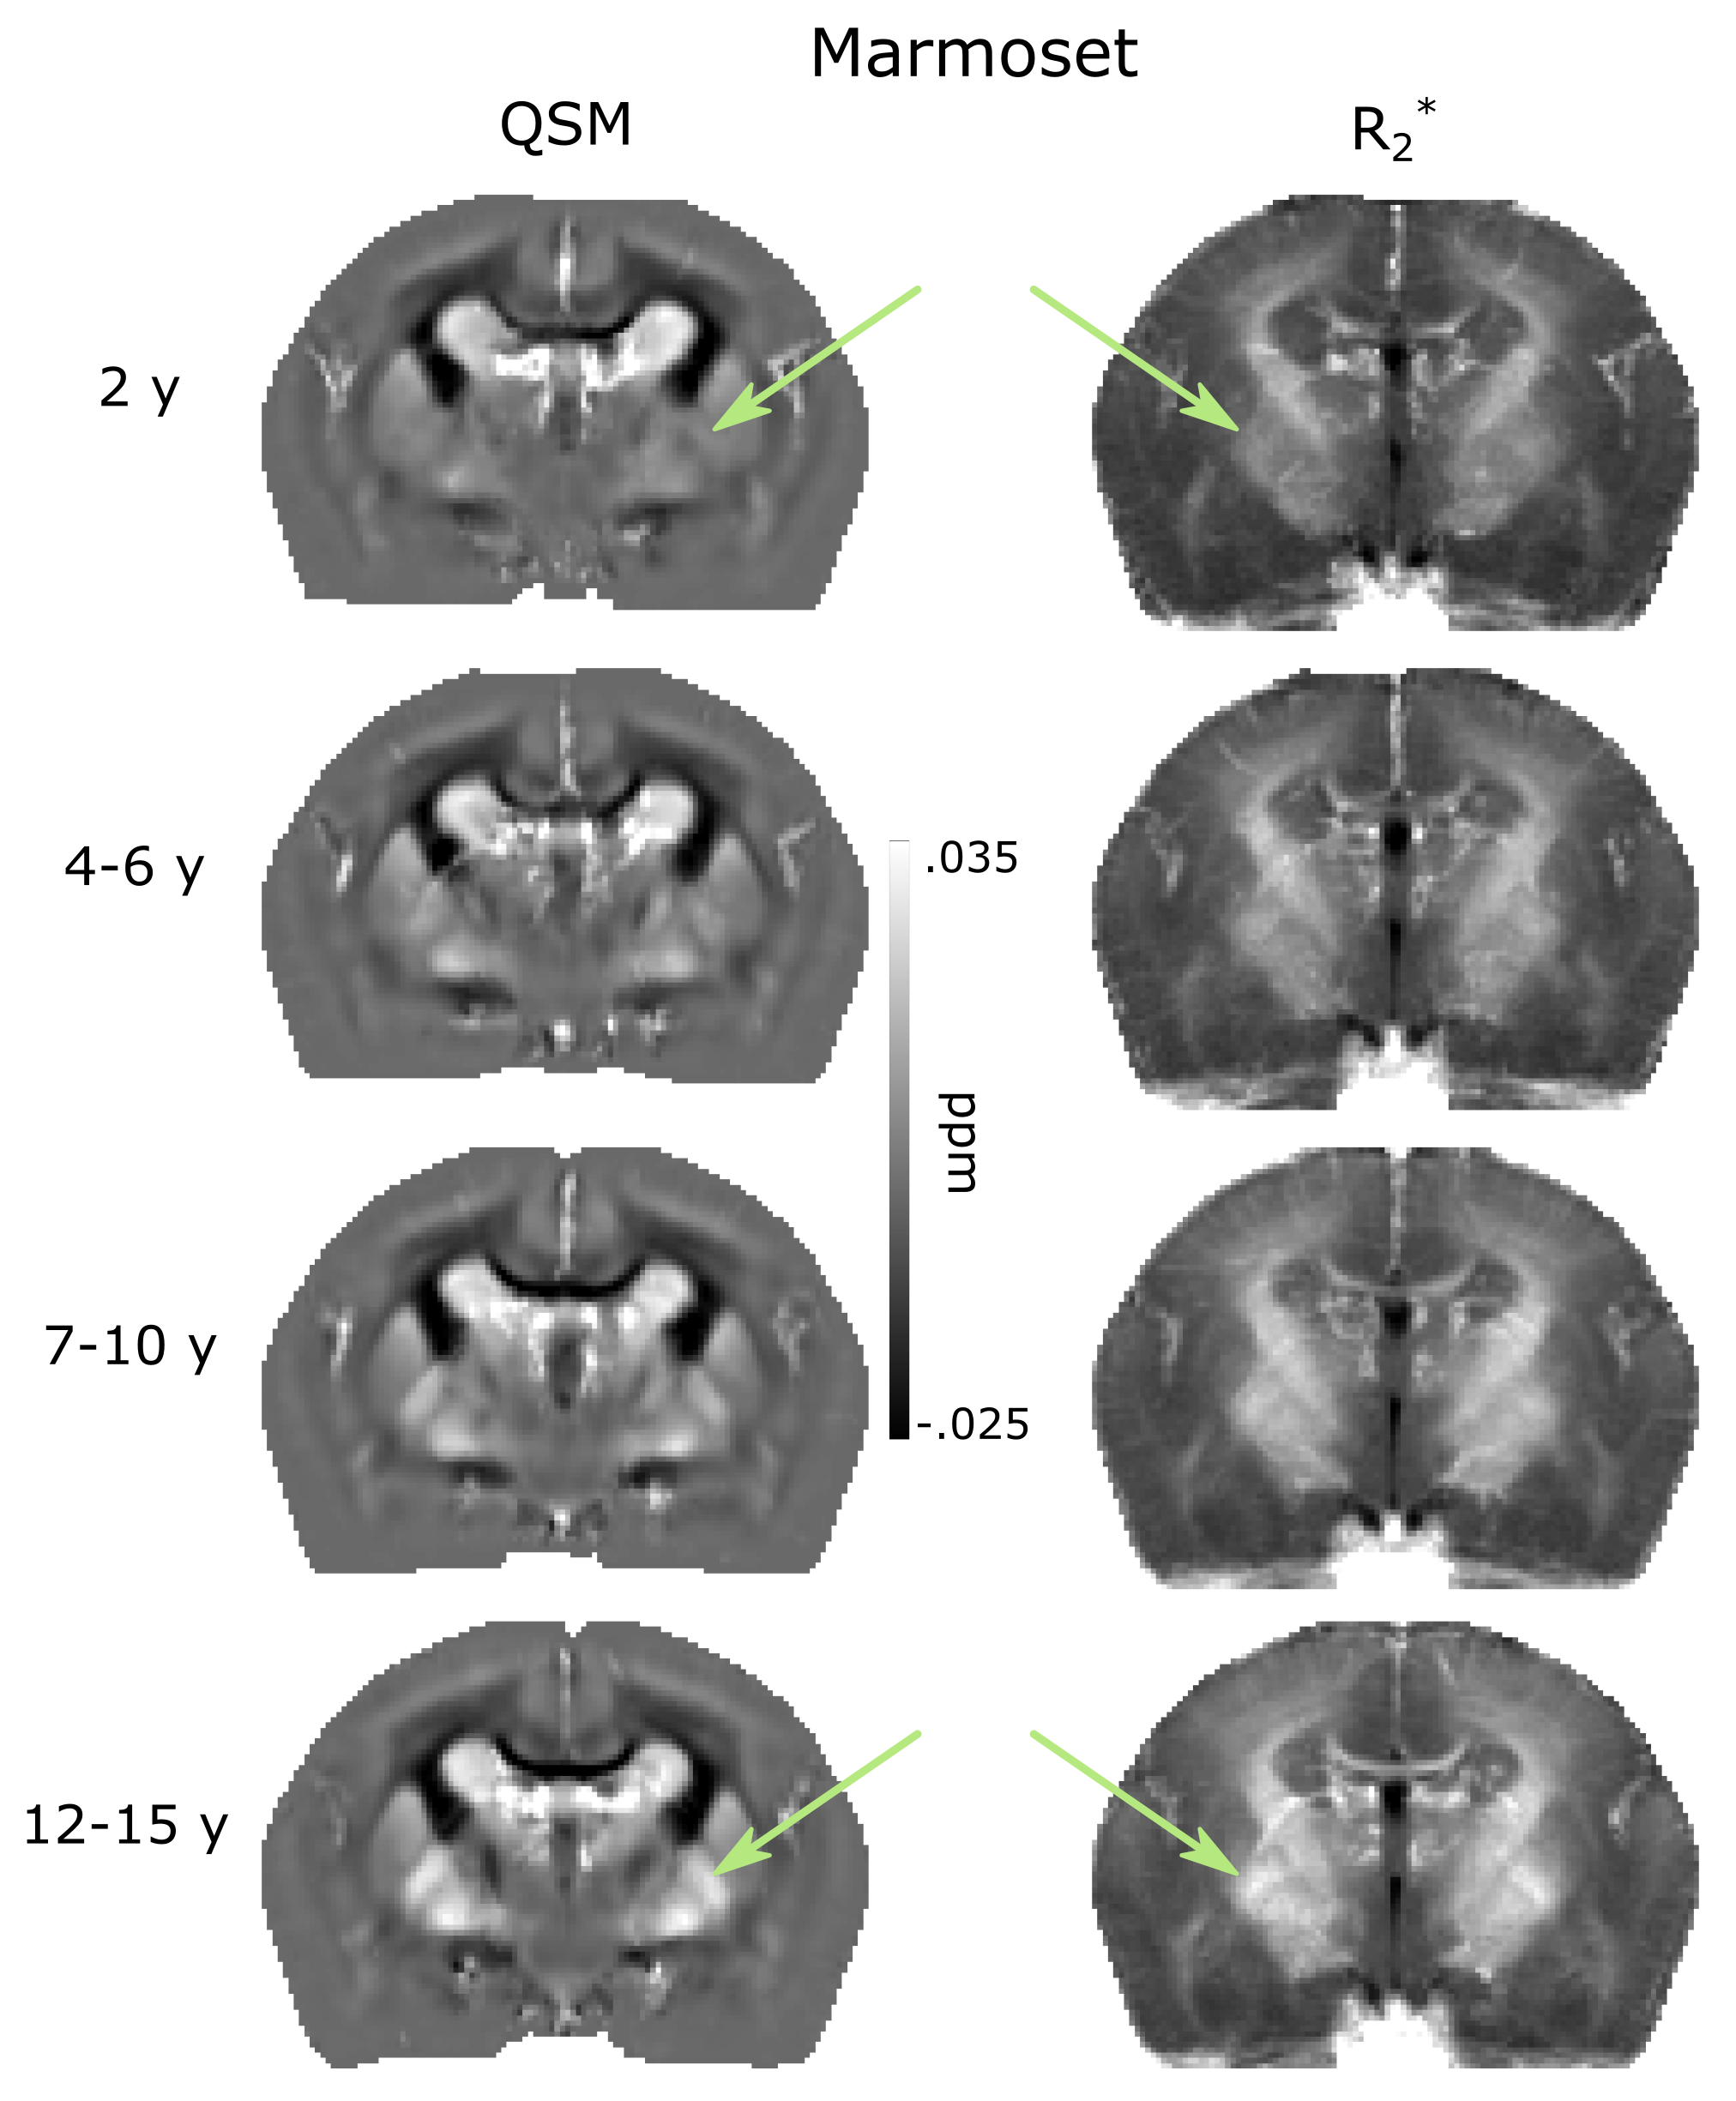
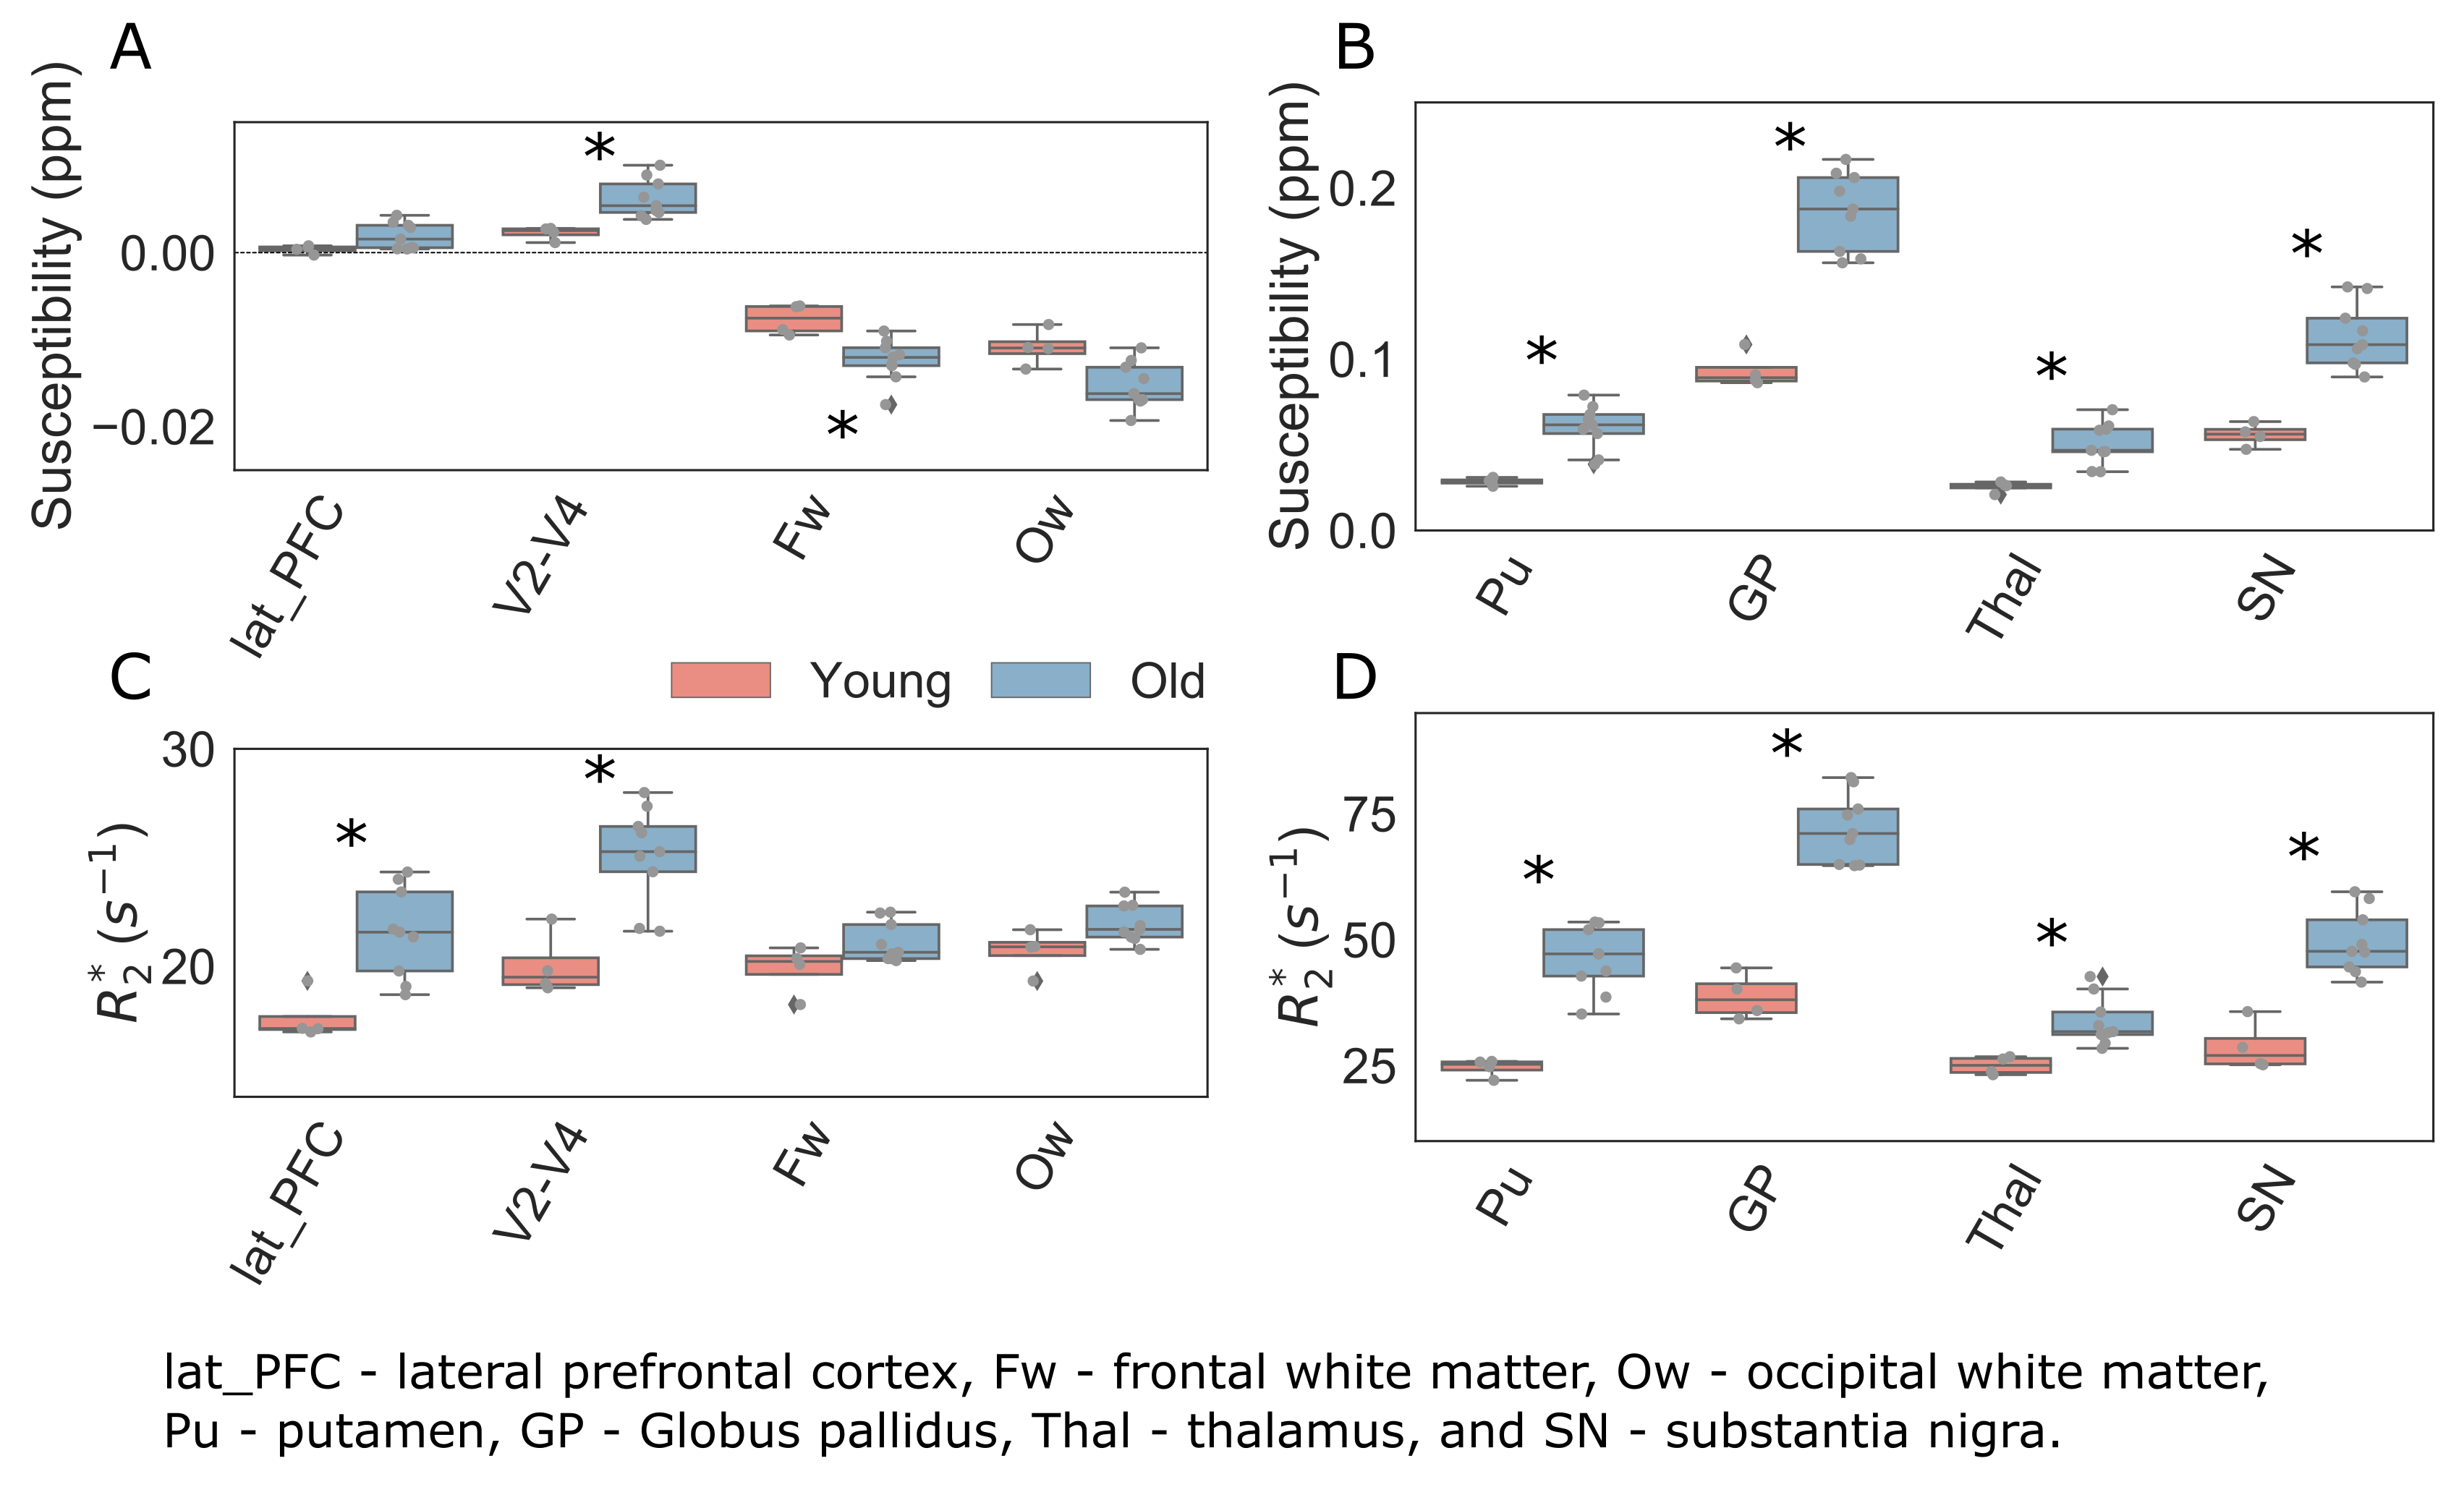
The globus pallidus and other deep gray matter nuclei showed a significant increase in the magnetic susceptibility and R2* values with age, in both species (Figure 1 and 2). Interestingly, while cortical areas showed an increase, the magnetic susceptibility of white matter structures, such as in the frontal and occipital areas, decreased with age in macaques (Figure 3A). In contrast, R2* values increased in both, grey and white matter structures (Figure 3B).Discussion and Conclusion
Magnetic susceptibility and R2* values of marmosets and macaques followed a similar trend as reported for human brain aging1. This further justifies the use of NHPs in aging research. In particular, comparative histological studies in NHPs may help to illuminate the differences in grey and white matter aging and help to better interpret respective MRI findings in younger and older humans. Compared to macaques, marmosets showed only minor or no changes in magnetic susceptibility with increasing age. Whether this reflects different aging processes or may be related to technical issues (e.g. magnetic field strength) has to be clarified in further studies.Acknowledgements
We wish to thank Kristin Kötz and Kerstin Führmann for technical assistance.References
Betts, M.J., Acosta-Cabronero, J., Cardenas-Blanco, A., Nestor, P.J., Düzel, E., 2016. High-resolution characterisation of the aging brain using simultaneous quantitative susceptibility mapping (QSM) and R2* measurements at 7T. Neuroimage 138, 43–63.
2. Jung, B., Taylor, P.A., Seidlitz, J., Sponheim, C., Perkins, P., Ungerleider, L.G., Glen, D., Messinger, A., 2020. A comprehensive macaque fMRI pipeline and hierarchical atlas. bioRxiv 2020.08.05.237818.
3. Langkammer, C., Schweser, F., Krebs, N., Deistung, A., Goessler, W., Scheurer, E., Sommer, K., Reishofer, G., Yen, K., Fazekas, F., Ropele, S., Reichenbach, J.R., 2012. Quantitative susceptibility mapping (QSM) as a means to measure brain iron? A post mortem validation study. NeuroImage 62, 1593–1599.
4. Rohlfing, T., Kroenke, C.D., Sullivan, E.V., Dubach, M.F., Bowden, D.M., Grant, K., Pfefferbaum, A., 2012. The INIA19 Template and NeuroMaps Atlas for Primate Brain Image Parcellation and Spatial Normalization. Front. Neuroinform. 6.
Figures