2559
Quantitative Neuroimaging Study for a Non-human Primate Brain Infected with Intramuscular Ebola Virus1Integrated Research Facility at Fort Detrick, Integrated Research Facility at Fort Detrick, National Institute of Allergy and Infectious Diseases, National Institutes of Health, Frederick, MD, United States, 2Clinical Monitoring Research Program Directorate, Frederick National Laboratory for Cancer Research sponsored by the National Cancer Institute, Frederick, MD, United States, 3Office of Biostatistics Research, National Heart, Lung and Blood Institute, Bethesda, MD, United States, 4Radiology and Imaging Sciences, Clinical Center, National Institutes of Health, Bethesda, MD, United States, 5Center for Infectious Disease Imaging, National Institutes of Health, Bethesda, MD, United States
Synopsis
The goal of this study was to perform quantitative neuroimaging of rhesus monkey brains following exposure with Ebola virus (EBOV) via the intramuscular route. Using a high-resolution T1 relaxometry technique, we observed a significant increase in T1 values in the late stage (days 5-7 post inoculation). The most affected regions included the prefrontal-basal ganglia-cerebella pathway. These results are suggestive of CNS involvement in EBOV and provide new insights into the underlying pathophysiology in the brain.
Introduction
Ebola virus disease (EVD) is an aggressive, often lethal, disease caused by the Ebola virus (EBOV) 1. Accumulating evidence of neurological sequelae in EVD survivors (cognitive impairment, memory loss, and difficulty sleeping) 2 shows the importance of characterization of the neuroanatomic pathway in the brain to advance our understanding of the underlying pathophysiology of EVD. Magnetic resonance (MR) imaging has played a unique role in in vivo evaluation of impaired brain function and microstructural changes in various brain diseases. Using high-resolution quantitative T1 and R2* relaxometry techniques, we evaluated the brains of nonhuman primates (rhesus monkeys) following exposure with EBOV via the intramuscular route to determine whether there is central nervous system (CNS) involvement and a neuroanatomic pathway.Methods
All imaging was conducted on a Achieva 3.0T clinical MR scanner (Philips Healthcare, Cleveland, OH, USA) equipped with an 8-channel pediatric neuro-spine coil. A total of 11 rhesus monkeys (6.68±0.50 yr; two males, nine females) were studied. All animals were exposed to EBOV variant Kikwit (1,000 plaque-forming units) via intramuscular (IM) injection into the lateral triceps muscles. MR images were collected prior to and following exposure. For the quantitative assessment of temporal changes in MR parameters during infection, the study comprised four cohorts for imaging on days post-exposure as follows: Day 3 post-exposure (DPE 3) (n=3), DPE 5 (n=3), DPE 6 (n=4), and DPE 7 (n=1).Image Acquisition
For T1 measurement, a fast field echo (FFE) sequence with a dual-flip-angle method 3 was performed (repetition time (TR) = 28 ms, echo time (TE) = 3.4 ms, flip angle (FA) 1/FA 2 = 5°/32°, resolution = isotropic 0.5 mm, field-of-view = 125 mm x 125 mm x 68 mm, 1 average, 136 slices, acquisition time = 10:36 min). For R2* measurement, a three-dimensional FFE T1‑weighted (T1w) sequence was applied (TR/TE=34 ms/42 ms, FA = 5°, resolution = isotropic 0.5 mm, 1 average, 136 slices, and acquisition time = 5 min), and principles of echo shifting with R2* (PRES R2*) in combination with T1 imaging data (FA = 5°) was used to create R2* maps.
Image Processing and Statistical Analysis
For the voxel-based quantitative analysis, all MR images were processed using an in-house pipeline, comprising non-linear image registration to D99 template, skull stripping, Gaussian smoothing (1.5 mm full width at half maximum (FWHM)), and statistical analysis using a general linear model. A paired t-test was applied for group differences between pre-exposure and post‑exposure data. A statistical significance was considered at p < 0.05 after correcting multiple comparisons using a false discovery rate.
Results
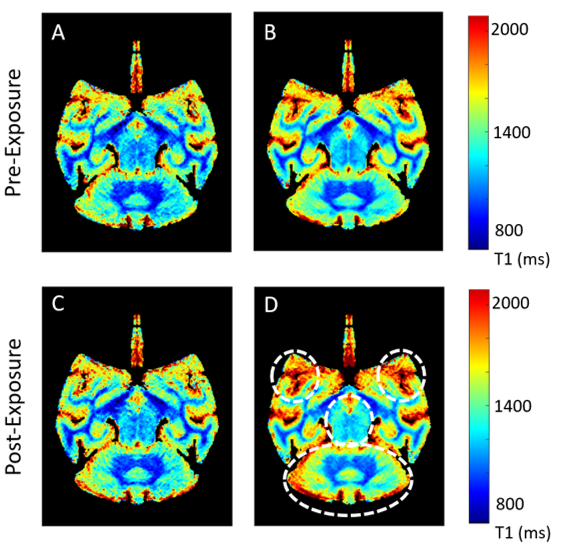
The averaged T1 maps showed a qualitative increase in T1 values in multiple brain regions after EBOV exposure compared to the pre-exposure values, mainly noticed on DPE 5-7, in the cerebellum, temporal prefrontal regions (Fig. 1). Using voxel-based statistical analysis, we found a significant increase in T1 values in the late stage of EBOV infection (DPE > 3) along the prefrontal-subcortical-cerebellar pathway (corrected p < 0.005), encompassing the prefrontal/orbital/postcentral gyrus, thalamus, putamen, caudate nucleus, and cerebellum (Fig. 2), which was confirmed by VOI analysis (Fig 3). There were no significant differences in R2* values between pre- and post-EBOV exposure (data not shown).Discussion and Conclusion
In this work, we demonstrated increasing T1 values in the brain of a non-human primate following exposure with EBOV via the intramuscular route. Those changes likely reflect disrupted blood-brain barrier in the setting of EBOV with possible secondary neurotoxicity, neuroinflammation, and neuronal loss 4. The lack of R2* changes argues against parenchymal hemorrhagic changes. Further investigation with a larger sample and long-term evaluation in sublethal models is warranted to confirm these findings and the late sequelae on the brain. Taken together, these results are suggestive of CNS involvement following EBOV-exposure via the IM route and provide insights into the underlying pathophysiology in the brain.Acknowledgements
We thank David Thomasson and the Integrated Research Facility at Fort Detrick (IRF‑Frederick) team for their support. With the U.S. National Institute of Allergy and Infectious Diseases (NIAID), this work was supported in part through the prime contract of Laulima Government Solutions, LLC, under contract (HHSN272201800013C), Tunnell Government Services, a subcontractor of Laulima Government Solutions, LLC under contract (HHSN272201800013C), and Battelle Memorial Institute’s former prime contract under contract (HHSN272200700016I). This work was further supported in part by federal funds from the National Cancer Institute and National Institutes of Health (NIH) under contract (75N91019D00024, Task Order no. 75N91019F00130). The content of this publication does not necessarily reflect the views or policies of the U.S. Department of Health and Human Services or of the institutions and companies affiliated with the authors, nor does mention of trade names, commercial products, or organizations imply endorsement by the U.S. Government.References
1. Jacob ST, Crozier I, Fischer WA, 2nd, et al. Ebola virus disease. Nat Rev Dis Primers. 2020;6(1):13.
2. Clark, D.V., et al., Long-term sequelae after Ebola virus disease in Bundibugyo, Uganda: a retrospective cohort study. Lancet Infectious Diseases, 2015. 15(8): p. 905-912.
3. Deoni SC, Peters TM, Rutt BK. High-resolution T1 and T2 mapping of the brain in a clinically acceptable time with DESPOT1 and DESPOT2. Magn Reson Med. 2005;53(1):237-241.
4. Fu, Y., K. Tanaka, and S. Nishimura, Evaluation of brain edema using magnetic resonance proton relaxation times. Adv Neurol, 1990. 52: p. 165-76.
Figures