2558
Preliminary study of a Lafora Disease mouse model using glycoNOE MRI1The Russell H. Morgan Department of Radiology, The Johns Hopkins University School of Medicine, Baltimore, MD, United States, 2F.M. Kirby Research Center for Functional Brain Imaging, Kennedy Krieger Institute, Baltimore, MD, United States, 3Department of Information Science and Technology, Northwest University, Xi'an, China, 4Institute of Biomedical and Health Engineering, Shenzhen Institutes of Advanced Technology, Chinese Academy of Sciences, Shenzhen, China, 5Department of Neuroscience, University of Kentucky, Lexington, KY, United States, 6Department of Molecular and Cellular Biochemistry, University of Kentucky, Lexington, KY, United States
Synopsis
Lafora disease (LD) is a glycogen storage disease marked by an intracellular accumulation of starch-like polyglucosan “Lafora bodies” (LBs) in brain and other tissues. There are no non-invasive approaches to quickly image brain glycogen and biopsies are difficult. We evaluate the feasibility of glycoNOE MRI to detect the accumulation of LBs in a laforin-deficient (Epm2a-/-) LD mouse model for this disease. Results suggest that the distribution of LBs in the brain can be mapped using glycoNOE MRI showing potential for studying this disease and its treatment non-invasively in vivo.
Introduction
Lafora disease (LD) is a neurodegenerative disease caused by mutations in the genes that encode the glycogen phosphatase laforin 1,2 or malin, an E3 ubiquitin ligase 3. The lack of these enzymes in LD results in the over-accumulation of poorly branched glycogen (known as Lafora bodies, LBs) in brain, and other tissues such as muscle and liver. As the pathologic hallmark of the disorder, brain LB accumulation is believed to be the driver for this neurodegeneration. Recently, we developed glycoNOE MRI to quantify glycogen in liver non-invasively 4, and herein we investigate the potential to evaluate the abnormal glycogen accumulation in LD. We present a preliminary MRI study on a LD (Epm2a-/-) mouse model, which, similar to LD patients, develops LBs and exhibits neurodegeneration 5.Materials and Methods
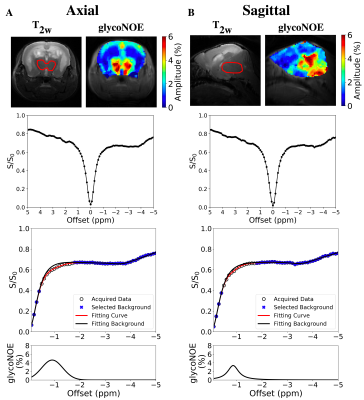
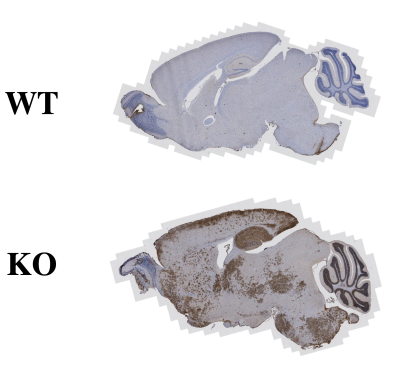
Three female 10-11 month-old laforin-deficient (Epm2a-/-) mice were studied using a 11.7 T (500 MHz) Bruker Biospec preclinical scanner (Bruker). T2w images were acquired for anatomical reference. A tsat = 4 s CW saturation pulse followed by RARE MRI readout was used for acquiring water saturation spectra (Z-spectra), TR = 8 s; The irradiation frequency was stepped over the proton spectral range (±5 ppm in steps of 0.1 ppm) and the B1 strength was varied from 0.3 to 2 μT. Z-spectral shifts caused by B0 inhomogeneities were corrected using the WASSR method 6. To ensure sufficient signal-to-noise (SNR), Z-spectral images were denoised using a median filter with kernel size of 3. glycoNOE (-1 ppm) signal was quantified by using Lorentzian and Gaussian hybrid line-shape fitting, assuming a multi-Lorentzian function for the broad background (Z-spectra in the range of -0.1 to -5 ppm, except -0.5 to -1.7 ppm) including direct saturation, NOE (-3.5 ppm), and conventional magnetization transfer contrast (MTC), and a Voigt function (Lorentzian and Gaussian combined line-shape) for glycoNOE signal. The glycoNOE map was generated from the amplitude of the Voigt line-shape. Immunohistochemistry imaging was also performed for comparison at the University of Kentucky Biospecimen Procurement and Translation Pathology Shared Resource Facility.10-month female WT and Epm2a-/- mice were sacrificed by cervical dislocation followed by immediate brain extraction and fixation in neutral-buffered 10% formalin (NBF) then paraffin embedded and stored prior to use. Fixed mouse brains were sectioned at 10 μm and processed for IHC analyses via the KM279 anti-LB and IV5B86 anti-glycogen antibodies 7 and PAS staining. Digital images were acquired through the ZEISS Axio Scan.Z1 high resolution slide scanner.Results
In vivo glycoNOE maps of the LD mouse brain show clear structures in both axial and sagittal slices (Figure 1). High glycoNOE signal intensities were found in thalamus, indicating glycogen accumulation. Contrary to liver data in the literature 4, the glycoNOE peak was not obvious in Z-spectra of the brain, because of its broad line-shape and saturation offset close to water. But the glycoNOE signal could be well quantified (R2 (goodness of fitting) > 0.999) by fitting the background Z-spectra with a 3-component Lorentzian function and then fitting the glycoNOE peak with a Voigt function. Additionally, glycoNOE maps corresponded to histological images of the similar slice in LD mouse, with high content of LBs in thalamus (Figure 2). However, accumulation of LBs was also found in hippocampus, which was contrary to our results and need to be further studied.Discussion
LD mice are characterized by accumulation of aberrant glycogen or LBs in the brain. Using glycoNOE MRI, these structures (LBs) could be mapped. The high glycoNOE signal of LD mouse found in thalamus corresponded to histology, however, low glycoNOE signal in hippocampus was not seen in histology. One possible explanation is that LBs in the hippocampus are mostly insoluble and thus unable to be detected through the water signal in Z-spectra. Further work is required to compare the results of LD mice with matched controls and models with variable levels LBs. Future studies will also include other tissues such as muscle and liver.Conclusion
Our preliminary data on LD mouse model suggest that glycoNOE MRI could detect distribution of LBs in different brain structures, and the generated glycoNOE maps resembled histology.Acknowledgements
This work was supported by NIH grant EB025295 (to N.N.Y.), NIH R35 grant NS116824 (to M.S.G.), and by the China Scholarship Council (to C.B.).References
1. Chan, E. M. et al. Laforin preferentially binds the neurotoxic starch-like polyglucosans, which form in its absence in progressive myoclonus epilepsy. Human Molecular Genetics 13, 1117-1129, (2004).
2. Ganesh, S. et al. Targeted disruption of the Epm2a gene causes formation of Lafora inclusion bodies, neurodegeneration, ataxia, myoclonus epilepsy and impaired behavioral response in mice. Human Molecular Genetics 11, 1251-1262, (2002).
3. Valles-Ortega, J. et al. Neurodegeneration and functional impairments associated with glycogen synthase accumulation in a mouse model of Lafora disease. EMBO Mol Med 3, 667-681, (2011).
4. Zhou, Y. et al. Magnetic resonance imaging of glycogen using its magnetic coupling with water. Proceedings of the National Academy of Sciences 117, 3144, (2020).
5. Criado, O. et al. Lafora bodies and neurological defects in malin-deficient mice correlate with impaired autophagy. Human Molecular Genetics 21, 1521-1533, (2012).
6. Kim, M., Gillen, J., Landman, B. A., Zhou, J. & van Zijl, P. C. M. Water saturation shift referencing (WASSR) for chemical exchange saturation transfer (CEST) experiments. Magnetic resonance in medicine 61, 1441-1450, (2009).
7. Baba, O. Production of Monoclonal Antibody That Recognizes Glycogen and Its Application for Immunohistochemistry. THE JOURNAL OF THE STOMATOLOGICAL SOCIETY,JAPAN 60, 264-287, (1993).
Figures

