2553
In Vivo Assessment Of Metabolic Abnormality In Alport Syndrome Using Hyperpolarized [1-13C]Pyruvate MR Spectroscopic Imaging1Department of Biomedical Science, Chonnam National University, Gwangju, Korea, Republic of, 2Department of Radiology, Chonnam National University Medical School and Hospital, Gwangju, Korea, Republic of, 3Department of Artificial Intelligence Convergence, Chonnam National University, Gwangju, Korea, Republic of, 4Department of Internal Medicine, Chonnam National University Hospital, Gwangju, Korea, Republic of
Synopsis
Alport Syndrome (AS) is an inherited kidney disease with progressive kidney failure. We investigate the potential of hyperpolarized 13C MRI to be used as an non-invasive technique for detecting early abnormal changes in renal metabolism. Hyperpolarized [1-13C]pyruvate imaging was applied to AS and wild-type mice at 4- and 7-week-old. Normalized Lactate in AS model was significantly lower at 7-week compared to 4-week. This abnormal renal metabolism in AS mice was consistent with PEPCK analysis, which showed increased expression level as the disease progressed. We demonstrated the feasibility of this technique for assessing early renal function in mouse model of AS.
Purpose
Alport Syndrome (AS) is a genetic disorder that is characterized by progressive loss of kidney function. Although the evaluation of early changes in renal function are important for therapy, patients with this condition are often diagnosed too late and noninvasive assessment of renal function in early stage is still challenging. Hyperpolarized (HP) 13C MRI is an emerging technique that enables noninvasive, real-time measurement of in vivo metabolism [1]. This study aimed to investigate the feasibility of using this technique for assessing early renal metabolism in mouse model of AS.Method and Material
Eight male Col4a3-/- were included as a model of AS and eight male wild-type as control. All imaging data were obtained using a GE clinical 3T scanner with a 13C/1H dual mouse coil (RAPID biomedical, Rimpar, Germany). 18L of [1-13C]pyruvate (with 1.5mM gadolinium) was polarized using a HyperSense DNP polarizer (Oxford Instruments, Abingdon, UK) [1]. Compressed sensing 3D 13C magnetic resonance spectroscopic imaging (MRSI) data [2] were acquired after the administration of HP [1-13C]-pyruvate at 4- and 7-week-old time point from each animal. For quantitative assessment of in vivo metabolism, the signals of pyruvate and its metabolic product, lactate, were normalized by the maximum vascular total carbon signal (nLac and nPyr, respectively). The temporal changes in metabolite level were compared for each group using a paired t-test. The metabolite parameters in kidney (voxels containing greater than 90% kidney in volume) were compared between the two groups at each time point using an unpaired t-test. At each time points, phosphoenolpyruvate carboxykinase (PEPCK) expression levels were measured in kidney tissue of AS and control mice using quantitative polymerase chain reaction (PCR).Result and Discussion
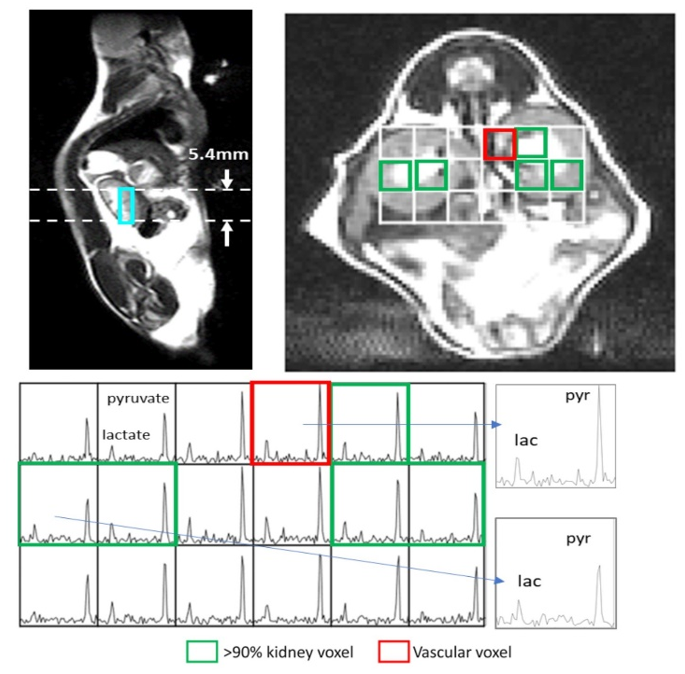
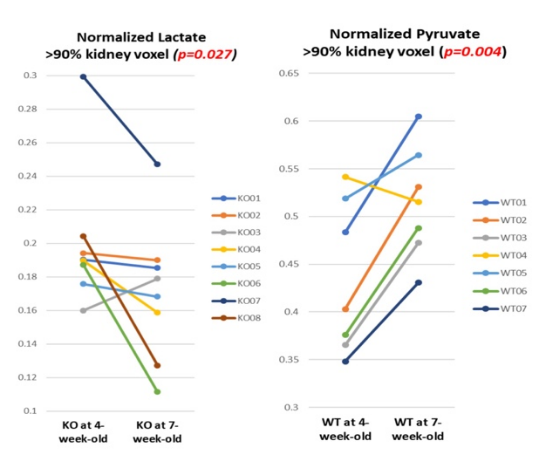
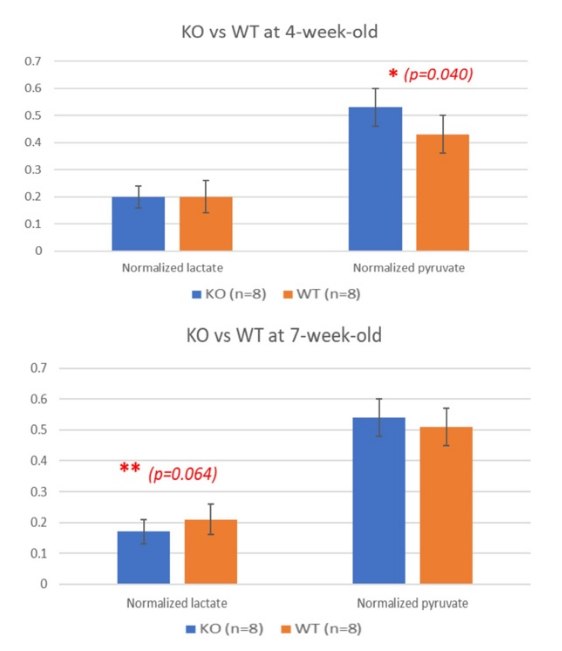
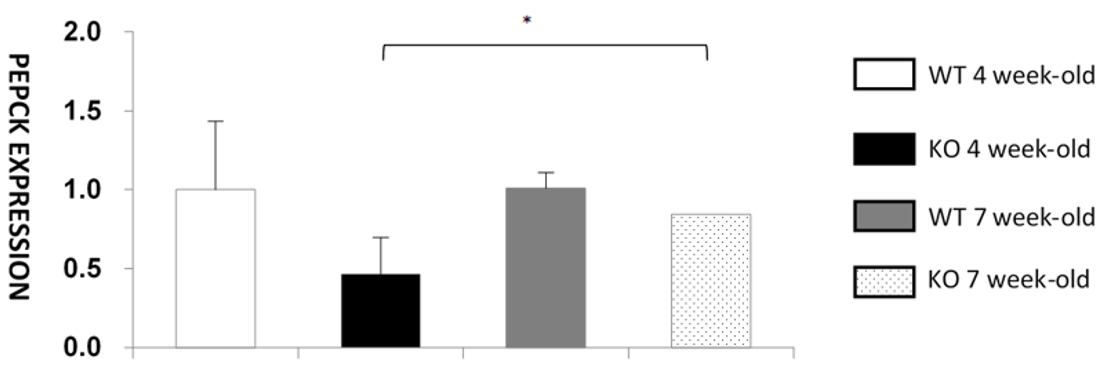
Figure 1 illustrates representative 3D 13C MRSI data from a AS mouse. The sagittal and axial image of the mouse show the 5.4 mm slice that the data were acquired from and the spatially-resolved 13C spectroscopic imaging voxels overlaid on top of the axial image. The green and red voxels correspond to the kidney and vascular voxels used for metabolite quantification. The 13C MRSI data with a 22 mm in-plane resolution produced lactate and pyruvate signals with substantial sensitivity. nLac of the knock-out mice significantly reduced from 0.20±0.04 at 4-week-old to 0.17±0.04 at 7-week-old (p=0.027; Fig 2A). The wild-type mice showed a significant increase of nPyr from 0.43±0.08 at 4-week-old to 0.52±0.06 at 7-week-old (p=0.0039; Fig 2B). For the comparison between the two groups, nPyr of knock-out mice was significantly higher than that of wild-type mice at 4-week-old (0.53±0.08 vs 0.45±0.08, respectively, p=0.040; Fig3). nLac of knock-out mice was smaller than that of wild-type at 7-week-old (0.17±0.04 vs 0.21±0.05, respectively, p=0.064; Fig3). PEPCK expression level of knock-out mice in 7-week-old was significantly higher than that of 4 week-old knock out mice. PEPCK is known as the rate-limiting enzyme of gluconeogenesis and PEPCK expression is widely used for marker of gluconeogenesis [3]. The increased level of PEPCK expression of AS mice at 7-week-old compared to at 4-week-old was consistent with our imaging finding where the level of nLac was reduced in AS mice as the disease progresses. In contrast, the control group showed a similar level of PEPCK expression at 4 and 7 week.Conclusion
The noninvasive assessment of early renal functional changes in AS is important for diagnosis as well as for identifying proper treatment strategy. We demonstrated the potential of HP 13C MRI for early monitoring of metabolic changes in AS. AS mice presented an early metabolic abnormality that prohibited pyruvate-to-lactate conversion, which was consistent with the increased level of PEPCK expression as the disease progresses. The results from this study warrant further investigation of underlying mechanism that corresponds to the observed metabolic changes in the early stage of AS.Acknowledgements
This study was supported by the Ministry of Education, Republic of Korea (2019R1I1A3A01059201) and the Korea Health Technology R&D Project through the Korea Health Industry Development Institute (KHIDI), funded by the Ministry of Health & Welfare, Republic of Korea (HR20C0021).References
1. Ardenkjaer-Larsen JH, et al. Increase in signal-to-noise ratio of > 10,000 times in liquid-state NMR. Proc Natl Acad Sci USA. 2003;100(18):10158-63.
2. Park I, et al. Evaluation of heterogeneous metabolic profile in an orthotopic human glioblastoma xenograft model using compressed sensing hyperpolarized 3D 13C magnetic resonance spectroscopic imaging. Magn Reson Med. 2012;70(1):33-9.
3. Chakravarty K, et. al. Factors that control the tissue-specific transcription of the gene for phosphoenolpyruvate carboxykinase-C. Crit Rev Biochem Mol Biol 2005;40:129–154.
Figures