2552
Effect of metabolic syndrome on anatomy and function of the lower urinary tract1Radiology, University of Wisconsin-Madison, MADISON, WI, United States, 2Biostatics and Medical Informatics, University of Wisconsin-Madison, Madison, WI, United States, 3Urology, University of Wisconsin-Madison, Madison, WI, United States, 4Biomedical Engineering, University of Wisconsin-Madison, MADISON, WI, United States, 5Mechanical Engineering, University of Wisconsin-Madison, Madison, WI, United States
Synopsis
Metabolic syndrome (MetS) contributes to lower urinary tract symptoms (LUTS). However, non-invasive methods for studying this association are limited. This study investigated the relationship of MetS, LUTS, anatomy, and function of the bladder and prostate in men and women. Manual segmentation with 3D rendering of the bladder and prostate were performed from MRI. We found that MetS is associated with increased bladder wall volume and postvoid residual in men but not women, suggesting that the effect of MetS on the prostate contributes to anatomic and functional changes of the bladder in men.
Introduction
Lower urinary tract symptoms (LUTS) are a costly and critical medical problem for millions of aging men and women. The spectrum of LUTS includes weak, intermittent, or hesitant urination, nocturia, and a sensation of incomplete bladder emptying, which contributes to lower urinary tract dysfunction (LUTD). Nearly 75% of men and women over 70 report decreased quality of life related to LUTS1. LUTD in aging men and women are associated with anatomical changes of the bladder and prostate, including bladder wall thickening, increased postvoid residual, and benign prostate enlargement2. Bothersome LUTS has been associated with metabolic syndrome (MetS), a cluster of medical conditions that contribute to systemic low-grade chronic inflammation1,3-4. MetS is diagnosed clinically when 3 of the following 5 comorbidities coexist including: waist circumference >40 inches (men) or >35 (women), blood pressure >130/85, fasting triglycerides 150 mg/dL, HDL cholesterol <40 mg/dL (men) or <50 (women) and fasting glucose 100 mg/dL. We have previously shown that T2-weighted pelvic MRI with 3D anatomic renderings of the bladder and prostate can quantifying lower urinary tract anatomy. The purpose of this study is to investigate the relationship between MetS, LUTS with functional and anatomic changes of the lower urinary tract with MRI.Materials and Methods
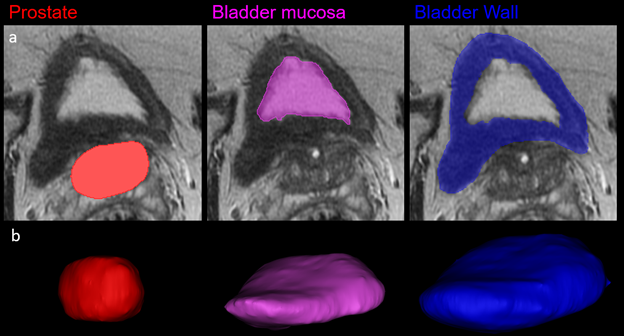
This HIPAA-compliant, single center prospective study was performed under a waiver of informed consent. Pelvic MRI’s of 95 subjects [56M, median age 64 years (IQR: 59-67) and 39F, median age 47.5 years (IQR: 40.5-65)], were analyzed. MRIs were performed either on a 3T scanner (Discovery MR 750, GE Healthcare, Waukesha, WI) using a 32-channel surface coil (NeoCoil, Pewaukee, WI) or 1.5T scanner (MR450) with an 8-channel surface coil. The bladder wall, bladder mucosa, and prostate of the 95 subjects were segmented (Figure 1a) on T2-weighted pelvic MRI using Materialize Mimics 3D processing software (Materialise, Belgium). Bladder wall volume (BWV), postvoid residual (PVR), and prostate volume (PV) were quantified from the 3D anatomic renderings (Figure 1b). All patients completed LUTS screening at time of MRI; the International Prostate Symptom Score (men) or Urogenital Distress Inventory – 6 (women). Patient data collected included: blood pressure, fasting blood glucose, HDL, and triglyceride levels. Patients were considered to have MetS when 3 diagnostic criteria for MetS were present, excluding waist circumference, Wilcoxin ranked sum, win ratio, and chi-square tests were used to correlate LUTS scores, BWV, PVR and PV in patients 1) without vs with MetS, 2) mild (men: IPSS: 0-7; women: UD6 0-10) vs moderate-severe (IPSS: 8-35 and UD6: >10) and 3) normal vs enlarged (>40cc) prostates.Results
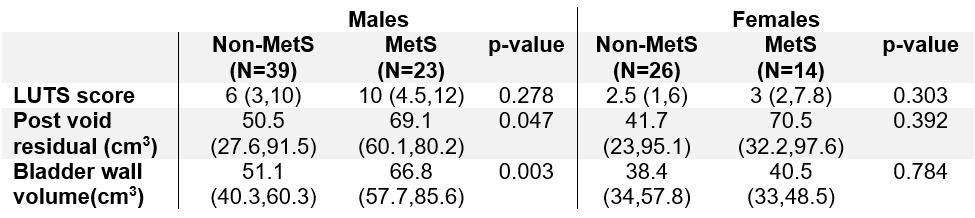
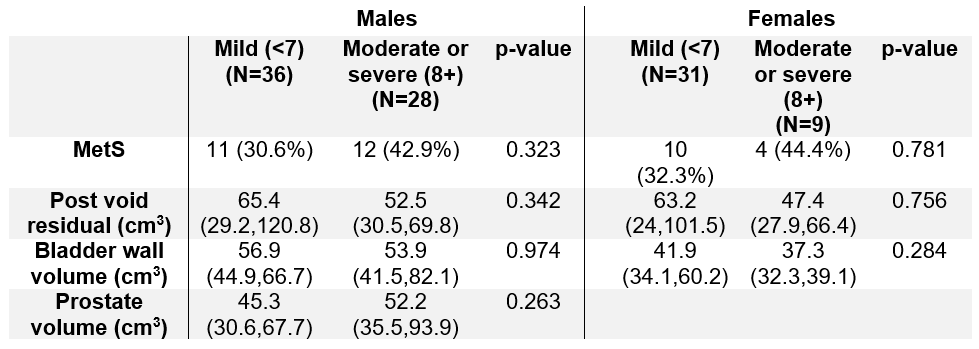
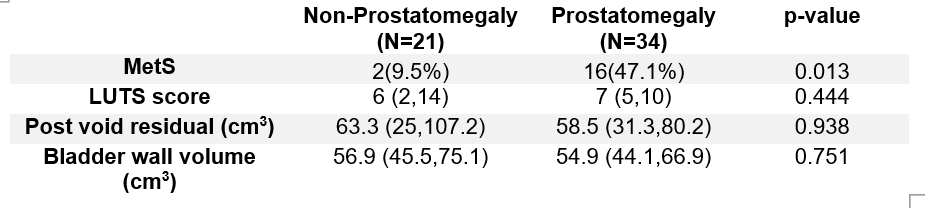
Men with MetS had higher BWV (66.8 vs 51.1cm3, p=0.003), PVR (69.1 v 50.5cc, p=0.05) and larger prostates (67.2 vs 40.1cm3, p=0.01) with a trend toward higher LUTS scores (10 vs 6, p=0.28). Women without and with MetS had similar BWV, PVR, and LUTS scores (p=0.3-0.78) (Table 1). There was no difference in incidence of MetS, BWV, PVR, or PV in men and women with mild vs moderate-severe LUTS [(p=0.26-0.97) and (p=0.28-0.78), respectively]. Men with prostamegaly (>40cc) were more likely to have MetS (p=0.01), (Table 2). There was no difference in BWV, PVR, and LUTS scores for men with normal vs enlarged prostates (p=0.44-0.94) (Table 3).Discussion
Metabolic syndrome leads to anatomic (increased BWV), and functional (higher PVR) changes of the bladder and benign prostate enlargement (BPE). Importantly, MetS is not associated with anatomic or functional changes of the bladder in women. Further, men with BPE were more likely to have MetS. This suggests that the effect of MetS on the lower urinary tract in men may be primarily centered in the prostate. Metabolic syndrome is a systemic inflammatory process that contributes to prostate inflammation and fibrosis. Inflammatory infiltrates induce excessive epithelial and stromal proliferation, and the conversion of fibroblasts to myofibroblasts contributing to collagen deposition increased prostate stiffness and BPE5. Current medical therapies targeting androgen activity and smooth muscle contractility in the prostate improve urine flow; however, these treatments are not effective for all men and do not alter the progressive course of LUTD6. These data suggest that alternative disease phenotypes, such as the effect of MetS on the prostate, contribute to the development and progression of LUTD.Conclusion
MRI is a safe, accurate, and reproducible imaging modality to characterize anatomy and function of the lower urinary tract in men and women. MR-imaging based biomarkers of the lower urinary tract are needed to improve disease phenotyping.Acknowledgements
We acknowledge GE Healthcare, which provides research support to the University of Wisconsin.
National Institutes of Health, NIDDK Wisconsin Multidisciplinary K12 Urologic Research Career Development
References
[1] Wei JT, Calhoun E, Jacobsen SJ. Urologic diseases in america project: benign prostatic hyperplasia. J Urol. 2008 May;179(5 Suppl):S75-80. doi: 10.1016/j.juro.2008.03.141. PMID: 18405761.
[2] Anzia LE, Johnson CJ, Mao L, Hernando D, Bushman WA, Wells SA, Roldán-Alzate A. Comprehensive non-invasive analysis of lower urinary tract anatomy using MRI. Abdom Radiol (NY). 2020 Oct 11. doi: 10.1007/s00261-020-02808-9. Epub ahead of print. PMID: 33040167.
[3] Pashootan P, Ploussard G, Cocaul A, de Gouvello A, Desgrandchamps F. Association between metabolic syndrome and severity of lower urinary tract symptoms (LUTS): an observational study in a 4666 European men cohort. BJU Int. 2015 Jul;116(1):124-30. doi: 10.1111/bju.12931. Epub 2014 Dec 8. PMID: 25229124.
[4] Nandy PR, Saha S. Association between components of metabolic syndrome and prostatic enlargement: An Indian perspective. Med J Armed Forces India. 2016 Oct;72(4):350-355. doi: 10.1016/j.mjafi.2016.07.005. Epub 2016 Sep 5. PMID: 27843182; PMCID: PMC5099443.
[5] Begley LA, Kasina S, MacDonald J, Macoska JA. The inflammatory microenvironment of the aging prostate facilitates cellular proliferation and hypertrophy. Cytokine. 2008; 43:194–199.
[6] Laborde EE, McVary KT. Medical management of lower urinary tract symptoms. Nat. Rev. Urol. 2009; 11:S19–S25.
Figures