2551
Differential diagnosis of clear renal cell carcinoma and renal angiomyolipoma without visible fat by IDEAL-IQ sequence
Xinmiao Bu1, Ailian Liu1, Jinghong Liu1, Qingwei Song1, Juan Ruan2, Weilin Li2, and Ru Cao2
1The First Affiliated Hospital of Dalian Medical University, Dalian, China, 2Dalian Medical University, Dalian, China
1The First Affiliated Hospital of Dalian Medical University, Dalian, China, 2Dalian Medical University, Dalian, China
Synopsis
IDEAL-IQ is a new scanning sequence based on the principle of three-point Dixon asymmetric echo technology. The images of water phase, lipid phase, in-phase, reverse phase, fat fraction and R2* relaxation images can be generated at the same time in one scan to realize the quantitative measurement of fat fraction. The R2* value of the ccRCC group was greater than that of the RAMLwvf group, and the FF value was lower than RAMLwvf group, the difference was statistically significant (P <0.05). The AUC value of R2* value and FF value for identifying ccRCC with RAMLwvf groups are 0.893 and 0.905.
Introduction
Renal angiomyolipoma without visible fat (RAMLwvf) is one of the most common renal tumors, accounting for 39%. It is composed of mature adipose tissue, thick walled blood vessels and smooth muscle. When the fat content in the tumor is poor, the imaging manifestations are not typical, and it is easy to be misdiagnosed as renal cell carcinoma[1]. Clear renal cell carcinoma(ccRCC) is the most common renal malignancy. RAMLwvf usually does not need surgery.However, ccRCC must be resected when found because of its high degree of malignancy. It is necessary to make a definite differential diagnosis of the two carcinomas before operation. IDEAL-IQ technology is a new scanning sequence based on the principle of three-point Dixon asymmetric echo technology. The images of water phase, lipid phase, in-phase, reverse phase, fat fraction and R2* relaxation images can be generated at the same time in one scan to realize the quantitative measurement of fat fraction[2].Methods
The data of patients who met the following criteria from July 2012 to June 2020 were analyzed retrospectively.The inclusive criteria were as follows: (1) ccRCC or renal RAMLwvf confirmed by surgery and pathology, with complete clinical and pathological data;(2) No MRI contraindications, scanning sequence containing IDEAL-IQ sequence; (3) No radiotherapy, chemotherapy or other treatment before examination; (4) Good image quality, no false shadow area affecting the observation and data measurement of the lesions; (5) The lesions were clearly displayed major diameter > 1.5 cm.Finally, there were 12 cases of ccRCC and 7 cases of RAMLwvf,which were scanned by GE signa hdxt 1.5T MR scanner.The image data of IDEAL-IQ is transmitted to aw 4.6 workstation, and the image is post processed to obtain R2* and FF images, as shown in Figure 1. Two radiologists (observers 1 and 2) with 3 and 15 years of experience in abdominal MR diagnosis completed the data measurement respectively, but they did not know the pathological diagnosis of the patient. According to the conventional MR images, the largest section of the tumor was selected to delineate ROI, the area was larger than 1 / 3 of the solid part of the lesion, and the necrosis, hemorrhage and cystic change areas were avoided. The observer drew 1 ROI on each of the two adjacent layers and took the average value. Two kinds of ideal-iq post-processing images can be converted to each other in the workstation to ensure that ROI is placed in the same position on the two images.Software SPSS 26.0 was used for statistical analysis. Shapiro-Wilk was used to test whether each data conforms to the normal distribution. Those conforming to the normal distribution are represented by x±s, and those conforming to the skewed distribution are represented by the median (P25, P75). The intra-group correlation coefficient (ICC) was used to test the consistency of the measurement results of the two observers on the parameter values of the two groups of cases. 0.4 and 0.75 were used as the cut-off points for the evaluation of poor, medium, and good consistency, and the measurement results of the senior observer The average value is analyzed.Independent sample t test (normal distribution) or Mann-Whitney U test (skew distribution) was used to compare the differences between the ESWAN parameter values of the two groups. Draw the ROC curve for the different parameters, obtain the area under curve(AUC), and obtain the cut-off value, sensitivity and specificity of the corresponding parameter diagnosis according to the maximum Youden index. P<0.05 indicates that the difference is statistically significant.Results
Measurement consistency between the two observers was good (ICC > 0.75). The R2* value of the ccRCC group was greater than that of the RAMLwvf group, and the FF value was lower than RAMLwvf group, the difference was statistically significant (P <0.05), as shown in Table 1. The AUC value, threshold, sensitivity, and specificity of R2* value and FF value for identifying ccRCC with RAMLwvf groups are 0.893、31.2、91.7%、71.4%and 0.905、6.25、85.7%、83.3%, ROC curve is shown in Figure 2.Discussion
R2* value is the quantitative expression of tissue oxygenation level, that is the transverse relaxation rate, which is positively correlated with the concentration of deoxyhemoglobin in tissues. The R2* value of ccRCC group is higher than that of RAMLwvf group, which may be due to the higher malignant degree of ccRCC, the active cell proliferation state, the increase of cell number per unit volume and the improvement of metabolic level, aggravating oxygen consumption, resulting in the increase of R2* value. IDEAL-IQ technology corrects many mixed factors that interfere with fat quantification, such as T2* attenuation, fat multispectral peak distribution, magnetic field inhomogeneity, T1 relaxation, noise bias and eddy current. Finally, accurate quantitative image fat ratio is generated,which was named FF value. The FF value of RAMLwvf group was higher than that of ccRCC group. Although RAMLwvf contained less fat, the difference between RAMLwvf and ccRCC group was increased by quantitative measurement of FF value, which made it possible to identify the two before operation[3-4].Conclusion
In conclusion, the R2* and FF values of IDEAL-IQ sequence can differentiate ccRCC from RAMLwvf. It is a noninvasive, non enhancement method, and has certain clinical application value.Acknowledgements
Thanks to my dear teacher and all my friends,sincerely.References
[1] Xu Wang, Ge Song, Jihong Sun, et al. Differential diagnosis of hypervascular ultra-small renal cell carcinoma and renal angiomyolipoma with minimal fat in early stage by using thin-section multidetector computed tomography[J]. 2020, 45(prepublish):1-11. [2] Idilman IS,Tuzun A,Savas B,et al. Quantification of liver,pancte-as,kidney,and vertebral body MRI-PDFF in non-alcoholic fatty liver disease[J]. Abdom Imaging,2015,40: 1512-1519. [3] Vuppalanchi R,Chalasani N. Nonalcoholic fatty liver disease and nonalcoholic steatohepatitis:selected practical issues in their evaluation and management[J]. Hepatology,2009,49:306-317. [4] 20 Uygun A,Kadayifci A,Demirci H,et al.The effect of fatty pancreas on serum glucose parameters in patients with nonalcoholic steatohepatitis[J]. Eur J Intern Med,2015,26:37-41.Figures
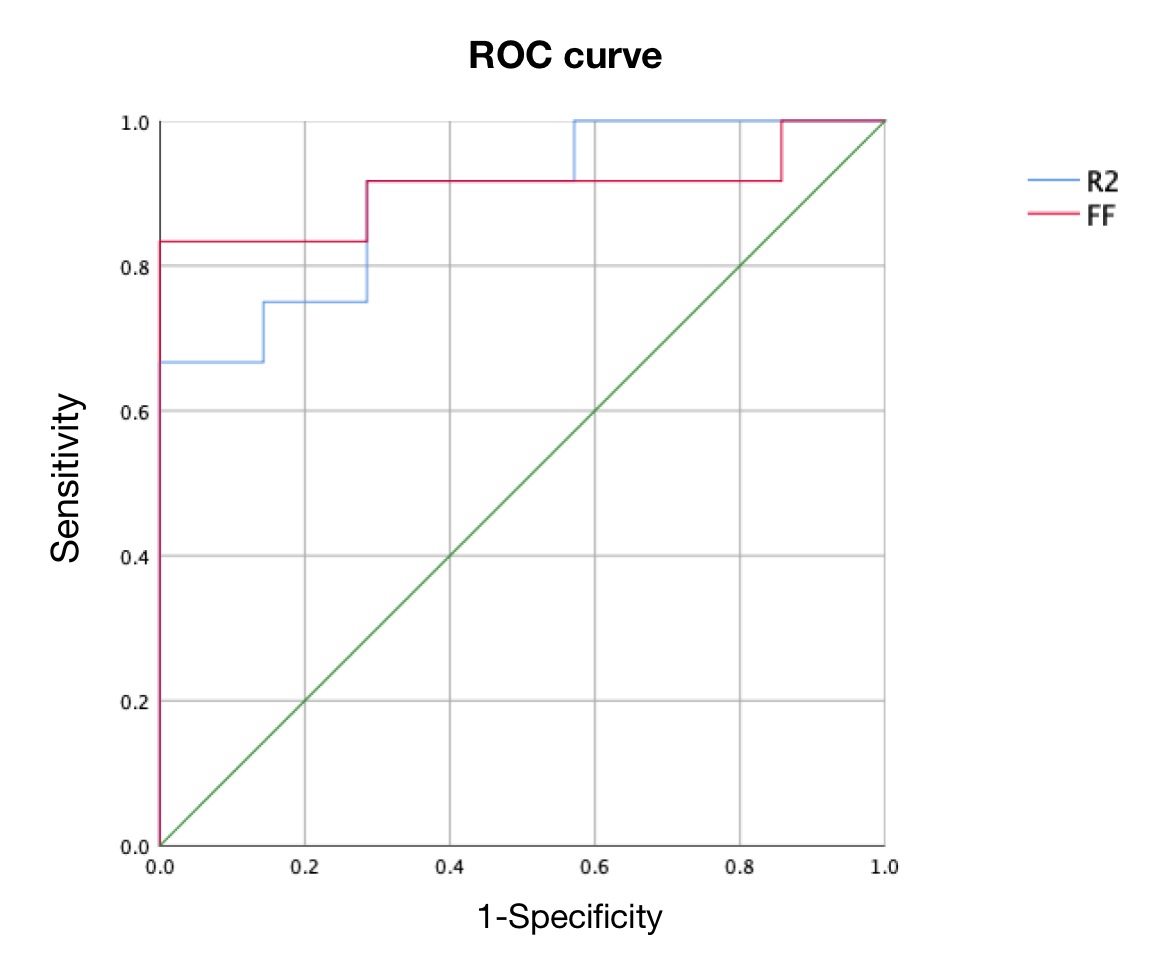
Fig 2.The ROC curve of R2* and FF value to diagnose ccRCC with RAMLwvf.
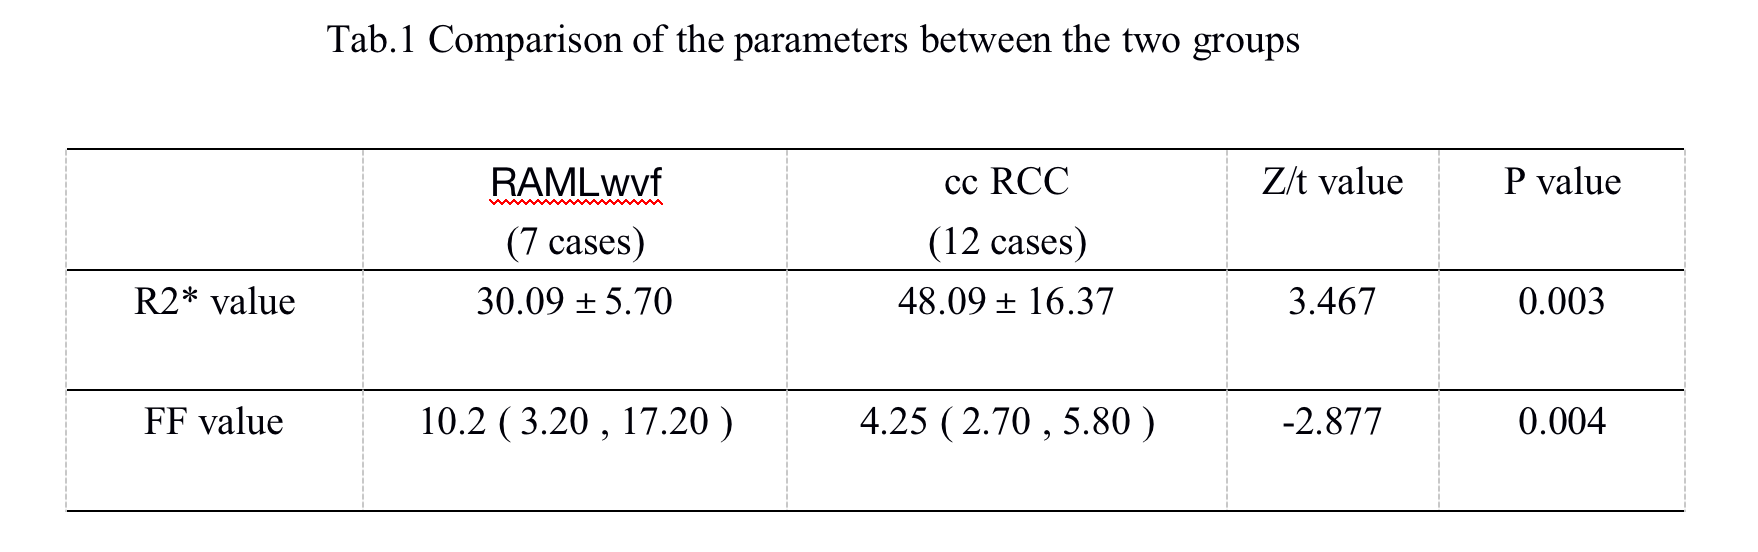
Tab.1 Comparison of the parameters between the two groups
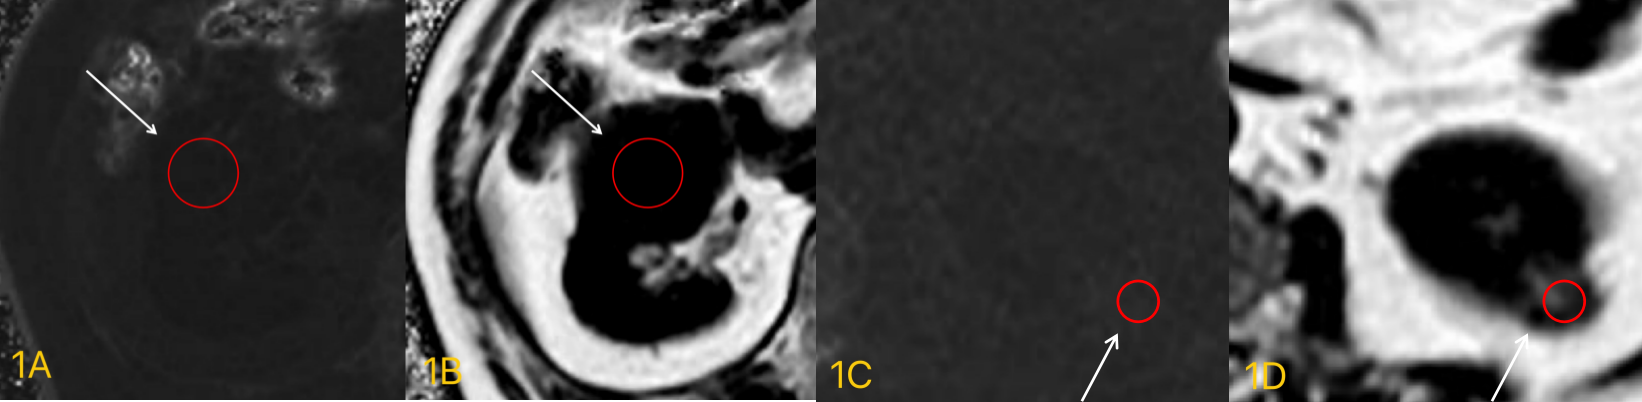
Fig. 1 The ROI placed in focus area. The white arrow
indicated the lesion area. A&B A 55 years old male patient with clear renal
cell carcinoma. A was R2* image,the R2*
value was 19.5Hz. B was FF image,the FF value was 3.7. B&C A
60 years old female patient of renal angiomyolipoma without visible
fat. C was R2* image,the R2* value was 38.7Hz. D was FF image,the FF value was 25.1.