2550
Diffusion Tensor Imaging in the Differential Diagnosis of Clear Cell Renal Cell Carcinoma invasion pelvis and Transitional Cell Carcinoma
Jinghong Liu1, Mingzhe Xu2, Ailian Liu1, Qingwei Song1, Lihua Chen1, Ru Cao1, Weilin Li1, and Juan Ruan1
1Radiology, First Affiliated Hospital of Dalian Medical University, Dalian, China, 2Henan Cancer Hospital, Henan, China
1Radiology, First Affiliated Hospital of Dalian Medical University, Dalian, China, 2Henan Cancer Hospital, Henan, China
Synopsis
Centripetal infiltration into the renal parenchyma often accompanies with the growth of infiltrative RTCC.
Centripetal infiltration into the renal parenchyma often accompanies with the growth of infiltrative RTCC.
Summary of Main Findings
In this study, a higher ADC value was observed in ccRCC group and a higher FA value was observed in RTCC group.Introduction
Distinguishing RTCC from ccRCC grown into renal pelvis may present a diagnostic challenge. DTI reflects diffusion anisotropy of water molecules in tissue, not only it may assess the level of water diffusion, it also may assess the anisotropy of tissue microstructure. To evaluate and compare the use of apparent diffusion coefficient (ADC) and fractional anisortropy (FA) value in differentiating between clear cell renal cell carcinoma (ccRCC) and transitional cell carcinoma (TCC). [1][Key words] Diffusion tensor imaging;Kidney;Clear cell RCC;Renal pelvis;Transition cell carcinoma
Methods
Fifty-five histopathologically proven ccRCC and TCC patient (43 ccRCCs and 12 TCCs), were enrolled in this retrospective study. All patients underwent MRI exams on 1.5T scanner in a protocol containing the routine T1WI, T2WI, LAVA and DTI(b=0, 600s/mm2, in 6 directions). The values of ADC and FA were measured by two radiologists in a double-blind manner. The data from two observers were analyzed using intra-class correlation coefficients (ICC) in assessing inter-observer agreement. If consistent value was obtained, then the average value is used for further statistical analysis. The differences of ADC and FA values between ccRCC and TCC were compared by independent t-test. The ROC curves of all parameters were made to compare the diagnostic value of DTI in differentiating ccRCC and TCC.Results
The inter-observer agreements were good(ICC>0.75). The ADC value of ccRCC was higher than that of TCC(P=0.001), but the FA value of ccRCC was lower than that of TCC(P=0.001). The area under the ROC curve of ADC was 0.805, and a threshold of 1.59×10⁻³mm2/s would yield a sensitivity and specificity of 81.4% and 75.0%. The AUC of FA was 0.752, and a threshold of 0.326 would yield a sensitivity and specificity of 93.0% and 50.0%.Discussion
In this study, a higher ADC value was observed in ccRCC group. Pathologically, the tumor cells of invasive RTCC may be nested and clustered, and interstitial reaction promoting the fibrous connective tissue hyperplasia could occur in between tumor nests[2]. In RTCC leisions, the cells are arranged closely with small extracellular space, and the diffusion of water molecules within the RTCC lesions may be restricted due to interstitial cell hyperplasia. On the other hand, ccRCC is originated from renal tubular epithelial cells and have different pathological features : firstly, the nucleus of ccRCC was smaller than RTCC; secendly, the cytoplasm was abundant in the cell; thirdly, the hemorrhage, necrosis and cystic region were found in the tumor tissue. These factors lead to the fact that the extracellular space of ccRCC is greater than that of RTCC, which may promote the water molecule diffusion.A higher FA value was observed in RTCC group. This is because tumor cells of RTCC grow along the direction of ureteropelvic epithelial arrangement. In addition, interstitial reaction promoting the fibrous connective tissue hyperplasia could occur in infiltrative RTCC. Thus the water molecules in RTCC move with a more consistent direction.
Conclusion
DTI provides directional diffusion information of water molecules in tissue that may reflect tissue microstructure, and the FA value has been shown to be a viable non-invasive biomarker in differentiating between ccRCC and RTCC.Acknowledgements
No acknowledgement found.References
1. Mirka H, Korcakova E, Kastner J, et al. Diffusion-weighted imaging using 3.0 T MRI as a possible biomarker of renal tumors. Anticancer Research, 2015, 35:2351-2357.
2. Yu X, Lin M, Ouyang H, et al. Application of ADC measurement in characterization of renal cell carcinomas with different pathological types and grades by 3.0T diffusion-weighted MRI. European Journal of Radiology, 2012, 81:3061-3066.
Figures
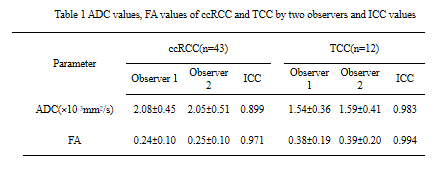
Table 1 ADC values, FA values of ccRCC and TCC by two observers and ICC values.
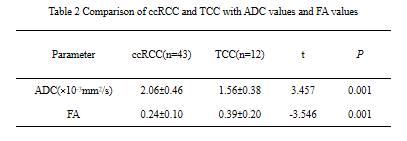
Table 2 Comparison of ccRCC and TCC with ADC values and FA values
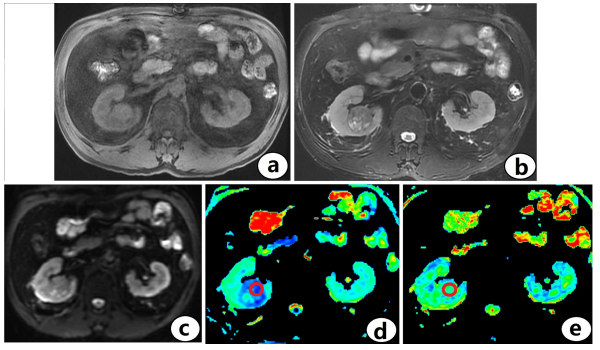
Fig.1. ccRCC a Axial T1-weighted image with ccRCC in the right kidney. b Axial T2-weighted image with ccRCC in the right kidney. c Axial DTI sequence image with ccRCC in the right kidney. d The ADC value of ccRCC in the right kidney was 2.14×10⁻³mm2/s. e The FA value of ccRCC in the right kidney was 0.243.
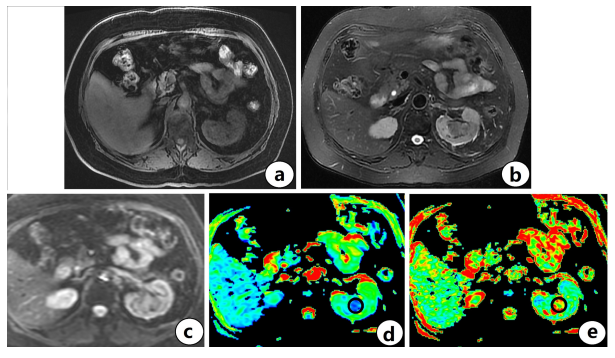
Fig.2. TCC a Axial T1-weighted image with TCC in the left kidney. b Axial T2-weighted image with TCC in the left kidney. c Axial DTI sequence image with TCC in the left kidney. d The ADC value of TCC in the left kidney was 1.46×10⁻³mm2/s. e The FA value of TCC in the left kidney was 0.368.
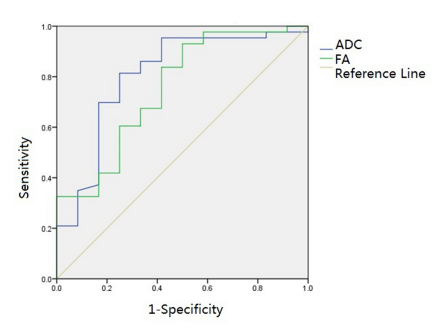
Fig.3. The ROC curves of ADC value and FA value