2548
Comparison of mono-exponential and three non-Gaussian diffusion models in characterizing low- and high-grade clear cell renal cell carcinoma1Northern Jiangsu Province Hospital, Yangzhou, China, 2Shanghai United Imaging Healthcare, Shanghai, China
Synopsis
Accurately assessing the tumor grades of ccRCC patients has a significant impact on the selection of the optimal surgical intervention. This study evaluated the performance of FROC, DK, bi- and mono-exponential diffusion models in differentiating low- from high-grade ccRCCs. A spectrum of diffusion metrics from the four models, reflecting cellularity, vascularity and microstructure complexity, were compared between these two groups. As a result, the diffusion parameters from the FROC model outperformed the other three models in characterizing ccRCC grades. This implied the FROC diffusion model held the potential in renal tumor diagnosis, grading, treatment decision and monitoring for treatment response.
Introduction
Clear cell renal cell carcinoma (ccRCC), one of the most common type of malignant renal carcinoma, accounts for approximately 70% of all renal tumors1. Accurately assessing the tumor aggressiveness has a significant impact on the selection of optimal therapy2. Although conventional diffusion weighted imaging (DWI) has been known as effective imaging tool to detect suspect lesions, it has been challenged for the limited ability to differentiate tumor grades for the overlapped ranges of the diffusion metrics3-5. To overcome the intrinsic limitation of ADC, several non-Gaussian diffusion models such as bi-exponential, DK and FROC have been developed to characterize tumor lesions in the perspective of vascularity and microstructure complexity6-8. To our best knowledge, a systematic comparison of mono-exponential and these non-Gaussian diffusion models has not been reported in the context of differentiating ccRCC grades. The aim of this study is to evaluate the performance of these four diffusion models in distinguishing low- from high-grade ccRCCs.Materials and Methods
A total of 20 patients (10 high-grade, age 50-72 years; 10 low-grade, age 45-65 years) with ccRCCs were included in our study. All MRI examinations were performed on a 3 T scanner (uMR 780, United Imaging Healthcare, Shanghai, China) with a commercialized body phased array coil. MR protocols included conventional T1-weighted imaging (repetition time(TR)/echo time(TE), 3.27/1.45 ms; flip angle, 10°; field of view(FOV), 400 × 300 mm2; matrix, 304 × 205; slice thickness, 5 mm; intersection gap, 10 mm; number of slice, 46), T2-weighted imaging (TR/TE, 1502/80.08 ms; flip angle, 90°; FOV, 380 × 380 mm2; matrix, 288 × 288; slice thickness, 5 mm; intersection gap, 20%; number of slice, 30) and DWI. DWI was performed with a single-shot spin-echo echo planar imaging sequence (SS SE-EPI) with 11 b-values: 0, 20, 50, 100, 300, 500, 800, 1000, 1500, 2000, 3000 s/mm2; TR/TE, 2500/87.5 ms; flip angle, 90°; FOV, 380 × 300 mm2; matrix, 128 × 101; number of slice, 24; slice thickness, 5 mm; intersection gap, 20%; acceleration factor, 2; the acquisition time is about 4 min 45 s. Two renal radiologists manually placed regions of interests (ROIs) on the DWI images of b value=1000 s/mm2, with reference to T2-weigthed images to avoid necrotic and cystic regions. All diffusion metrics from these four models (FROC (Dfroc, β, μ), DK (MK, DK), bi-exponential (Df, Ds, f) and mono-exponential (ADC)) were estimated using MATLAB 2018a (MathWorks, Natick, MA, USA) based on the DWI images with different b-values (bi-exponential (b-value: 0, 20, 50, 100, 300, 500, 800 s/mm2), DK (b-value: 0, 800, 1000, 1500, 2000, 3000 s/mm2) and FROC (all the b-values))6-9.All statistical analyses were performed using software SPSS (version 19, SPSS Inc., IL, USA). Independent student’s t-test was applied to analyze the differences of all imaging parameters derived from four diffusion models between low- and high- grade groups according to the results of normality rest for all metrics. Receiver operating characteristic (ROC) analysis was performed to evaluate the diagnostic performance of the diffusion metrics which were significantly different between two groups. Statistical significance was considered when P < 0.05.
Results
Multiple representative diffusion parametric MR images of patients with low- and high-grade ccRCCs were shown in Fig.1. Table 1 showed the values of the diffusion metrics for low- and high-grade ccRCCs. The distribution of all metrics of ccRCCs with low- and high-grade were displayed with a set of box-and-whisker plots (Fig.2). All the parameters obtained from four diffusion models except f and Df exhibited statistical differences between low- and high-grade ccRCCs. Fig.3 and Table 2 demonstrated the results of ROC analysis for the diffusion metrics in characterizing different tumor groups. Among these parameters, β showed the optimal performance followed by μ, Dfroc, MK, Ds, ADC and MD.Discussion and Conclusion
In this work, we evaluated the role of FROC, DK, bi- and mono-exponential diffusion models for the characterization of ccRCC grades. ADC, Ds, MD and Dfroc values of low-grade ccRCCs were higher compared with high-grade ccRCCs, which might be caused by increased cellularity and decreased extracellular space in low-grade group. In addition, lower β values and higher MK values in high-grade ccRCCs indicating the more heterogeneous and complex environment might result from the larger size and the more irregular appearance of nuclei10 as well as the higher blood vessel density11 in high-grade ccRCCs. The lower μ values in low-grade ccRCCs were also consistent with increased Dfroc as a less restricted environment for water diffusion. Most importantly, ROC analysis showed the better diagnostic performance of μ, Dfroc and β value than other metrics in grading tumors, which demonstrated the more powerful potential of FROC model compared with other diffusion models in distinguishing low- from high-grade ccRCCs.In conclusion, our study showed that FROC diffusion model outperformed the other three diffusion models in discrimination of low- and high-grade ccRCCs, especially the parameter β demonstrating the best diagnostic performance than other parameters. The FROC diffusion model could well characterize ccRCC with different grades and serve as a compliment to the conventional mono-exponential as well as other non-Gaussian diffusion models.
Acknowledgements
No acknowledgement found.References
1. Cheville J C, Lohse C M, Zincke H, et al. Comparisons of outcome and prognostic features among histologic subtypes of renal cell carcinoma[J]. The American journal of surgical pathology, 2003, 27(5): 612-624.
2. Chen D Y T, Uzzo R G. Optimal management of localized renal cell carcinoma: surgery, ablation, or active surveillance[J]. Journal of the National Comprehensive Cancer Network, 2009, 7(6): 635-643.
3. Rosenkrantz A B, Niver B E, Fitzgerald E F, et al. Utility of the apparent diffusion coefficient for distinguishing clear cell renal cell carcinoma of low and high nuclear grade[J]. American Journal of Roentgenology, 2010, 195(5): W344-W351.
4. Woo S, Suh C H, Kim S Y, et al. Diagnostic performance of DWI for differentiating high-from low-grade clear cell renal cell carcinoma: a systematic review and meta-analysis[J]. American Journal of Roentgenology, 2017, 209(6): W374-W381.
5. Cao J, Luo X, Zhou Z, et al. Comparison of diffusion-weighted imaging mono-exponential mode with diffusion kurtosis imaging for predicting pathological grades of clear cell renal cell carcinoma[J]. European Journal of Radiology, 2020, 130: 109195.
6. Le Bihan D, Breton E, Lallemand D, et al. MR imaging of intravoxel incoherent motions: application to diffusion and perfusion in neurologic disorders[J]. Radiology, 1986, 161(2): 401-407.
7. Jensen J H, Helpern J A, Ramani A, et al. Diffusional kurtosis imaging: the quantification of non‐gaussian water diffusion by means of magnetic resonance imaging[J]. Magnetic Resonance in Medicine: An Official Journal of the International Society for Magnetic Resonance in Medicine, 2005, 53(6): 1432-1440.
8. Chen W, Sun H, Zhang X, et al. Anomalous diffusion modeling by fractal and fractional derivatives[J]. Computers & Mathematics with Applications, 2010, 59(5): 1754-1758.
9. Tang L, Zhou X J. Diffusion MRI of cancer: From low to high b‐values[J]. Journal of Magnetic Resonance Imaging, 2019, 49(1): 23-40.
10. Fuhrman S A, Lasky L C, Limas C. Prognostic significance of morphologic parameters in renal cell carcinoma[J]. The American journal of surgical pathology, 1982, 6(7): 655-664.
11. Qian C N, Huang D, Wondergem B, et al. Complexity of tumor vasculature in clear cell renal cell carcinoma[J]. Cancer, 2009, 115(S10): 2282-2289.
Figures
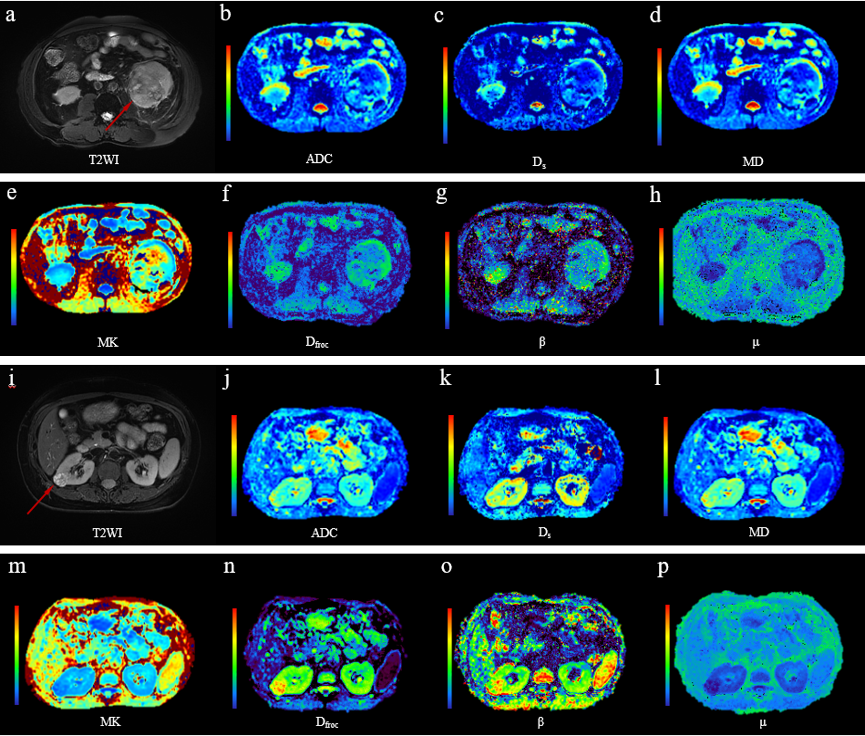


Table 1 Diffusion parameters of low- and high-grade ccRCCs
* ccRCC, clear cell renal cell carcinoma; ADC, apparent diffusion coefficient; Ds, slow diffusion coefficient; Df, fast diffusion coefficient; f, the fraction of fast diffusion; MD, mean diffusivity; MK, mean kurtosis; Dfroc, diffusion coefficient; 𝛽, fractional order derivative in space; 𝜇, a spatial parameter. Data are presented as mean ± standard deviation.
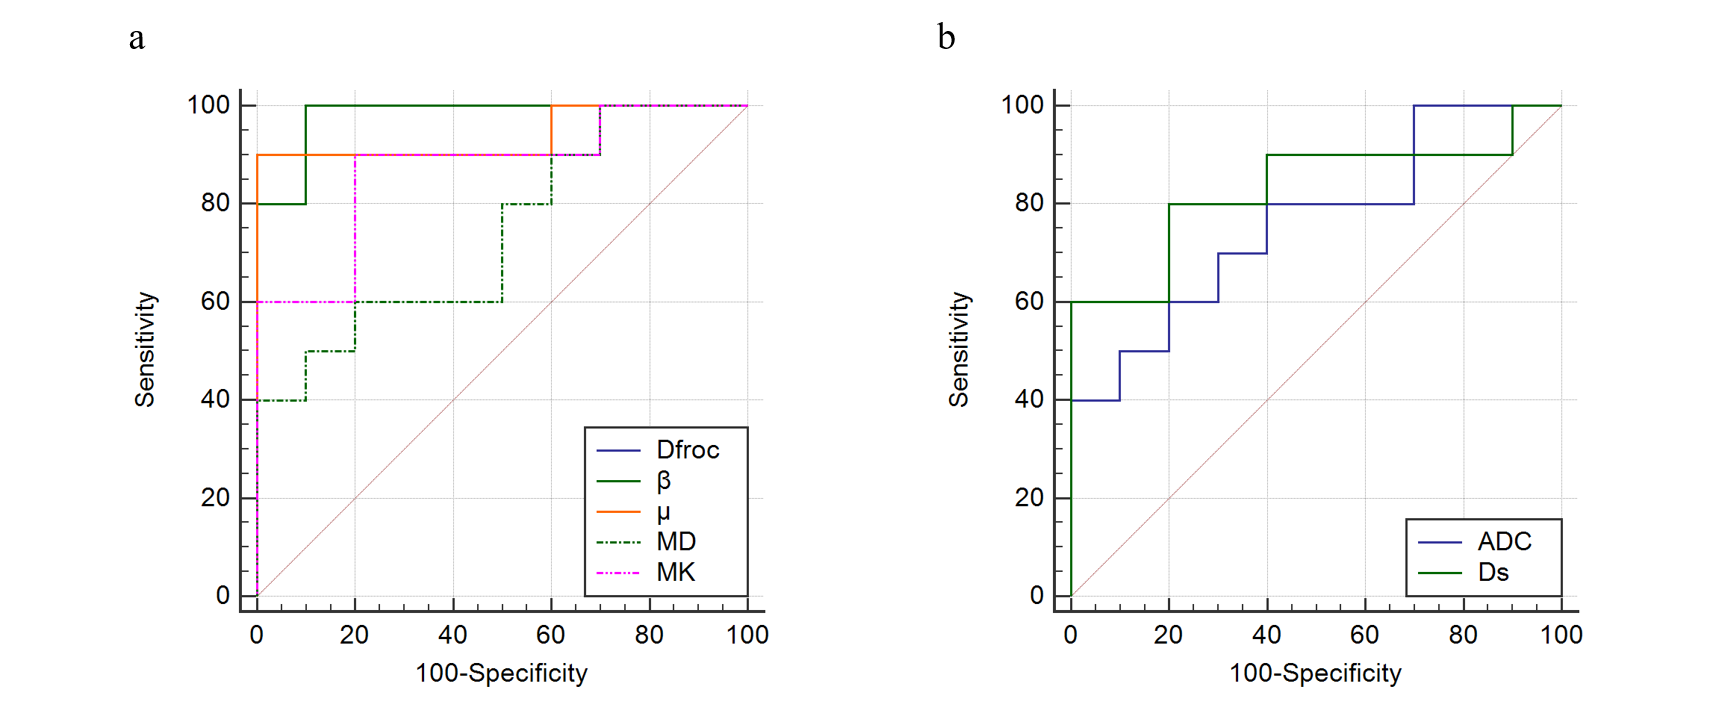

Table 2 Diagnostic performance of diffusion parameters for differentiation of low- from high-grade ccRCCs
* ccRCC, clear cell renal cell carcinoma; AUC, area under ROC curve; ADC, apparent diffusion coefficient; Ds, slow diffusion coefficient; Df, fast diffusion coefficient; f, the fraction of fast diffusion; MD, mean diffusivity; MK, mean kurtosis; Dfroc, diffusion coefficient; 𝛽, fractional order derivative in space; 𝜇, a spatial parameter. Cut off values of ADC, D, MD and Dfroc are presented in 𝜇m2/ms, f, MK and 𝛽 are unitless.