2546
Monitoring Subclinical Renal Injury Progression by Saline-responsive CEST and Quantitative MT Imaging1Department of Bioengineering, University of California, Berkeley, Berkeley, CA, United States, 2Berkeley Preclinical Imaging Core (BPIC), University of California, Berkeley, Berkeley, CA, United States
Synopsis
Standardized blood tests of kidney function lack adequate sensitivity to capture chronic progression of renal injuries. We examined whether saline-responsive urea CEST and quantitative MT imaging can be used to detect mild renal injury development. Upon renal injury progression, the urea CEST contrast decreased in the cortex, and the saline-induced fold change of contrast decreased in the inner medulla and papilla. qMT imaging showed the decrease of semi-solid macromolecule pool in the cortex. These results indicate that the saline-responsive CEST and qMT imaging have a potential to detect subclinical renal injury development.
Introduction
Kidney disease is typically diagnosed via measurement of blood urea nitrogen (BUN) and serum creatinine (SCr). While sensitive to severe kidney dysfunction, these methods lack sensitivity to monitor the progression of renal injuries without an additional biopsy. This prevents quantitation of progressive kidney failure, such as the acute kidney injury-to-chronic kidney disease transition and graft failure after renal transplantation, until 50% of renal function is lost.1 Recently, we demonstrated the use of saline-responsive urea CEST to monitor renal function and underlying disease.2 In this study, we sought to investigate whether this approach can detect pathological changes in kidneys in the setting of mild injury progression. In addition, we also performed quantitative MT (qMT) imaging to detect any development of fibrosis and account for changes in MT.Methods
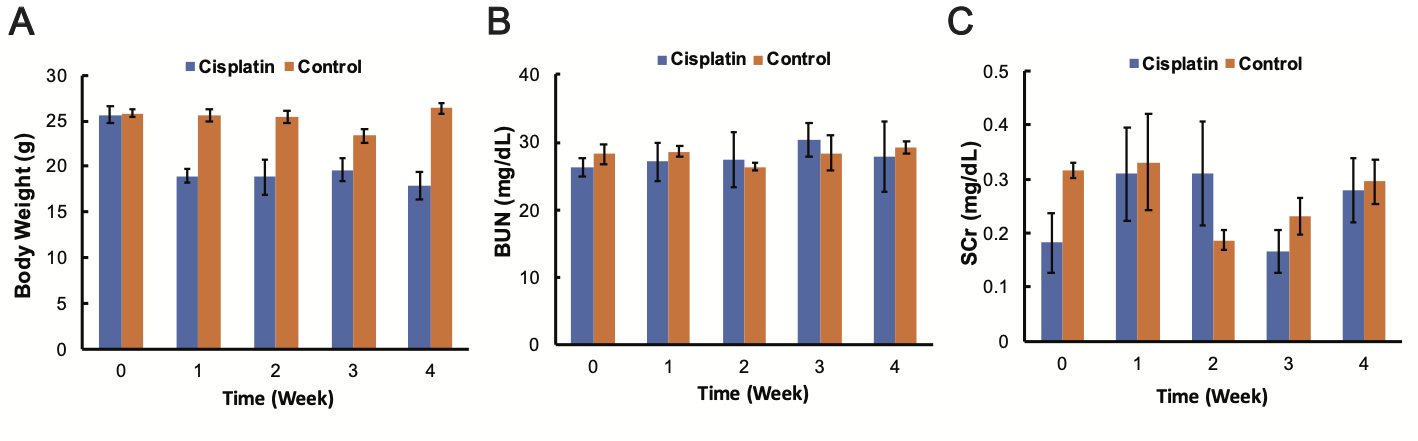
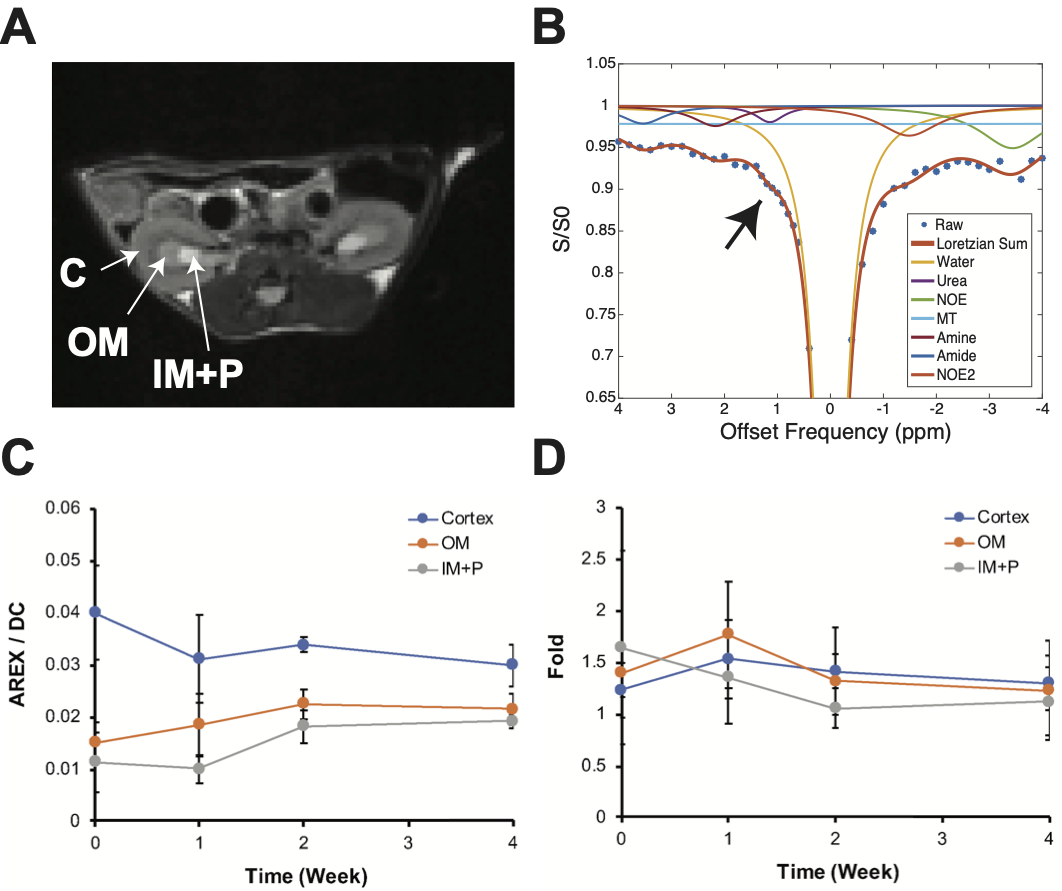
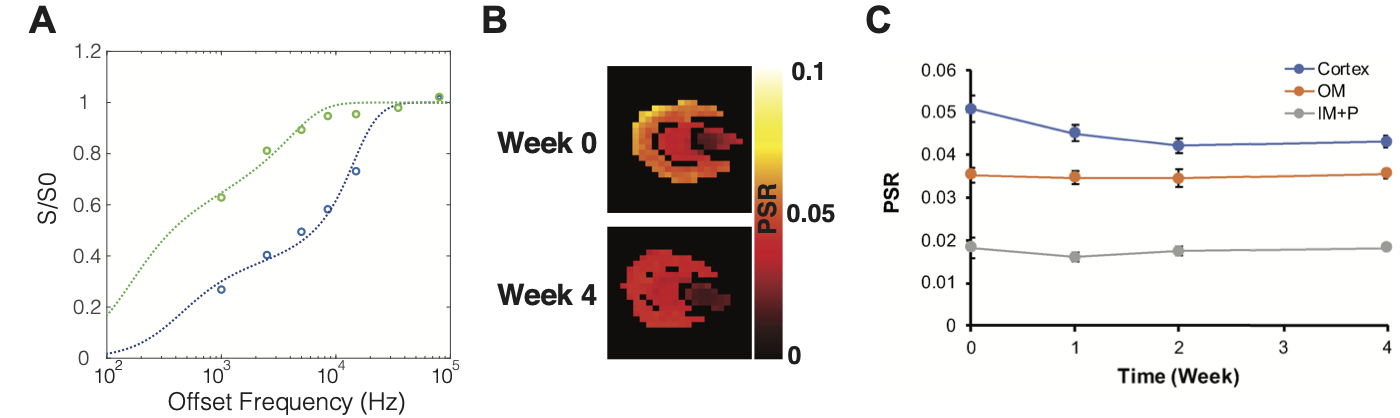
Twelve 10-week-old male C57BL6/J mice were purchased. 7 mg/body weight kg of Cisplatin (Fresenius Kabi, Bad Homburg, Germany) was administered through intraperitoneal injections at weeks 0, 1, and 3 (n = 4). The same amount of saline was injected for the control group (n = 4). Blood was collected every week for measurement of BUN and SCr. The other four mice were injected with Cisplatin with the same dosage and longitudinally scanned at weeks 0, 1, 2, and 4. MR scans were performed at 7T with a 40 mm volume coil (Bruker PharmaScan, Ettlingen, Germany). T2-weighted images (RARE, TR/TE = 2500/52 ms, NA = 2, slice thickness = 2 mm, FOV = 35 x 35 mm), T1 maps (Inversion recovery, TR/TE = 4.3/2.1 ms, 15 TIs from 100 to 8000 ms, Matrix = 128 x 128), CEST Z-spectra (TR/TE = 7.4/3.1 ms, NA = 2, 59 offset frequencies, 70 0.6 μT 50-ms Gaussian sat pulses with DC = 50%, Matrix= 128 x 128) and MT-weighted images (FLASH readout, TR/TE = 24/2.5 ms, flip angle = 7o, NA= 24) at two saturation powers (flip angle = 220o and 820o 10 ms Gaussian pulse) were acquired before and 20 minutes after the infusion of 150 μL saline. B0 and B1 maps were acquired using the water shift and B1 (WASABI) method3 (3.7 μT, 5 ms-long cw sat pulse, the same readout as CEST acquisition, 41 offset frequencies from -2 to 2 ppm). T2-weighted anatomical images were used to segment the kidney into the cortex, outer medulla (OM), and inner medulla and papilla (IM+P; Figure 2A). ROI-averaged CEST Z-spectra were fitted to 7-pool Lorentzian functions (Figure 2B), and voxel-wise qMT data were fitted to two-pool Ramani equation (Figure 3A) as previously described.4 Apparent exchange-dependent relaxation (AREX) method5 was applied to measure the CEST contrast, and the pool size ratio (PSR; the ratio of semi-solid macromolecule pool to free water pool) was measured from the qMT data.Results
Cisplatin induced significant body weight loss compared to the control group, while BUN and SCr did not significantly change over time (Figure 1). CEST measurements revealed the increase of AREX at +1 ppm over time in the OM and IM+P, while the cortex showed a decrease over time (Figure 2C). The infusion of saline induced a 1.6-fold increase of +1 ppm CEST contrast at the IM+P before injecting any cisplatin. This urea-CEST ratio gradually decreased to 1 at week 4 (Figure 2D). qMT spectra and PSR maps showed a decrease of PSR over time in the cortex, while other regions did not show any changes (Figure 3).Discussion
The observed mouse body weight loss despite the preserved BUN and SCr is consistent with previous low-dose Cisplatin models.6,7 Our results show that low-dose cisplatin-induced mild renal injuries that are not detected by clinically used blood tests can be detected by measurement of regional changes in CEST contrast and the urea-CEST contrast ratio following saline infusion. Previous qMT studies on mouse renal fibrosis showed an increase of PSR in the cortex,4 while we observed a decrease over time. This may be due to the fact that we only induced mild injury so that we are observing only an early stage of pathological changes such as tubule dilatation,8 which can contribute to the increase of free water pool and decrease of the semi-solid macromolecular pool. Investigations on more severe renal injury models and histology should be performed to confirm the diagnostic potential of our method.Conclusion
Saline-responsive urea CEST and qMT imaging show the potential of detecting subclinical renal injuries that are not detected by blood tests.Acknowledgements
This study was supported by NIH 1R01HL28592, AHA 19TPA34850040, and NIH UH2EB028908.References
1. Stevens LA, Coresh J, Greene T, Levery AS. Assessing kidney function—Measured and estimated glomerular filtration rate. N Engl J Med. 2006;354:2473-2483.
2. Shin S, Wendland MF, Vandsburger MH. Delayed urea differential enhancement CEST (dudeCEST)-MRI with T1 correction for monitoring renal urea handling. Magn Reson Med. 2020. Online Published.
3. Schuenke P, Windschuh J, Roeloffs V, et al. Simultaneous Mapping of Water Shift and B1 (WASABI)—Application to Field-Inhomogeneity Correction of CEST MRI Data. Magn Reson Med. 2017;77(2):571-580.
4. Wang F, Wang S, Zhang Y, et al. Noninvasive quantitative magnetization transfer MRI reveals tubulointerstitial fibrosis in murine kidney. NMR Biomed. 2019;32(11):1-13.
5. Zaiss M, Xu J, Goerke S, et al. Inverse Z-spectrum analysis for spillover-, MT-, and T1-corrected steady-state pulsed CEST-MRI — application to pH-weighted MRI of acute stroke. NMR Biomed. 2014;27(3):240-252.
6. Garcia JM, Scherer T, Chen J, et al. Inhibition of cisplatin-induced lipid catabolism and weight loss by ghrelin in MALE mice. Endocrinology. 2013;154(9):3118-3129.
7. Katagiri D, Hamasaki Y, Doi K, et al. Interstitial renal fibrosis due to multiple cisplatin treatments is ameliorated by semicarbazide-sensitive amine oxidase inhibition. Kidney Int. 2016;89(2):374-385.
8. Ueki M, Ueno M, Horishita J, Maekawa N. Curcumin ameliorates cisplatin-induced nephrotoxicity by inhibiting renal inflammation in mice. J BioSci Bioeng. 2013;115(5):547-551.
Figures