2545
Mono-exponential, bi-exponential, and kurtosis diffusion-weighted imaging for renal cold ischemia-reperfusion injury in rats1Tianjin First Center Hospital, Tianjin, China, 2First Central Hospital Institute, Tianjin Medical University, Tianjin, China, 3Siemens Healthcare Ltd., Beijing, China, 4Second Hospital of Tianjin Medical University, Tianjin, China, 5Siemens Healthcare GmbH, Erlangen, Germany
Synopsis
Renal dysfunction evaluations after renal cold ischemia-reperfusion injury (CIRI) has important clinical significance for prolonging donor kidney preservation times and improving the survival rates of transplanted kidneys. Diffusion-weighted imaging (DWI) has been accepted for microstructure change evaluations of renal function. In this study, a CIRI rat model was established and compared with a sham-operation group. The value of mono-exponential, bi-exponential, and kurtosis DWI models was compared to evaluate renal changes at different time points after CIRI surgery. The results showed that the bi-exponential and kurtosis models were more sensitive for detecting renal changes compared with the mono-exponential model.
abstract
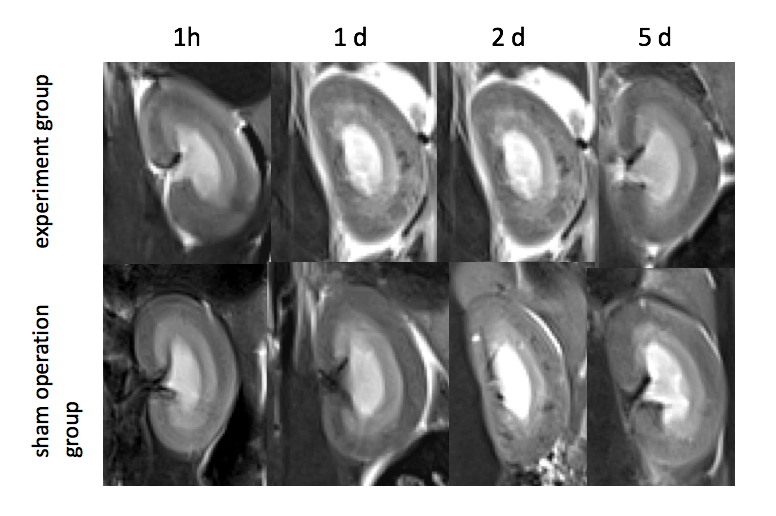
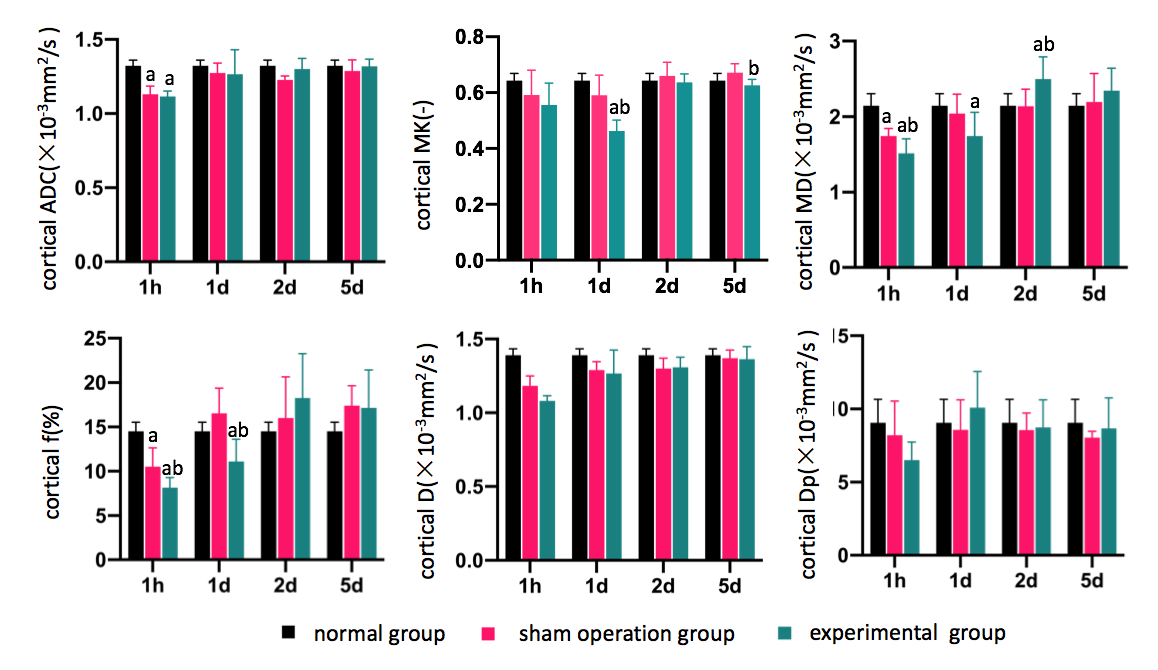
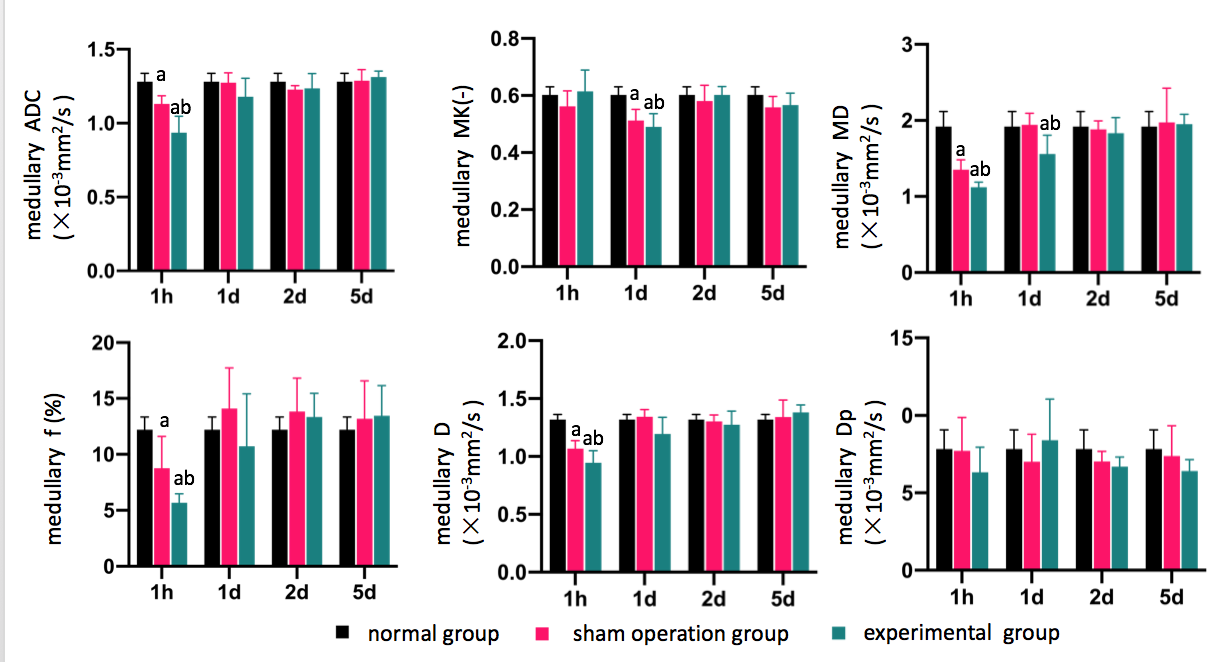
Purpose Renal cold ischemia-reperfusion injury (CIRI) could increase the risk of delayed function and loss of grafts1-2. Multi-b-value DWI imaging can be used to evaluate microstructural renal function changes. This study aimed to investigate the value of different DWI models (including the mono-exponential, bi-exponential, and kurtosis models) based on multi-b-value DWI to evaluate renal microstructural changes in a CIRI rat model, including associated physiologic changes. Materials and Methods Forty male Sprague-Dawley rats with left kidney CIRI (the right kidney was removed) were randomly divided into two groups based on whether the left renal vessels were clipped: the experimental group and sham-operation group (20 rats per group). Five rats in each group were randomly selected for magnetic resonance imaging (MRI) at 1 hour, 1 day, 2 day, or 5 day after surgery. Five healthy rats were added as the control group. The left kidney was resected for morphologic scoring during the pathologic examination. Multi-b-value DWI was performed on a 3T MR scanner (MAGNETOM Prisma, Siemens Healthcare, Erlangen, Germany) with an 8-channel experimental animal coil (Chenguang Medical Technology Co., Ltd, Shanghai, China). Thirteen b-values of 0, 10, 20, 30, 50, 100, 200, 300, 500, 800, 1000, 1500, and 2000 s/mm2 were obtained in three gradient diffusion directions. DWI images were processed and analyzed using prototypic software (MR Body Diffusion Toolbox, Siemens Healthcare, Erlangen, Germany). All b-value images were selected to generate apparent diffusion coefficient (ADC) maps from the mono-exponential model; Ten b-values (0, 10, 20, 30, 50, 100, 200, 300, 500, and 800 s/mm2) were selected to generate parametric maps from the bi-exponential model (real diffusion coefficient, D, false diffusion coefficient, DP, and perfusion fraction, f). Five b-values (0, 500, 1000, 1500, and 2000 s/mm2) were selected to generate parametric maps from the kurtosis model (mean diffusion coefficient, mean kurtosis [MK], mean peak, and mean diffusivity [MD]). The renal cortex and medulla of all rats were measured by two radiologists independently. ANOVA analyses were used to compare the parametric differences among the groups. Spearman correlations were used to analyze the correlations between the renal cortical and medullary MRI parameters and the pathomorphologic scores of each group. Results The renal cortex and medulla were clearly displayed on the T2-weighted imaging (T2WI) images of the experimental and sham operation groups at 1 hour, 1 day, 2 day, and 5 day after the surgeries (Figure 1). The apparent diffusion coefficient (ADC), MD, D, f, and Dp values of the cortex and medulla decreased 1 hour after the experimental group operations in the CIRI rat model. These parameters then increased and gradually tended to stabilize. Cortical MK values decreased at 1 hour and 1 day after the operations and were lower than that at 1 hour after the operations. These values increased 2 days and 5 days after the operations. Medullary MK values increased slightly at 1 hour, decreased significantly at 1 day, and tended to stabilize at 2 days and 5 days after the operations. At 1 hour after the operations, the cortical MD and f values in the experimental group were significantly lower than those in the normal group and the sham-operation group (all P<0.05, Figure 2,3). Medullary MD, D, ADC, and f values were significantly lower than those in the normal and sham-operation groups (all P <0.05, Figure 2, 3). On day 1 after the operations, the cortical MK and f values were significantly lower than those in the normal and sham-operation groups (all P<0.05, Figure 2, 3). Medullary MD and MK were significantly lower than those in the normal and sham-operation group (all P <0.05, Figure 2,3). On day 2 after the operation, cortical MD values were significantly higher than those in the normal and sham-operation groups (P <0.05, Figure 2, 3). The ADC, D, and MD parameters that reflect molecular water diffusion were moderately to strongly correlated (r=0.583~0.627, P <0.05). The f parameter reflects microcirculation perfusion and was moderately to strongly correlated with the MK values (r=0.687, P<0.05), reflecting the degree of water molecule migration. In the experimental group, cortical MD values and medullary MK values were positively correlated with brush border injuries in the renal tubules (r=0.475 and 0.470, respectively, both P<0.05). A moderately positive correlation was seen between the cortical f values and tubulodilation scores (r=-0.465, P<0.05). Discussion and Conclusion According to our results, mitochondrial structural and functional damage, interstitial edema, cortical and medullary water molecule diffusion were obviously limited in the early stages after CIRI. The microcirculation perfusion fraction was also significantly decreased. As renal tubular epithelium and compensation are repaired, cortical MD values recovered the earliest, indicating that molecular water diffusion recovered quickly, especially in the cortex; however, the f value of medulla recovered more slowly. The MD and MK value changes also indicated that the renal tubular epithelial cells could be repaired after CIRI with the repair of damaged structures3. The bi-exponential and kurtosis models can be used to evaluate molecular water diffusion, microcirculation perfusion, and the microstructural changes of renal tissue, detecting the pathophysiologic renal changes of CIRI both quantitatively and noninvasively.Acknowledgements
No acknowledgement found.References
1. Hart A, Gustafson SK, Skeans MA, et al. OPTN/SRTR 2015 Annual Data Report: early effects of the new kidney allocation system[J]. Am J Transplant, 2017,17:543-564.
2. Francis A, Baynosa R. Ischaemia-reperfusion injury and hyperbaric oxygen pathways: a review of cellular mechanisms[J]. Diving Hyperb Med, 2017, 47:110-117.
3. Fattah H, Vallon V. Tubular recovery after acute kidney injury [J]. Nephron, 2018, 140(2): 140-143.
Figures