2543
Values of R2’ mapping on evaluation of renal ischemia-reperfusion injury:an experimental study1The Third Affiliated Hospital of Soochow University, Changzhou, Jiangsu, China, 2GE Healthcare, MR Research, Beijing, China
Synopsis
Ischemia reperfusion injury (IRI) is the main factor that delays the recovery of the renal function and leads to the failure of treatment. To our knowledge, R2’ mapping as a quantitative MRI method may be helpful for assessment of IRI in the early stage. This study compared the R2’ values of outer medulla at different time points in a rabbit model and found significant differences between IRI group and control group. Meanwhile, significant correlation was also found between R2’ values and histopathological features. R2’ mapping can evaluate the dynamic changes of the outer medulla longitudinally.
Introduction
Regulating the duration of renal ischemia is the key point of treatment for ischemia reperfusion injury (IRI) 1,which can effectively protect the organs and improve the success rate. Hypoxia plays an important role in the processing of IRI. R2’ mapping has been reported as an effective method for detecting the changes of oxygen in vivo, which can accurately reflect the deoxyhemoglobin than Blood oxygen level-dependent (BOLD) imaging. Up to date, few studies about R2’ mapping in the IRI of kidney are reported previously 2, 3. Therefore, the purpose of this study is to explore the feasibility of R2’ mapping in evaluating the dynamic changes of IRI in early stage. R2’ values were compared among the five time points, after then the correlation between R2’ values and pathological characteristics was further analyzed.Materials and Methods
Animals52 female New Zealand rabbits were randomly divided into two groups: the control (n = 5) group and IRI (n = 47) group, which were randomly divided into 6 subgroups according to five time points: pre-IRI (n = 8), IRI-1 (n = 8), IRI-12 (n = 8), IRI-24 (n = 8), IRI-48 (n = 8), and IRI-L (n = 7). The rabbits in the pre-IRI, IRI-1, IRI-12, IRI-24, and IRI-48 groups underwent MRI only at the specific time point to which they were randomized, while the rabbits in the IRI-L group and control group underwent longitudinal MRI across the five time points. The rabbits of the IRI groups underwent the left laparotomy, and the left renal artery was clamped for 60 minutes, followed by release of the clamp for reperfusion.
MRI experiments
All experiments were performed at 3.0-T MR scanner (Discovery silent, GE Healthcare, US) with sixteen-channel phase array flexible coil. The MRI sequences and parameters were as follows: (1) Axial T2WI: repetition time (TR)/echo time (TE) = 1811/85 ms, slice thickness (SL) = 4 mm, gap = 1.0 mm, field of view (FOV) = 14 mm×14 mm, matrix size = 256×224, bandwidth (BW) = 31.25 Hz per/pixel, and scanning time= 112 s; (2) Axial T2 mapping: TR = 962 ms, TE = 5.8-49.5 ms, 4 ms interval, a total of 8 echoes, SL = 4 mm, gap = 1.0 mm, FOV = 14mm×14 mm, matrix size = 128×128, BW = 35.7 Hz per/pixel, and scanning time= 241 s; (3) Axial T2* mapping: TR = 700 ms; TE 3.9-27.1 ms, 4 ms interval, a total of 8 echoes, SL = 4 mm; gap = 1.0 mm; FOV= 14 cm×14 cm, matrix size = 128×128; BW = 31.25 Hz /pixel, and scanning time = 104 s.
Data analysis
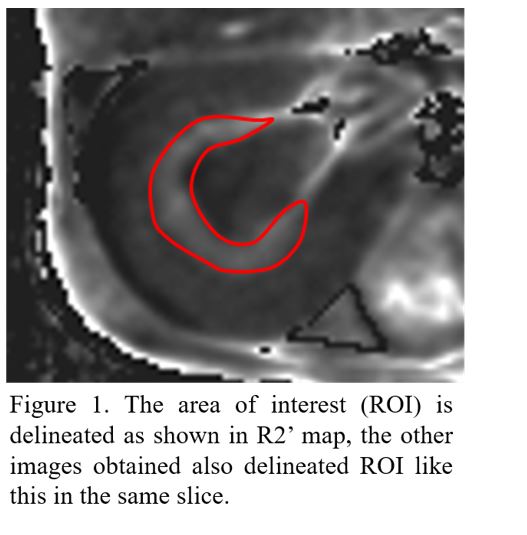
All data were analyzed using vendor-provided mono-exponential model for T2 and T2* evaluation software at GE workstation. R2’ maps were generated by using the following equation: 1/T2’ = 1/T2* - 1/T2, R2’ = 1/T2’ 4, 5. Using the T2-weighted image as reference, the region of interest (ROI) was manually delineated along the margin of the outer medulla on the R2’ map, which avoided bleeding, artifacts and the junction of each zone as possible (Figure 1). Previous studies 6-8 have shown that the effect of ischemia-reperfusion on the outer medulla was the most obvious. Therefore, we only focused on the outer medulla.
Statistical analysis
All statistical analyses were performed in SPSS version 22. The R2’ values were measured and evaluated with repeated measurement analysis of variance. The Spearman correlation coefficient (ρ) was calculated to assess the correlation between R2’ values with histopathological features. P < 0.05 was considered threshold of statistical significance.
Results
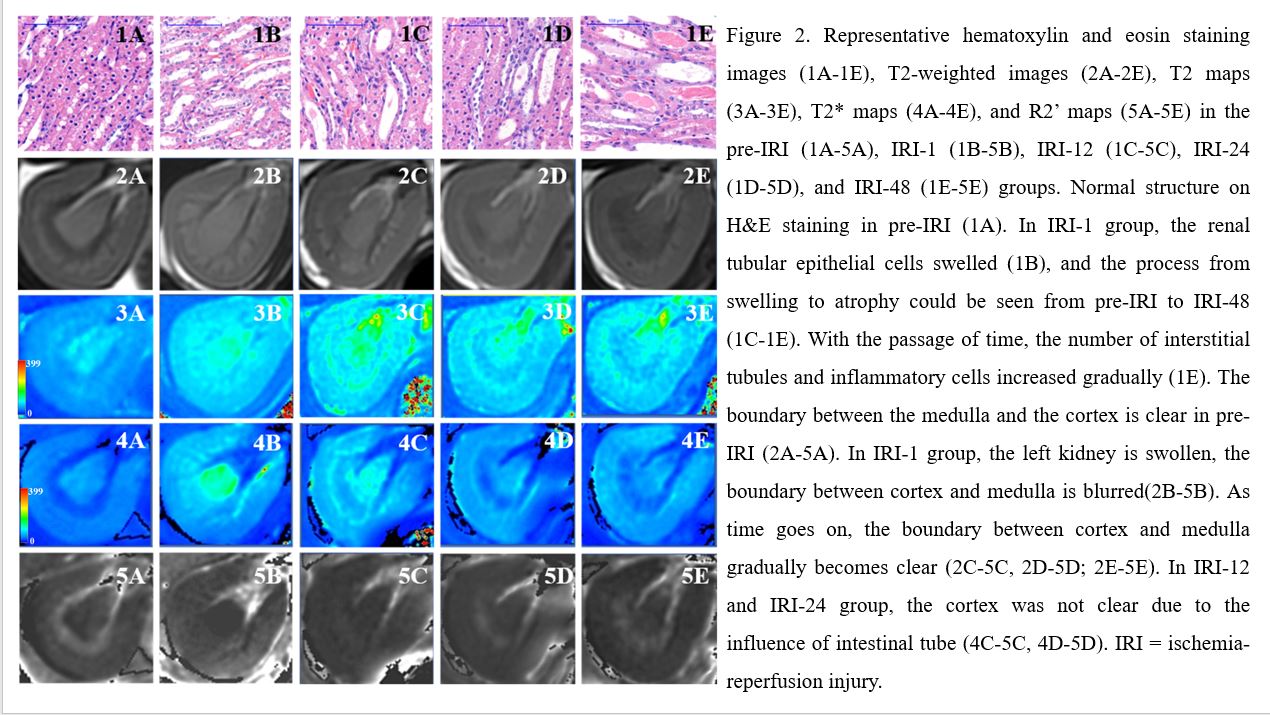
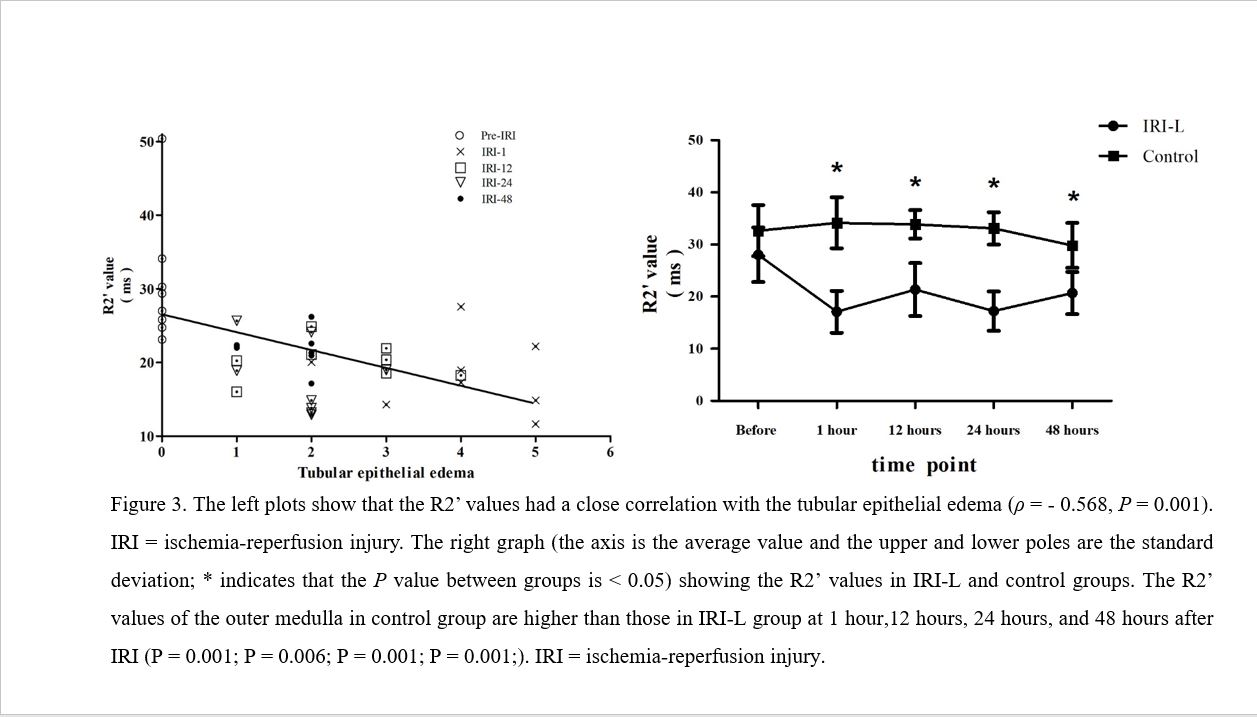
Representative histopathological and MR images for five time points are shown in Figure 2. The R2’ values in the pre-IRI, IRI-1, IRI-12, IRI-24, and IRI-48 groups were 30.60 ± 8.71, 18.35 ± 5.04, 30.16 ± 2.66, 17.81 ± 4.99, and 21.83 ± 2.48 (respectively, P = 0.001). The R2’ values in IRI-L group at 1, 12, 24, and 48 hours after IRI were significantly lower than those in control group (all P < 0.05; Figure 3). In IRI-L group, the R2’ values decreased and reached the bottom at 1 hour after IRI, which increased from 1 hour to 12 hours after IRI, then fell down from 12 hours to 24 hours and 48 hours after IRI. The score of tubular epithelial edema decreased gradually with the development of ischemia reperfusion injury, while tubular epithelial necrosis, interstitial inflammation and cast increased. In addition, the R2’ values were negatively correlated with tubular epithelial edema (ρ = - 0.568, P = 0.001; Figure 3).Discussion
In this study, we mainly demonstrated that the R2’ value in IRI group decreased after IRI and reached the lowest point at 1 hour after modeling, and then increased. Pathological results showed that the renal tubular epithelial edema was most obvious at 1 hour after IRI, and then gradually alleviated. The result is consistent with the previous study 8, 9. This study indicated that the R2’ value of the renal outer medulla was negatively correlated with tubular epithelial edema.Conclusion
R2’ mapping can quantitatively evaluate the dynamic changes of the outer medulla of renal after IRI.Acknowledgements
No acknowledgement found.References
[1] Woo D C, Kim N, Lee D W, et al. Assessing Renal Ischemia/Reperfusion Injury in Mice Using Time-Dependent BOLD and DTI at 9.4 T. Applied Magnetic Resonance, 2015; 46(6): 709-722.
[2] Seiler A, Deichmann R, Pfeilschifter W, et al. T2’-Imaging to Assess Cerebral Oxygen Extraction Fraction in Carotid Occlusive Disease: Influence of Cerebral Autoregulation and Cerebral Blood Volume. PLoS One, 2016;11(8): e0161408.
[3] Wagner M, Magerkurth J, Volz S, et al. T2′‐ and PASL‐based perfusion mapping at 3 Tesla: influence of oxygen‐ventilation on cerebral autoregulation. J Magn Reson Imaging, 2012; 36(6): 1347-1352.
[4] Ghassaban K, Liu S, Jiang C, et al. Quantifying iron content in magnetic resonance imaging. Neuroimage, 2019; 187(77-92).
[5] Wang Y, Zhang R, Zhang B, et al. Simultaneous R2, R2' and R2* measurement of skeletal muscle in a rabbit model of unilateral artery embolization. Magn Reson Imaging, 2019; 61(149-157).
[6] Bonventre J V, Yang L. Cellular pathophysiology of ischemic acute kidney injury. J Clin Invest, 2011; 121(11): 4210-4221.
[7] Munshi R, Hsu C, Himmelfarb J. Advances in understanding ischemic acute kidney injury. BMC Med, 2011; 9(1): 11.
[8] Pan L, Chen J, Xing W, et al. Magnetic resonance imaging evaluation of renal ischaemia-reperfusion injury in a rabbit model. Exp Physiol, 2017; 102(8): 1000-1006.
[9] Pan L, Chen J, Zha T, et al. Evaluation of renal ischemia-reperfusion injury by magnetic resonance imaging texture analysis: An experimental study. Magn Reson Med, 2021; 85(1): 346-356.
Figures