2542
The value of DKI in assessing the pathologic microstructural changes in the early stages of renal cold ischemia-reperfusion injuries1First Central Hospital Institute, Tianjin Medical University, Tianjin, China, 2Department of Radiology, Tianjin First Center Hospital, Tianjin, China, 3MR Collaboration, Siemens Healthcare, Beijing, China, 4MR Application development, Siemens Healthcare GmbH, Erlangen, Germany
Synopsis
This study investigated diffusion kurtosis imaging (DKI) values in evaluating the microstructural changes in the early stages of renal cold ischemia-reperfusion injuries (CIRIs). The results showed that both the mean diffusivity (MD) values and mean kurtosis (MK) values were negatively correlated with the pathologic scores, and the MK values showed more detailed microstructural changes than the MD values.
Introduction
In recent times, an upturn in the kidneys paired donations have significantly increased [1, 2]. Consequently, there is an increase in the specimen abandon rate before transplantation and delayed graft function (DGF) after transplantation due to prolonged cold ischemic time (CIT) [2, 3]. Cold ischemia-reperfusion injuries (CIRIs) are a cascade of reactions caused by cold ischemia, amplified by reperfusion [4]. Diffusion-weighted imaging (DWI) technologies, such as diffusion kurtosis imaging (DKI), quantitatively evaluates the complexity and heterogeneity of tissue microenvironment by measuring the non-Gaussian water molecular diffusion movement in biological tissues, which reflects the pathologic characteristics of different tissues. In this study, a rat cold ischemia-reperfusion injury (CIRI) model was established to explore the DKI values in evaluating the microstructural changes in the early- stage renal CIRIs.Methods
A total of 85 Sprague-Dawley rats were included in this study. The control group included five rats, and the sham-operation group, CIT -1 h, CIT - 2 h, and CIT - 4 h groups had 20 rats in each group. The CIRI model was established using an in -situ perfusion method [5]. In the sham-operation group, left and right renal vessels and abdominal aorta were clearly separated, and the right kidney was resected. Five rats in each group were randomly selected for DKI scans at each time point: 1 hour, 1 day, 2 days, and 5 days after surgery. The scan was performed on a 3T system (MAGNETOM Prisma, Siemens Healthcare, Erlangen, Germany) equipped with an 8-channel experimental special animal coil (Chenguang Medical Technology Co. LTD, Shanghai, China). A single-shot echo-planar imaging DWI sequence was used to acquire the DKI data. The parameters were as follows: TR/TE = 2300/74 ms; FOV = 140 mm × 114 mm; slice thickness = 3 mm; slice gap = 0 mm; matrix = 120 × 98; voxel size reconstructed to 0.6 × 0.6 × 3 mm3; five b-values of 0, 500, 1000, 1500, and 2000 s/mm2 were obtained in three diffusion gradient directions; acquisition time = 3 min 14 sec. DKI images were processed and analyzed using prototypic software (MR Body Diffusion Toolbox, Siemens Healthcare, Erlangen, Germany). The mean diffusivity (MD) and mean kurtosis (MK) value parametric maps were generated. Within 1 hour after scanning, the left kidneys were resected, and the specimen sections were stained with hematoxylin and eosin stain. The pathomorphologic characteristics of the kidneys were scored according to Paller’s criteria [6]. The one-way analysis of variance was used to analyze the differences between different groups at the same reperfusion times, including DKI-derived parameters, laboratory results, and pathologic scores. Pearson correlations were used to test the correlations among DKI parameters, laboratory results, and pathologic gradings.Results
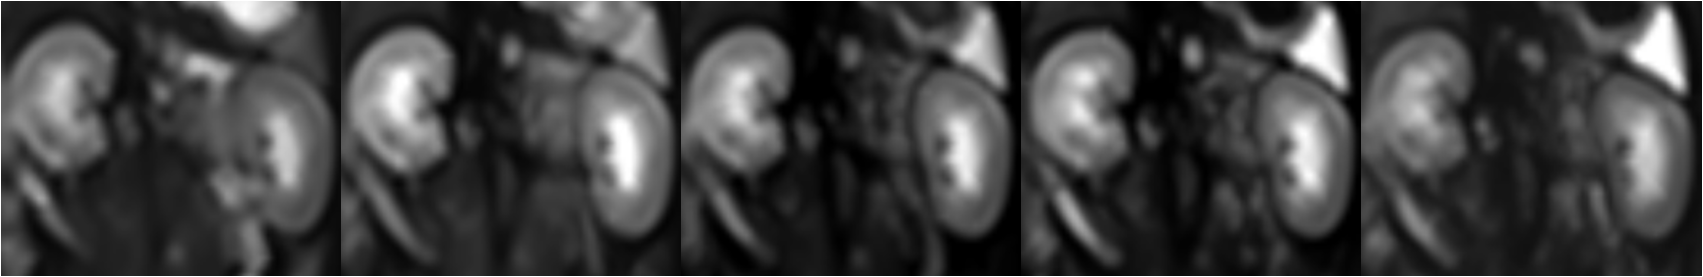
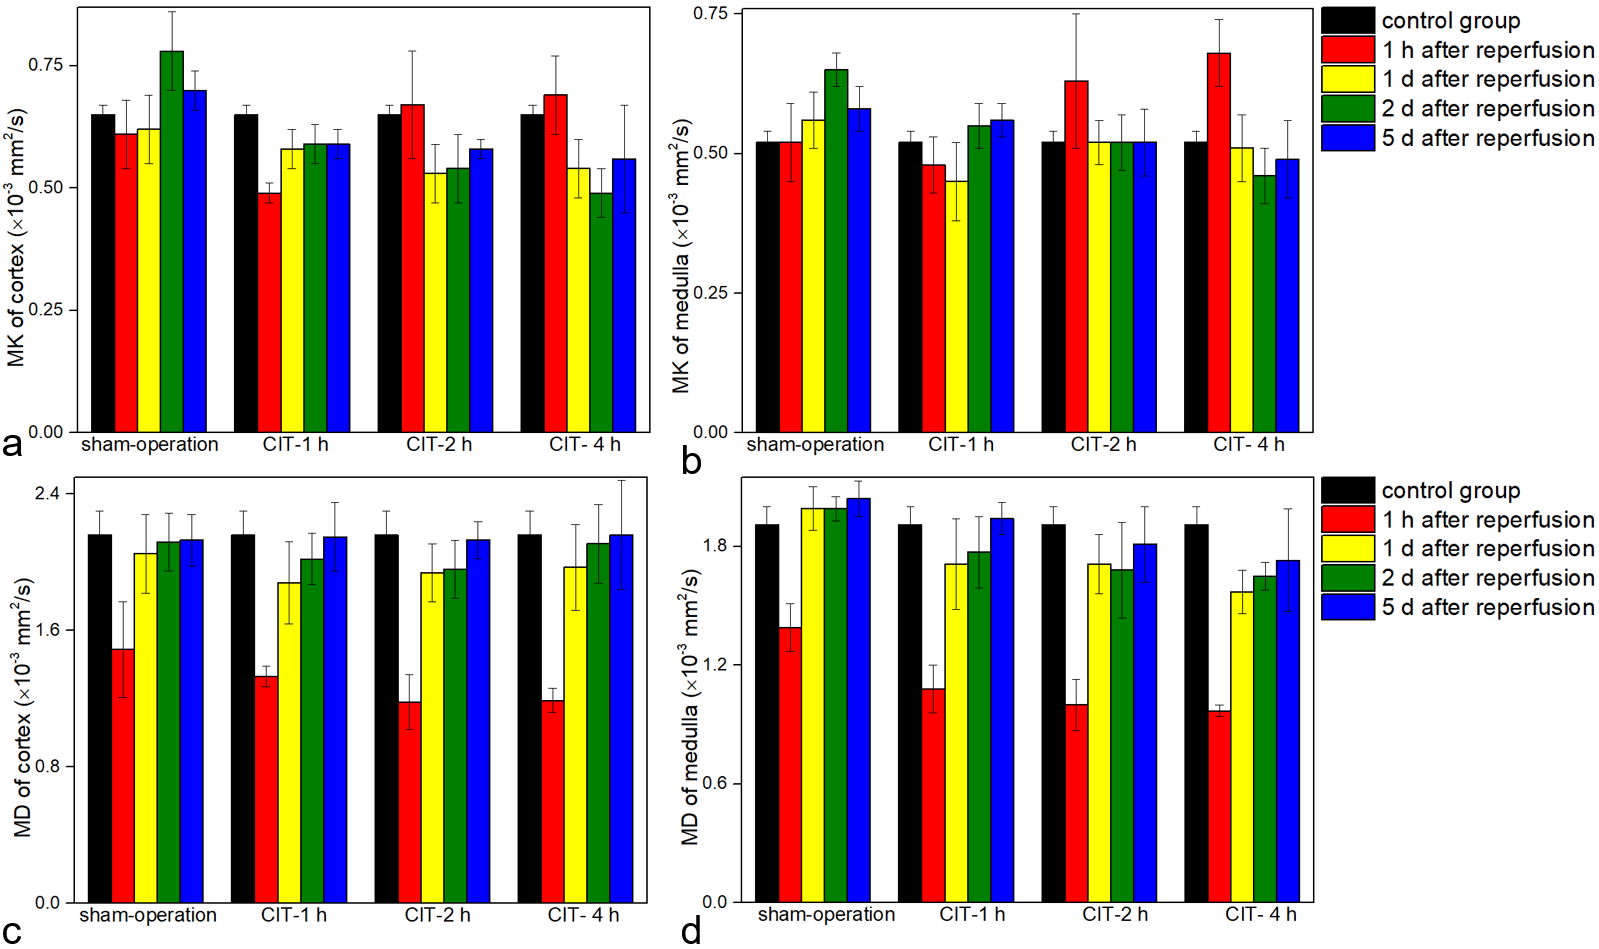
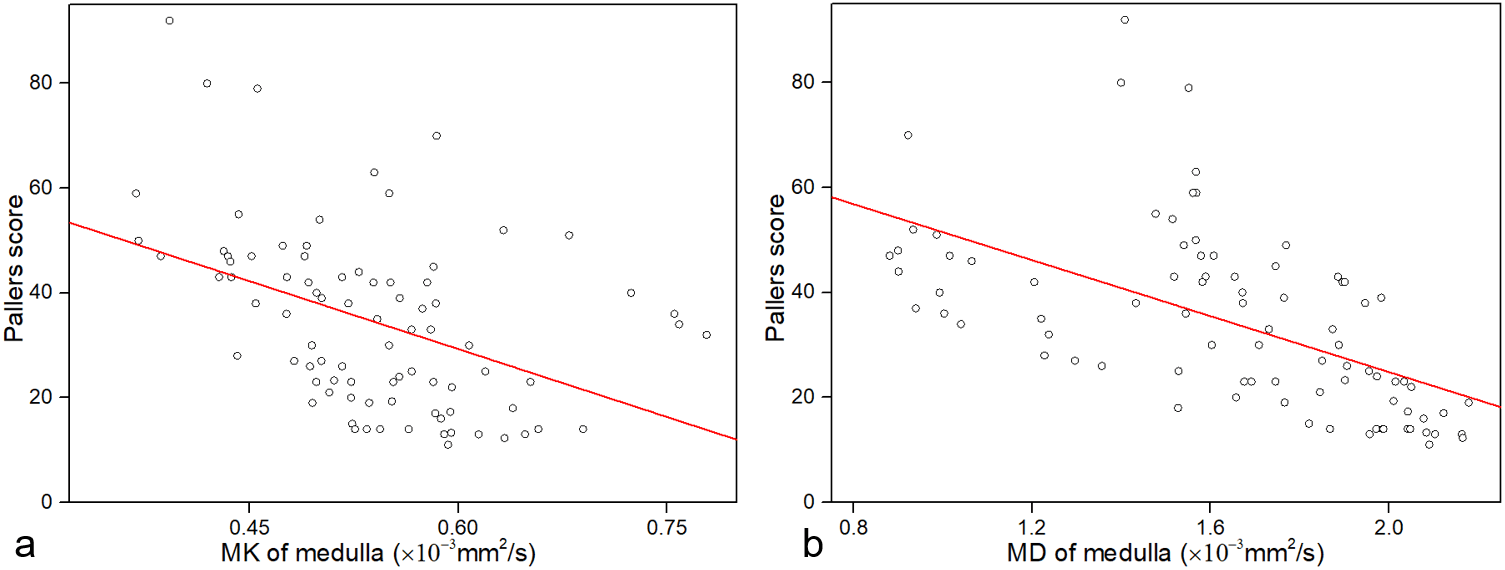
The original images with DKI values of normal rats are shown in Figure 1. The cortical and medullary MD values in the sham-operation group and CIT groups were significantly lower than those of the control group at 1h after reperfusion (all P <0.01), and the MD values gradually increased on 1d, 2d, and 5d after reperfusion (figure 2). The cortical MD values of the sham-operation group, CIT-2h group, and CIT-4h group on 1d, 2d, and 5d after reperfusion were significantly higher than that of the 1h after reperfusion (all P <0.01). The cortical and medullary MK values in the sham-operation group and CIT-1h group were lower than those of the control group at 1 hour after reperfusion (figure 2). The cortical MK values of CIT-1h group were significantly lower than that of the control group at 1h (P <0.01), and gradually recovered on 1d, 2d, and 5d after reperfusion. The cortical and medullary MK values of CIT- 2h group and CIT-4h group at 1h were higher than those of the control group (all P <0.05). The cortical and medullary MK values in the CIT- 2h group and CIT-4h group at 1h were higher than those of the control group (all P <0.05). The MK values decreased at 1 h and then increased 1d, 2d, and 5d after reperfusion. There was a moderate negative correlation between medullary MK values (R = -0.43, P < 0.01) or medullary MD values (R = -0.59, P < 0.05) and total pathologic scores (Figure 3).Discussion
Water diffusion was significantly restricted in the sham-operation and CIT groups at 1h after surgery, caused by renal edema and microstructural injuries. The cortical and medullary MD values began to increase 1 d after surgery, and the recovery was delayed with prolonged CIT. However, with CIT prolongation, the MK values at 1h after surgery were higher than in the normal group and lower than in the control group, which was different from that of the sham operation and CIT-1h group. Moreover, the CIT-4h group failed to return to the normal levels after surgery, suggesting that prolonged CITs resulted in microstructural damage and compensatory repair that were more sensitive than the MD values.Conclusions
DKI can effectively and non-invasively assess the microstructural changes of renal CIRI in the early stages. The MK values reflected microstructural changes more accurately compared with the MD values.Acknowledgements
No acknowledgement found.References
1. Treat, E., et al., Shipping living donor kidneys and transplant recipient outcomes. Am J Transplant, 2018. 18(3): 632-41.
2. Narvaez, J.R.F., et al., Hard-to-place kidney offers: Donor- and system-level predictors of discard. Am J Transplant, 2018. 18(11): 2708-18.
3. Lim, S.Y., et al., Comparison of Recipient Outcomes After Kidney Transplantation: In-House Versus Imported Deceased Donors. Transplant Proc, 2018. 50(4): 1025-8.
4. Ponticelli, C.E., The impact of cold ischemia time on renal transplant outcome. Kidney Int, 2015. 87(2): 272-5.
5. Li, S.D., et al., Cold preservation with hyperbranched polyglycerol-based solution improves kidney functional recovery with less injury at reperfusion in rats. Am J Transl Res, 2017. 9(2): 429-41.
6. Halloran P.F., et al., Delayed graft
function: state of the art, November 10-11, 2000. Summit meeting, Scottsdale,
Arizona, USA. Am J Transplant. 2001.1(2): 115-20.
Figures