2541
T2 mapping in the dynamic evaluation of renal ischemia-reperfusion injury: an animal study1The Third Affiliated Hospital of Soochow University, Changzhou, Jiangsu, China, 2GE Healthcare, MR Research China, Beijing, Beijing, China
Synopsis
This study explored the relationship between the T2 value of the outer medulla and the pathological characteristics of renal ischemia reperfusion injury (IRI) in an animal model. T2 values of the outer medulla increased at 1 hour after IRI and decreased from 1 hour to 48 hours gradually. T2 values of the outer medulla were significantly correlated with pathological score of renal injury, especially with tubular epithelial edema. Based on the findings, T2 mapping might reflect the dynamic changes of renal IRI and be used to assess the renal IRI in the early stage.
Introduction
IRI can occur in various clinical contexts and is the main cause of acute kidney injury (AKI) during the kidney transplantation and cardiac surgery.1, 2 It is found that the time of ischemic injury is crucial to achieve reversible recovery for renal.3 Noninvasive dynamic monitoring of the pathological process of renal IRI is helpful for early recognition and monitoring of IRI, and is essential for improving the quality of life and survival rate of patients.4 In recent years, studies have found that T2 mapping could be used to evaluate the injured kidney.4, 5 However, in previous studies The T2 mapping was primarily used for the chronic changes from days to weeks.5, 6 It remains unknown in the early phase of IRI.7 Therefore, we use T2 mapping to detect the dynamic changes of IRI in the early stage.Methods
Animals: Fifty-six female New Zealand rabbits were randomly divided into the IRI group (n = 48) and the control group (n = 8). Rabbits in the IRI group underwent left renal artery clamping for 60 minutes. Every eight rabbits in the IRI group underwent MRI examinations (axial T2WI and T2 mapping) before renal IRI (pre-IRI group), and at 1 hour (IRI-1 group), 12 hours (IRI-12 group), 24 hours (IRI-24 group), and 48 hours (IRI-48 group) after IRI. The remaining eight rabbits in the IRI group (IRI-L subgroup) and the eight rabbits in the control group underwent longitudinal MRI scanning before the operation and at 1, 12, 24, and 48 hours after IRI.MRI experiment: All experiments were performed on 3.0 T MRI scanner (Discovery Silent, General Electric Healthcare, US) with a sixteen-channel phase array body coil. A multi-echo time fast spin echo-based sequence was applied for T2 measurement.
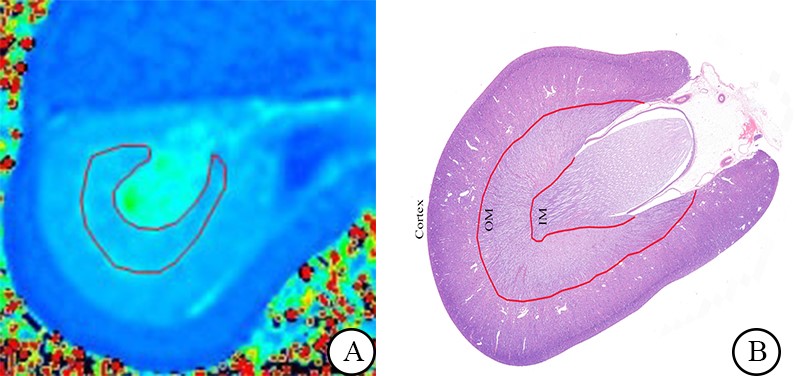
Data analysis: All multi-TE GRE and FSE based data were analyzed using vendor-provided mono-exponential model for T2 evaluation at GE workstation. Axial T2 mapping sequence: TR, 962 ms;TE, 5.8-49.5 ms, 8 echoes; FOV, 14×14 cm2; matrix size, 128×128; slice thickness, 4mm; gap, 1mm; bandwidth, 35.7 Hz/pixel; scan time, 241 s. Two senior radiologists were employed to draw the region of interests independently.
Histological analysis: Axial sections of the left renal hilus were chosen for histological analysis and stained with haematoxylin and eosin. Four histopathological features were assessed using a semi-quantitative scoring scale.
Statistical analysis: All statistical analyses were performed in SPSS version 19.0. The inter-observer and intra-observer reproducibility for T2 measures were assessed using the intraclass correlation coefficient (ICC) with 95% confidence interval (CI). Differences in T2 values among the pre-IRI, IRI-1, IRI-12, IRI-24, and IRI-48 groups were assessed using the nonparametric Kruskal-Wallis test followed by post-hoc pairwise comparisons. The correlation between T2 values and the histopathological features was evaluated by calculating the Spearman correlation coefficient (ρ). Repeated measures analysis of variance was used to compare the T2 differences between the IRI-L and control groups across different time points.
Results
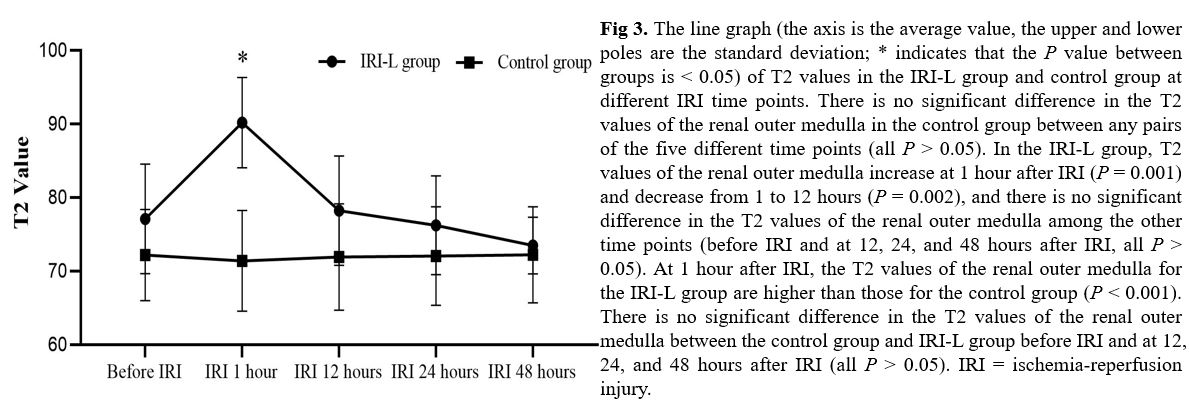
Using ICC analysis, high ICC values were obtained to confirm both the intra-observer (ICC = 0.97, 95% CI 0.95–0.99) and inter-observer reproducibility (ICC = 0.92, 95% CI 0.86–0.96) for T2 measurements. Ensured by reproducible T2 measurements, the renal outer medulla of IRI-1 showed significant higher T2 values than that in the pre-IRI and IRI-48 groups (P < 0.001, P = 0.012). IRI-12 group also showed higher T2 values of the renal outer medulla than pre-IRI group (P = 0.004). Additionally, the T2 values of the renal outer medulla in the IRI group showed significant positive correlation with tubular epithelial edema (ρ = 0.701, P < 0.001). In the IRI-L group, T2 values of the renal outer medulla were increased at 1 hour after IRI (P = 0.001) and fell down from 1 to 12 hours (P = 0.002). At 1 hour after IRI, T2 values of the renal outer medulla were higher in IRI-L group than the control group (P < 0.001).Discussion
In this study, the results demonstrated that T2 values could reflect the dynamic changes of renal IRI. T2 values of the outer medulla increased at 1 hour after IRI and decreased from 1 to 48 hours. T2 values of the outer medulla was correlated with pathological injury score, especially with tubular epithelial edema. Previous studies demonstrated that mapping of the transverse relaxation time T2 allows characterizing changes in tissue composition, particularly in tissue water content.8 T2 mapping offers the potential to quantify tissue damage as shown by Hueper.4 Pohlmann found that there was a strong persistent hypoperfusion in the outer medulla at the early stage of reperfusion (0-100 min after IRI), which resulted in endothelial cell injury and acute cell edema.7 In addition, local hypotension caused by early renal hypoperfusion may lead to medullary vascular leakage and interstitial tissue edema.9 These changes resulted in edema of outer medullary cells and increase of tissue water content.Conclusions
T2 mapping can be helpful for reflecting renal injury noninvasively and monitoring the early changes of the renal outer medulla after IRI dynamically.Acknowledgements
No acknowledgement found.References
[1] Srisawat N, Kellum J A. Acute kidney injury: definition, epidemiology, and outcome. Curr Opin Crit Care, 2011;17(6):548-555.
[2] Zhang J L, Lee V S. Renal perfusion imaging by MRI. J Magn Reson Imaging 2020; 52:369-379.
[3] Bonventre J V. Kidney ischemic preconditioning. Curr Opin Nephrol Hypertens, 2002;11(1):43-48.
[4] Hueper K, Rong S, Gutberlet M, et al. T2 relaxation time and apparent diffusion coefficient for noninvasive assessment of renal pathology after acute kidney injury in mice: comparison with histopathology. Invest Radiol, 2013;48(12):834-842.
[5] Liu X, Murphy M P, Xing W, et al. Mitochondria-targeted antioxidant MitoQ reduced renal damage caused by ischemia-reperfusion injury in rodent kidneys: Longitudinal observations of T2 -weighted imaging and dynamic contrast-enhanced MRI. Magn Reson Med, 2018;79(3):1559-1567.
[6] Pohlmann A, Arakelyan K, Seeliger E, et al. Magnetic Resonance Imaging (MRI) Analysis of Ischemia/Reperfusion in Experimental Acute Renal Injury. Methods in molecular biology (Clifton, N.J.), 2016;1397:113-127.
[7] Pohlmann A, Hentschel J, Fechner M, et al. High Temporal Resolution Parametric MRI Monitoring of the Initial Ischemia/Reperfusion Phase in Experimental Acute Kidney Injury. PLOS ONE, 2013;8(e574112).
[8] Shah B, Anderson S W, Scalera J, et al. Quantitative MR imaging: physical principles and sequence design in abdominal imaging. Radiographics, 2011;31(3):867-880.
[9] Munshi R, Hsu C, Himmelfarb J. Advances in understanding ischemic acute kidney injury. BMC Med, 2011;9:11.
Figures