2540
Ex-Vivo Renal Vascular Dominant Region Mapping using High Resolution 3D-T2w-MRI and Artery-Selective Contrast Injections in Porcine Kidneys1GIfMI, Ghent University, Ghent, Belgium, 2Diagnostic Sciences, Ghent University, Ghent, Belgium, 3Urology, Ghent University Hospital, Ghent, Belgium, 4IBiTech-bioMMeda, Ghent University, Ghent, Belgium, 5Human Structure and Repair, Ghent University, Ghent, Belgium, 6Cancer Research Institute Ghent (CRIG), Ghent University, Ghent, Belgium, 7Radiology, Ghent University Hospital, Ghent, Belgium, 8Nephrology, Ghent University Hospital, Ghent, Belgium, 9Internal diseases and Paediatrics, Ghent University, Ghent, Belgium
Synopsis
During partial nephrectomy (PN), a trade-off between clamping arteries to assure optimal conditions for surgery and maximizing oxygenation to tissue unaffected by the tumor, has to be made. Knowledge of the anatomy of the renal vascular dominant regions, can help optimize this trade-off and thus has the potential to significantly improve PN interventions. We found that high resolution 3D-T2w-MRI scans in combination with artery-selective contrast injections is an effective alternative to ex-vivo kidney casting as it allows for 3D mapping of the renal vascular dominant regions and shows potential for segmentation of the renal vascular tree.
Introduction
Nephron sparing surgery or partial nephrectomy (PN) is the gold standard for small (T-1, < 7cm) renal masses. Clamping the segmental arteries that supply blood to the tumor is crucial as it prevents excessive bleeding. However, prolonged clamping results in ischaemia and thus increases risk of permanent tissue dysfunction. During PN, there is a trade-off between clamping arteries to assure optimal conditions for surgery and maximizing oxygenation to tissue unaffected by the tumor. Knowledge of the anatomy of the renal vascular dominant regions, also known as the parenchymal segments, can help optimize this trade-off and thus has the potential to significantly improve PN interventions. 3D mapping of these segments would allow for preoperative simulation of the surgery but achieving this non-invasively is difficult in clinical practice. Computer-based models can be developed to estimate the vascular dominant regions1. A common method for mapping of the renal vascular tree and the segmental regions, is ex-vivo kidney casting with radiopaque resin and micro CT. However, this method is tedious and destroys the organ in the process. We introduce an alternative method for vascular dominant region mapping using high resolution 3D-T2w-MRI in combination with artery-selective contrast injections.Material & Methods
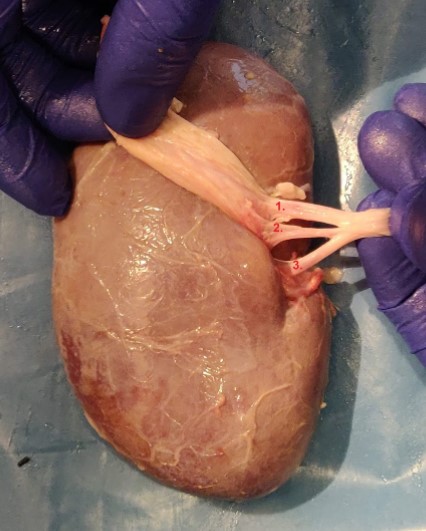
ExperimentsIn initial trials, porcine kidneys were obtained from a local butcher shop. These had several disadvantages: variability in quality of the organs, no exact knowledge of the time interval between resection and scanning, and blood clotting that resulted in occlusion of certain arteries. In further experiments porcine kidneys were recovered from a robotic surgery training facility. These kidneys were flushed with a bolus heparin to prevent blood clotting before being resected from pigs that were euthanized a few hours in advance. For each kidney, the renal fascia and adipose tissue surrounding the kidneys were manually removed and the segmental arteries were identified as shown in Figure 1. To visualize the parenchymal regions, contrast agents were injected into the segmental arteries. For each injection step, a catheter was inserted in one of the segmental arteries while the others were clamped. Two contrast agents were used: water and Gadolinium-doped water. Three grades of signal intensity (SI) were obtained as a result: low SI in the segments where no agent was injected, high SI in the segment where water was injected, and an intermediate SI as Gadolinium decreases signal intensity in T2w images. Rather than injecting preset volumes, the contrast agent was injected until the segment is fully filled. Neighboring segments were injected with differing contrast agents in order to be able to distinguish the segmental regions on the MRI scan. After injecting the selected segmental arteries, the kidneys are placed in a plastic container and submerged in concentrated pineapple juice to prevent air-tissue interface artifacts and reduce background signal2.
MRI Acquisition
3D T2w SPACE imaging was performed using a Siemens 3T PrismaFit. The container was placed in a 64ch headcoil and secured with foam padding. Sequence parameters: TR/TE $$$ 1600/106~ms $$$, Flip angle mode T2var, SPAIR fat suppression, restore magnetization ON. FOV $$$ (285 \times 154)~mm $$$, $$$ (576 \times 330) $$$ matrix resulting in a voxel size of $$$ ( .4 \times .4 \times .6 )~mm $$$. BW $$$457~Hz/pix$$$, Turbo factor $$$47$$$, Echo Train duration $$$288~ms$$$, Echo spacing $$$7.99~ms$$$, $$$4$$$ averages. Total scan time $$$1h30$$$.
Post-processing and image analysis was done in python. This includes segmentation through edge detection of the kidneys, manual segmentation of the parenchymal regions, thresholding and smoothing.
Results
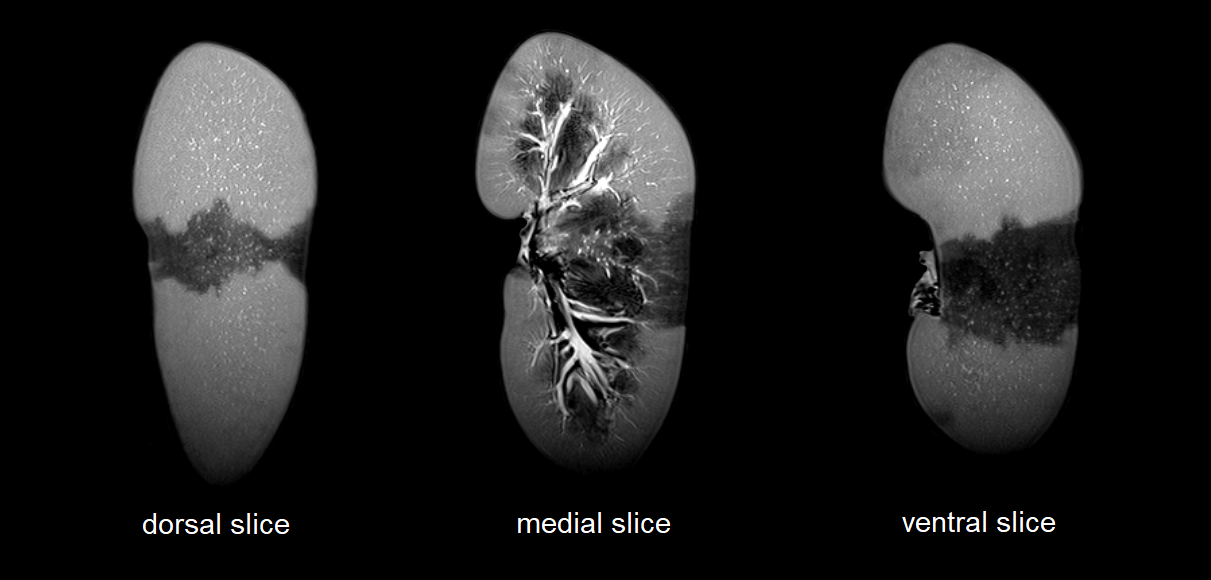
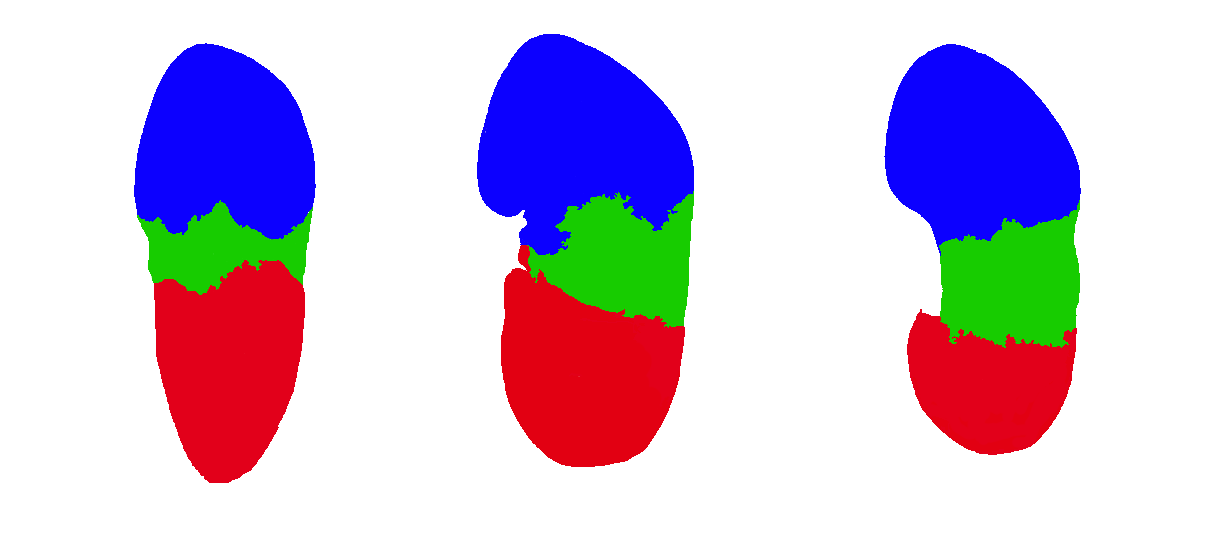
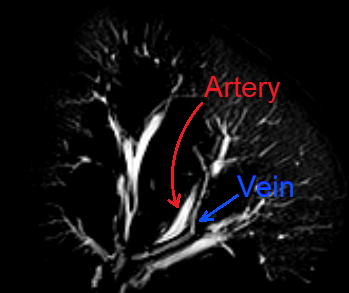
Several porcine kidneys were examined and scanned with different combinations of contrast injections. Figure 2 shows three sagittal slices of an example scan for which three segmental arteries were identified. The upper and lower artery were injected with water while the central one was left without any injection of contrast agent. The segmental regions can clearly be identified, allowing a 3D map to be constructed through manual segmentation as displayed in Figure 3. In addition, the high signal intensity of the renal arteries is sufficient such that these high resolution 3D images allow for segmentation of the primary generations of the renal vascular tree. Figure 4 is obtained through basic thresholding, in which the arteries and veins can be identified. Due to failed clamping, blood clotting and other complications, not all kidneys exhibited sufficient contras to enable mapping of the regions.Discussion
The anatomy of the dominant regions and the amount of segmental arteries showed high degree of variations, this is in line with findings of Sampaio et al.3 The experiments performed thus far primarily function as a proof of concept and an optimization process of our methods. In further study, we plan to systematically inject and scan a large sample size of kidneys under identical conditions with the aim of creating a robust dataset that allows for quantitative and statistical analysis of the regions. In conclusion, this research demonstrates that high resolution 3D-T2w-MRI in combination with artery-selective contrast injections is an effective method for mapping of the renal vascular dominant regions and shows potential for segmentation of the renal vascular tree.Acknowledgements
No acknowledgement found.References
1. Chenglong Wang, Holger R. Roth, Takayuki Kitasaka, Masahiro Oda, Yuichiro Hayashi, Yasushi Yoshino, Tokunori Yamamoto, Naoto Sassa, Momokazu Goto, Kensaku Mori, "Precise estimation of renal vascular dominant regions using spatially aware fully convolutional networks, tensor-cut and Voronoi diagrams", Computerized Medical Imaging and Graphics, Volume 77, 2019,101642, ISSN 0895-6111, https://doi.org/10.1016/j.compmedimag.2019.101642.
2. Alshehri, Fahad Mohammed Ali. “Comparative study of pineapple juice as a negative oral contrast agent in magnetic resonance cholangiopancreatography”. Journal of clinical and diagnostic research : JCDR vol. 9,1 (2015): TC13-6. doi:10.7860/JCDR/2015/10240.5463
3. Pereira-Sampaio, Marco & Favorito, Luciano & Henry, Robert & Sampaio, Francisco. (2007). "Proportional Analysis of Pig Kidney Arterial Segments: Differences from the Human Kidney". Journal of endourology / Endourological Society. 21. 784-8. 10.1089/end.2006.0318.
Figures