2536
Evaluation of renal function in healthy volunteers and patients with chronic kidney disease by using APT weighted imaging and R2* mapping1First Affiliated Hospital of Dalian Medical University, Dalian, China, 2Philips Healthcare, Beijing, China, 3Dalian Medical University, Dalian, China
Synopsis
Amide proton transfer (APT) and mDixon - Quant techniques have been applied in clinical work, However, there was no study on the degree of renal damage in chronic kidney disease (CKD). We discussed the value of APT combined with R2* to assess the degree of renal damage.
Synopsis
Amide proton transfer (APT) and mDixon - Quant techniques have been applied in clinical work, However, there was no study on the degree of renal damage in chronic kidney disease (CKD). We discussed the value of APT combined with R2* to assess the degree of renal damage. The AUC, sensitivity and specificity of APT combined R2* were 0.925, 88% and 100%, respectively. The combination of APT and R2* can improve the diagnostic ability of discriminating CKD from HVs, which has certain clinical application value.Introduction
Chronic kidney disease (CKD) is a chronic progressive renal structural and functional damage disease, which could easily develop into end-stage renal disease (ESRD) due to high concealment[SP1] . Therefore, it is urgent to develop new clinical inspection methods for CKD. Amide proton transfer weighted (APTw) imaging is a novel contrast-agent-free MRI technique for detection of amide protons in mobile cellular proteins and peptides[SP2] . Proton relaxation properties are sensitive to structural alteration of tissues. In this study, we evaluate the performance of the joint use of APTw and R2* mapping (derived from mDixon-Quant technique, Philips Healthcare) on the diagnosis of CKD.Methods
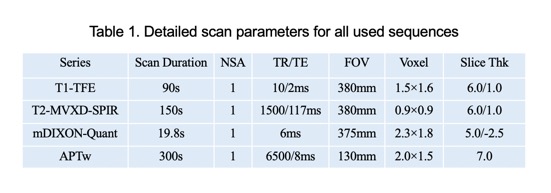
30 patients with chronic kidney disease (CKD) were recruited in this sduty, who underwent 3.0T MRI (Ingenia CX, Philips Healthcare, the Netherlands[SP1] ) examinations in our hospital from August 2019 to October 2020 (15 men, 15 women; mean age,47.1±15.5 years; range, 19-75 years) and 22 healthy volunteers (HVs) (5 men, 17 women; mean age, 33.7±11.6 years; range, 24-60 years). With the consent of volunteers and patients, APTw and mDixon-Quant were scanned after routine clinical MR protocols. Detailed scanning parameters were listed in Table 1. According to glomerular filtration rate, all CKD patients were divided into mild renal damage (mRD) group (15 cases) and severe renal damage (sRD) group (15 cases). All data were postprocessed on IntelliSpace Portal (Philips Healthcare). The region of interest (ROIs) were manually drawn on the renal cortex and medulla in three slices (the slice covering the largest dimension of kidney and its adjacent upper and lower slices) on the right kidney with reference to the fused T2w images. The area of ROIs about 5–7 mm2, excluding renal sinus, large blood vessels and perirenal tissue. Data were analyzed on SPSS 21.0 statistical software (IBM). Mann-Whitney U test was used to compare the difference in renal cortex and medulla R2* between the control group and the CDK groups. Diagnosis performances were evaluated by receiver operating characteristic (ROC) analysis.Results
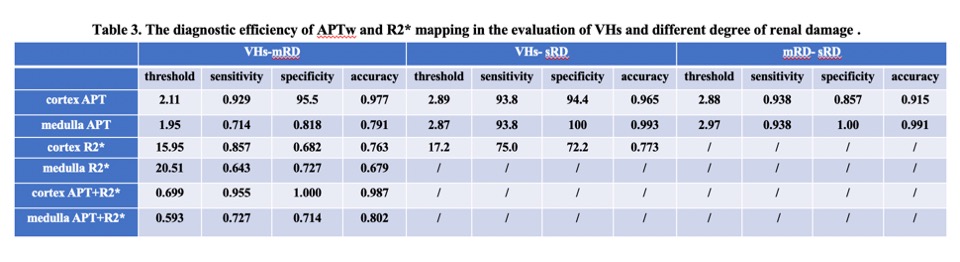
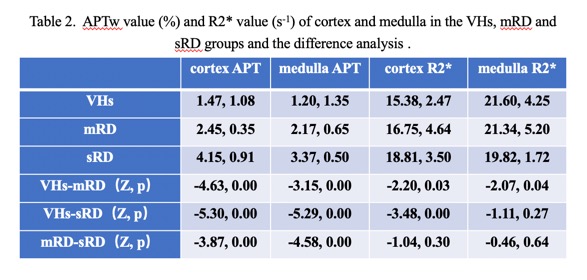
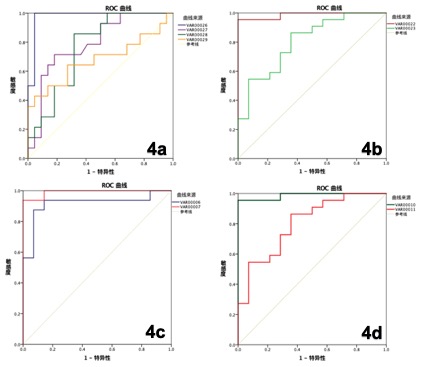
1. The APT values of cortex and medulla were highest in the sRD groups, while lowest in the VHs groups. The differences were statistically significant (P < 0.05, Table 2). The values of R2* of cortex increased as the renal injury became more serious (P < 0.05), whereas the values of R2* of medulla did not show statistical difference (Table 2 ). 2. The results of ROC curve analysis showed that APTw values of cortex and medulla had high diagnostic efficiency in evaluating renal function of different degrees of renal damage, while R2* value of cortex had better diagnostic efficiency in evaluating renal function of VHs and mRD, while R2* value of medulla had general diagnostic efficiency in evaluating renal function of VHs and mRD. Combined with cortical medullary APT value and R2 * value improved the diagnostic efficiency of renal function in VHs and mRD. (Table 3)Conclusion and discussion
APT value was affected by the changes of protein concentration and pH value (4). In this study, we found that the apt value of cortex and medulla increased with the severity of renal damage, which may be due to the protein transport in the kidney and the change of renal pH value. The R2* values of cortex in mild and severe renal damage group were significantly higher than those in control group, indicating that renal cortex of CKD patients was relatively hypoxia, and the degree of hypoxia gradually increased with the severity of renal damage. The R2* value of medulla in mild renal damage group was higher than that in control group, indicating that the medulla of mild renal damage was relatively oxygen deficient. However, the R2* value of cortex in severe renal damage group was lower than that in mild renal damage group. The mechanism is not clear, It may be due to edema of some renal parenchyma with increased water content in severe renal damage. Besides the concentration of deoxyhemoglobin, the R2* value is also affected by tissue water content, blood volume, hematocrit and capillary distribution. The combination of apt and R2* can improve the efficiency of evaluating the degree of renal damage in patients with chronic kidney disease, which has certain clinical application value.Acknowledgements
No acknowledgement found.References
1. Zhou J, Heo HY, Knutsson L, et al. APT-weighted MRI: Techniques, current neuro applications, and challenging issues.J MagnReson Imaging. 2019; 50(2):347-364.
2. Li B, Sun H, Zhang S, et al. Amide proton transfer imaging to evaluate the grading of squamous cell carcinoma of the cervix: A comparative study using 18F FDG PET. Magn Reson Imaging: 2019, 50(1): 261-268.
3. Takayama Y, Nishie A, Sugimoto M, et al. Amide proton transfer (APT) magnetic resonance imaging of prostate cancer: comparison with Gleason scores. MAGMA. 2016, 29(4): 671-679.
4. Ray KJ, Simard MA, Larkin JR, et al. Tumor pH and Protein Concentration Contribute to the Signal of Amide Proton Transfer Magnetic Resonance Imaging. Cancer Res 2019; 79: 1343-1352.
Figures