2535
Native T1 mapping in assessment of kidney fibrosis in patients with chronic glomerulonephritis1Affiliated Hospital of Nantong University, Nantong, China, 2GE Healthcare, MR Research China, Beijing, China
Synopsis
119 patients with chronic glomerulonephritis (CGN) and 19 healthy controls (HCs) were recruited in this study. Among these patients, 43 patients had kidney biopsy. Patients underwent a native renal T1 map examination within 1 week before kidney biopsy. Clinical information and biopsy pathological scores were collected. Compared to HCs, the T1 values of renal cortex in CGN patients were significantly higher and well correlated with renal function, chronic kidney disease (CKD) stage and renal fibrosis. Therefore, native T1 mapping has demonstrated good diagnostic performance in non-invasive detection of CGN fibrosis.
Introduction
Evaluation of kidney fibrosis is essential for understanding the kidney conditions, determining the prognosis and deciding treatments1. Kidney biopsy is currently the gold standard for fibrosis evaluation, but it has the disadvantages of invasiveness, difficulty in repetition, and limitation in tissue sampling2. T1 mapping as a quantitative MRI technique is able to reflect the degree of tissue fibrosis and might be an alternative approach. Previously proposed T1 mapping techniques are developed based on a variety of physical models, include the modified looker-locker inversion-recovery (MOLLI), variable flip angle model and so on3-4. While good results were obtained, apparent but not native T1 mapping or less reproducible T1 mapping were reported using these methods. In comparison, a so called SMART (single-point saturation-recovery FIESTA acquisition), has been proposed for native T1 acquisition with high accuracy, repeatability and lower variability5. However, the application of SMART for native T1 mapping are still limited on grading kidney fibrosis in CGN. Therefore, this study aimed to investigate the feasibility of native T1 mapping of renal cortex in assessing renal function and kidney fibrosis in CGN patients.Materials and Methods
Subjects19 healthy controls (HCs) and 119 patients with chronic glomerulonephritis chronic glomerulonephritis (CGN) were recruited, of which 43 patients underwent kidney biopsy. The clinical indexes and pathological scores of biopsy were collected. Renal interstitial fibrosis (IF) was divided into high (>50%), medium (25-50%), low (<25%) and no (0%) fibrosis groups6.
MRI experiment
SMART T1 examination was performed within one week before kidney biopsy. The applied scan parameters were of slice thickness = 5 mm, spacing = 1 mm, the number of slices = 8, field of view = 32*32cm2, matrix = 192×128, number of excitations (NEX) = 1 and acceleration factor = 2. Respiration trigger was also adopted. The scan time was 2 minutes.
Data analysis
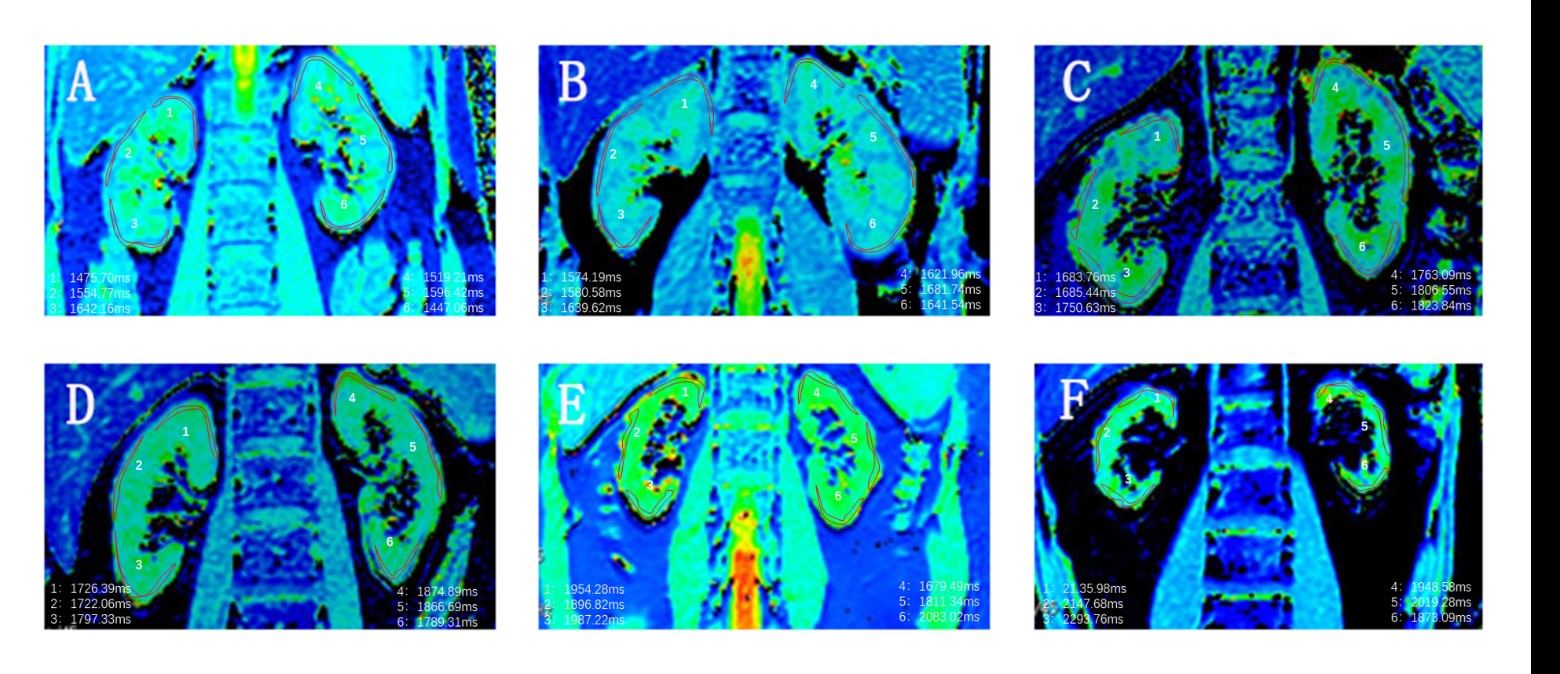
Using a vendor-provided postprocessing software in the GE workstation, the coronal renal T1 maps were automatically generated. On the resultant T1 maps, three regions of interest (ROI)s were manually drawn on the upper, middle, and lower part of renal cortex by a senior radiologist (Fig.1). The corresponding T1 values of three renal sub-regions were obtained for statistical analysis.
Statistical analysis
SPSS 25.0 software was used to analyze the data statistically. Differences between CKD and HC groups were assessed using one-way analysis of variance with Bonferroni correction for multiple comparisons. Differences between groups with different degrees of fibrosis were assessed using rank sum test. A Pearson or Spearman correlation coefficient (normality test dependent) assessed the relationship between T1 values and clinical indexes or between T1 values and pathological scores. Univariate and multivariate logistic regression analysis were utilized to find the relevant risk factors of renal fibrosis; receiver operating characteristic (ROC) curve was used to evaluate the ability of T1 value for the diagnosis of renal fibrosis. P<0.05 was considered statistically significant.
Results
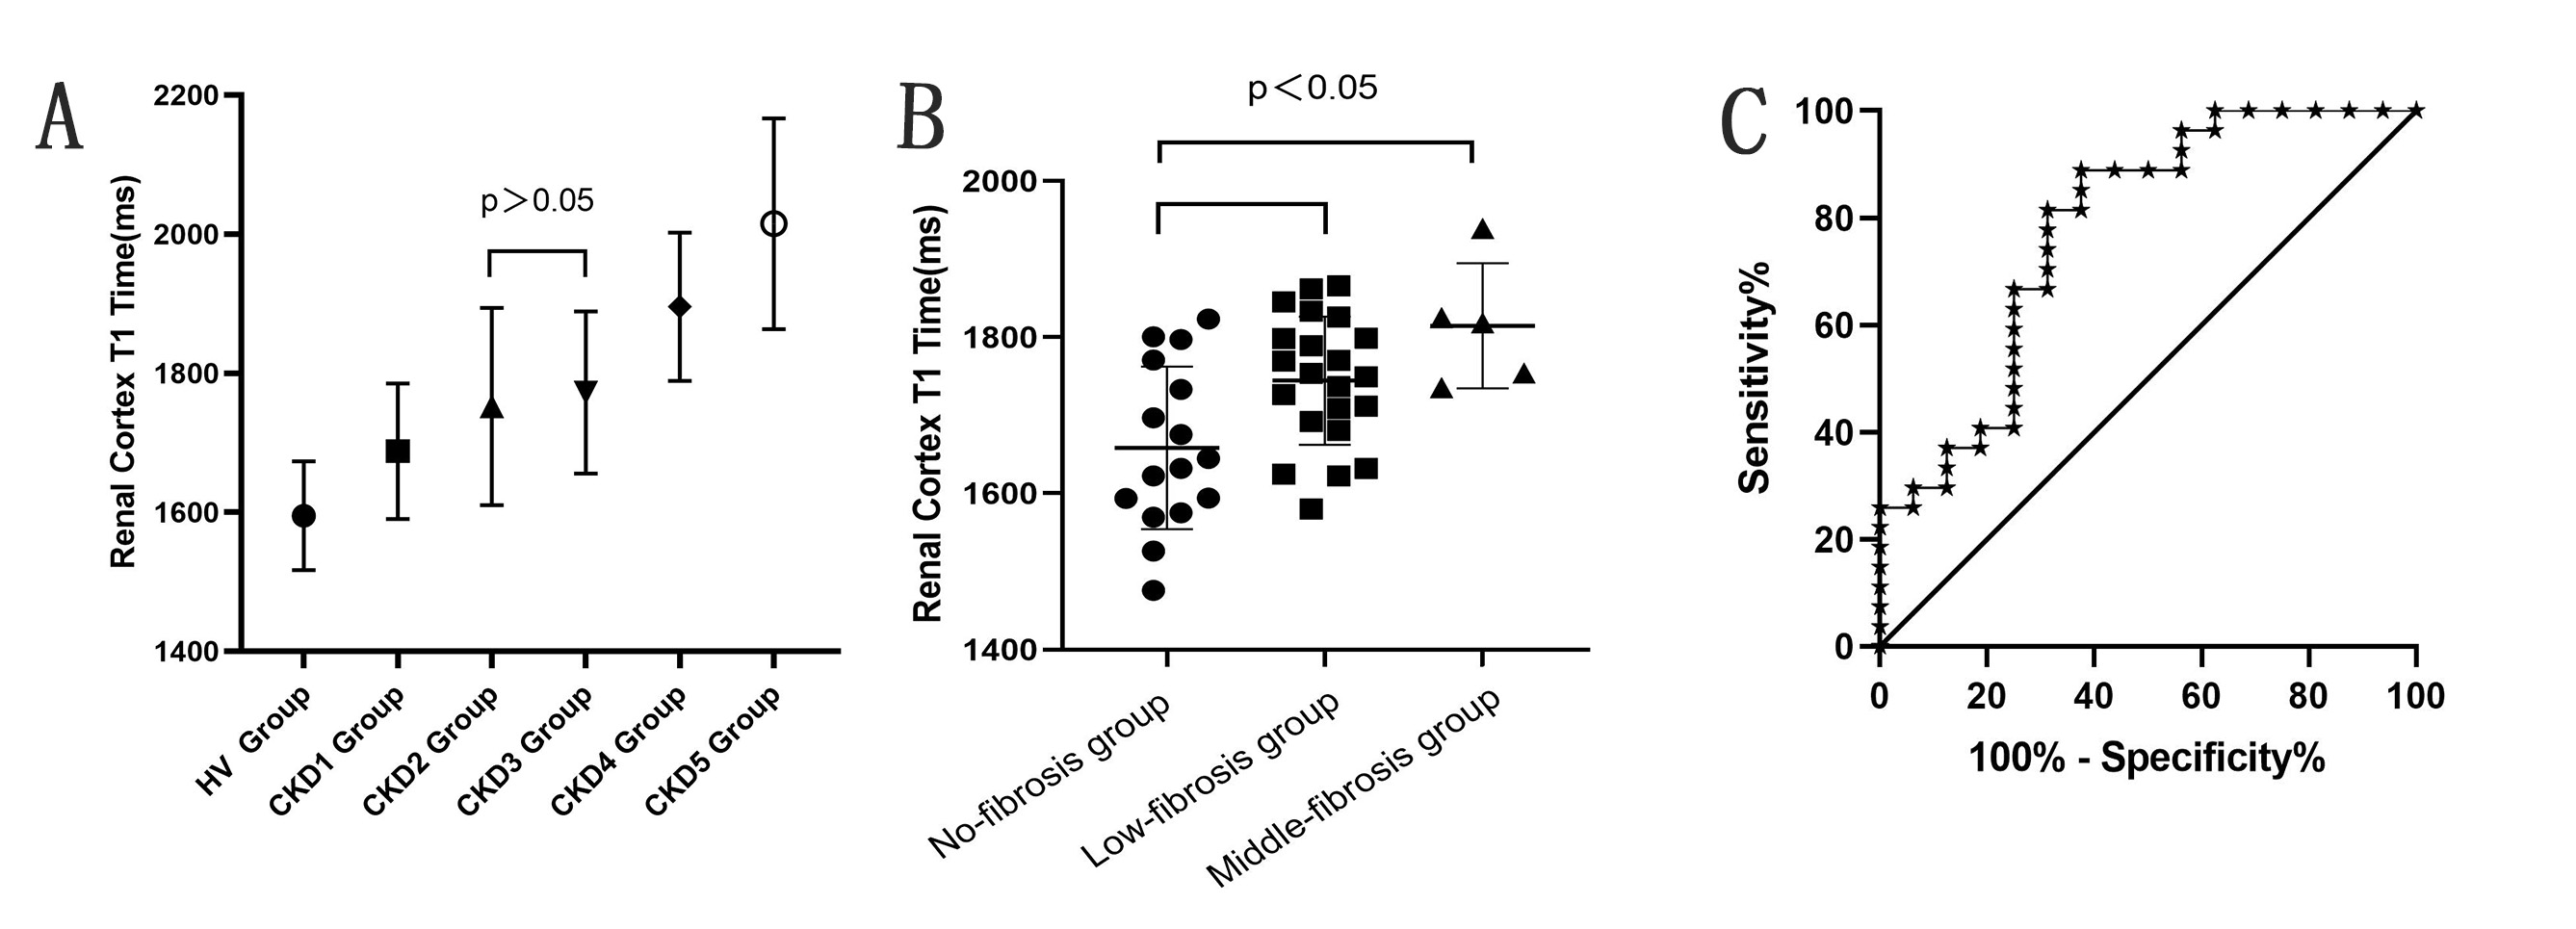
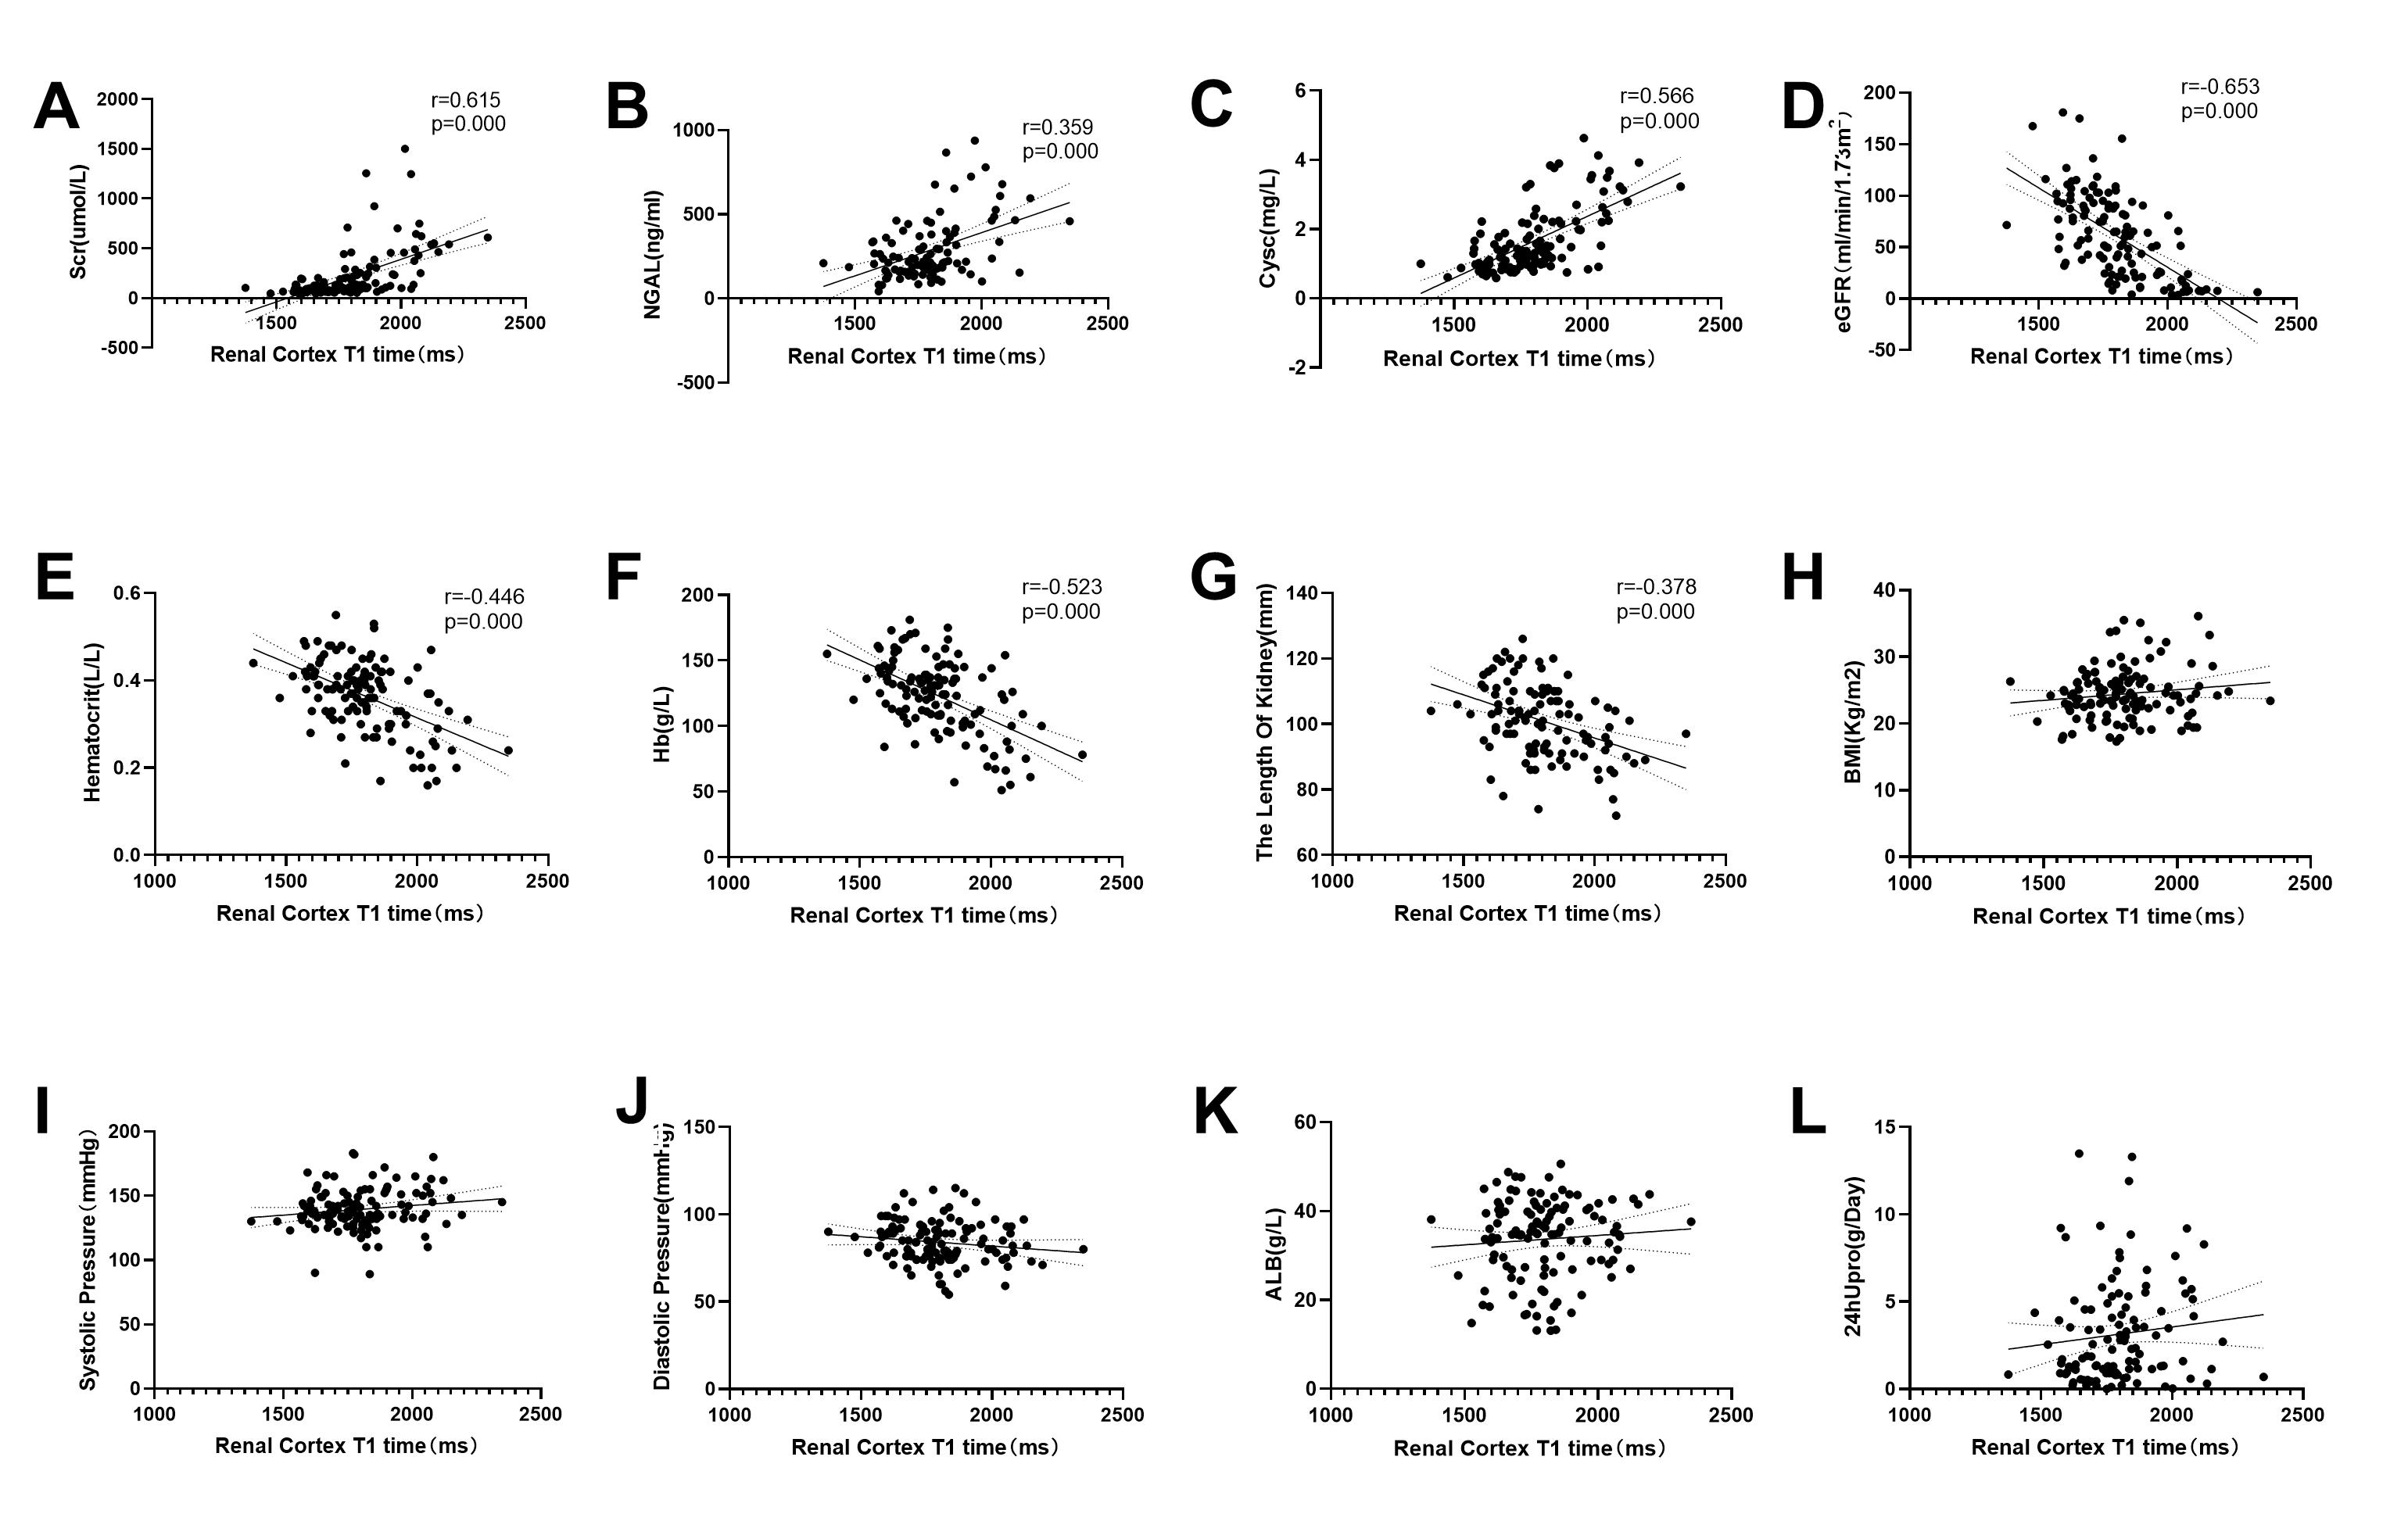
One-way ANOVA showed that there was significant difference of T1 values between the control group and CGN patients with different chronic kidney disease (CKD) stage (F=29.6, P<0.001). T1 values increased with CKD stages. Further multiple comparison showed that there were statistical differences in T1 values between CKD stages except stage 2 and 3 (Fig.2A).T1 value was positively correlated with Cystatin C (CysC),neutrophil gelatinase associated lipocalin (NGAL), serum creatinine(Scr)(p<0.05) and negatively correlated with hemoglobin(Hb), the length of kidney, estimated glomerular filtration rate (eGFR) and hematocrit(HCT)(p<0.05) (Fig.3). No significant correlation was found between T1 and other clinical parameters, including BMI, diastolic blood pressure(DBP), systolic blood pressure(SBP), serum albumin(ALB)and 24-hour proteinuria(24hPRU) (p>0.05). In addition, T1 value was positively correlated with various pathological scores and the degree of renal IF(p<0.05) (Table 1). Compared to non-fibrosis group, increased T1 values were revealed in low and medium fibrosis group (p<0.05) (Fig.2B).
Univariate Logistic regression analysis showed that T1 value, eGFR, CysC and ALB were associated with renal IF. Multivariate Logistic regression analysis showed that T1 value could predict the occurrence of renal fibrosis (p<0.05) (Table 2). ROC curve of T1 value for predicting renal fibrosis was 0.762, and the critical value of T1 was 1695ms (Fig.2C).
Discussion and conclusion
The possibility and potential uses of native T1 mapping in assessing CKD patients3 and lengthened T1 in IgA nephropathy patients has been demonstrated compared to healthy subjects4.In this study, significant differences were found in renal T1 values between HCs and CGN patients with CKD 1-5 stages. Except for CKD stage 2 and 3, statistical different T1 values were shown among patients with CKD at any stage, indicating that T1 value could reflect renal function and grade CKD. T1 value was also correlated well with the degree of renal pathological changes. T1 values in low and middle fibrosis group are higher than in the non-fibrosis group, suggesting that T1 map is a sensitive tool to detect IF and abnormality in the early stage of renal fibrosis. Logistic regression analysis shows that T1 value is an independent predictor of IF. It is necessary to be alerted that IF occurs when the T1 value of renal cortex is higher than 1695ms.In conclusion, native T1-mapping demonstrated good diagnostic performance in evaluation of renal function and non-invasive detection of IF in CGN patients.
Acknowledgements
No acknowledgement found.References
1. Eddy AA: Overview of the cellular and molecular basis of kidney fibrosis. Kidney Int Suppl (2011) 4: 2–8, 2014.
2. Luciano RL, Moeckel GW. Update on the Native Kidney Biopsy: Core Curriculum 2019. Am J Kidney Dis. 2019 Mar;73(3):404-415.
3. Cox EF, Buchanan CE, Bradley CR, et al. Multiparametric Renal Magnetic Resonance Imaging: Validation, Interventions, and Alterations in Chronic Kidney Disease. Front Physiol. 2017 Sep 14;8:696.
4. Graham-Brown MP, Singh A, Wormleighton J. et al.Association between native T1 mapping of the kidney and renal fibrosis in patients with IgA nephropathy. BMC Nephrol. 2019, 20(1): 256.
5. Stainsby, J. A., & Slavin, G. S. Comparing the accuracy and precision of SMART1Map, SASHA and MOLLI. Journal of Cardiovascular Magnetic Resonance, 2014,16(Suppl 1), P11.
6. Katafuchi R,Kiyoshi Y ,Oh Y,et al. Glomerular score as a prognosticator in IgA nephropathy:its usefulness and limitation[J].Clin Nephrol,1998,49:1-8.
Figures