2534
The value of intravoxel incoherent motion diffusion-weighted imaging and T1-Mapping in the evaluation of renal transplantation function1Department of Radiology, Shandong Provincial Hospital Affiliated to Shandong University, Jinan, China, Jinan, China, 2Department of Radiology,Shandong Provincial Hospital Affiliated to Shandong First Medical Uiversity, Jinan, China, 3Qilu Hospital of Shandong University, Jinan, China, 4MR Scientific Marketing, Diagnostic Imaging, Siemens Healthcare Ltd., Shanghai 201318, China, Shanghai, China, 5Department of Radiology, China-Japan Friendship Hospital, Beijing, China, Beijing, China
Synopsis
The objective of this study was to evaluate renal function of renal transplantation using intravoxel incoherent movement(IVIM) and T1-Mapping. The results showed that the T1-Mapping was significantly superior than IVIM in distinguishing between the groups with good graft function (Group A), impaired graft function (Group B) and normal kidney (Control Group).
Synopsis:
The objective of this study was to evaluate renal function of renal transplantation using intravoxel incoherent movement(IVIM) and T1-Mapping. The results showed that the T1-Mapping was significantly superior than IVIM in distinguishing between the groups with good graft function (Group A), impaired graft function (Group B) and normal kidney (Control Group).Introduction:
Currently there is no ideal non-invasive imaging examination method suitable for renal transplant patients because of their particularity. The purpose of this study was to explore the feasibility of IVIM and T1-Mapping in evaluating function of renal allograft and the diagnostic effectiveness of their parameters. Such as tissue diffusion Coefficient (D), pseudo-diffusion Coefficient (D*), perfusion fraction (f) of IVIM and T1 value.Method:
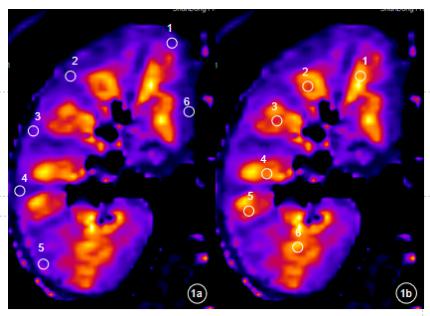
35 kidney transplant patients and 6 healthy volunteers were collected prospectively. The IVIM and T1-Mapping were performed at a 3T scanner (MAGNETOM Prisma, Siemens Healthcare, Erlangen, Germany) with a 18-channel body coil. The parameters of IVIM were as follows: TR/TE=3200/64ms, slice thickness=4mm, Fov130×51.4%, b=0,20,30,50,80,100, 150,200,300,500,800s/mm2; T1-Mapping parameters were as follows: TR /TE=429.96 /1.2 ms, slice thickness= 5mm, slice number =7, Fov 360 × 85.2%, flip angle =35 °. Several ROIs were drawn in both cortex and medulla of the upper, middle and lower pole of the kidney by Siemens SyngoVia(figure 1). The quantitative parameters of IVIM (D, D *, f) and T1-Mapping at ROIs were measured in all subjects. The D, D*, f and T1 value were compared by Single-factor ANOVA variance analysis among the three groups. ROC was used to evaluate the effectiveness of parameters with significant difference in identifying Group A and B, Group B and Control group, respectively.Results:
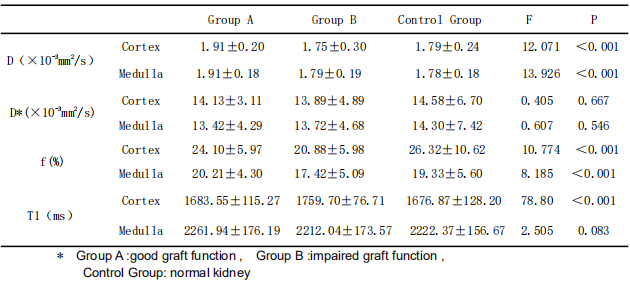
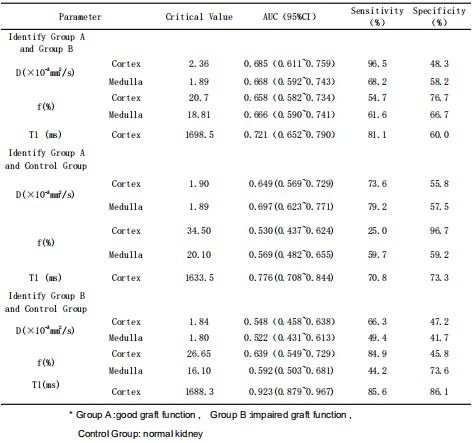
The value of D, D *, f and T1 of transplanted kidneys and normal kidneys are displayed in Table 1. The D and f were significantly different in both cortex and medulla in those three groups, while T1 value was only different in cortex. However, there were no significant difference of D* value in cortex and medulla, as well as T1 value in medulla. The ROC curve analysis and effectiveness evaluation of the D, f and T1 in different groups are shown in Table 2. T1 value was the most effective parameter in the identification of Group A and B, Group B and control group, respectively (AUC:0.721).Discussion:
Long-term viable transplanted kidneys can develop chronic rejection or fibrosis, which can be detected by both IVIM and T1-Mapping. D, f and T1 value were good at evaluating the function of kidney transplantation among different groups, which is partly consistent with other studies[1,2].Conclusion:
T1 mapping shows a promising prospect in the evaluation of Renal allograft function, and can provide the early detection of impairment of the renal allograft function.Acknowledgements
No acknowledgement found.References
1.Eisenberger U, Thoeny HC, Binser T, et al. Evaluation of renal allograft function early after transplantation with diffusion-weighted MR imaging[J]. Eur Radiol,2010, 20:1374-1383.
2.Huang Yin,Sadowski Elizabeth A,Artz Nathan S,Seo Songwon,Djamali Arjang,Grist Thomas M,Fain Sean B. Measurement and comparison of T1 relaxation times in native and transplanted kidney cortex and medulla.[J]. Journal of magnetic resonance imaging : JMRI,2011,33(5).
Figures