2533
Renal hypoxia estimated by O2-inhalation T2* BOLD MRI: association with renal dysfunction and left ventricular remodeling in cardiomyopathy
Michinobu Nagao1, Kiyoe Ando1, Yasuhiro Goto1, Isao Shiina1, Kazuo Kodaira1, Masami Yoneyama2, Takashi Namiki2, Atsushi Yamamoto1, Eri Watanabe1, Akiko Sakai1, Risako Nakao1, and Shuji Sakai1
1Tokyo Women's Medical University, Tokyo, Japan, 2Philips Japan, Tokyo, Japan
1Tokyo Women's Medical University, Tokyo, Japan, 2Philips Japan, Tokyo, Japan
Synopsis
O2-inhalation T2*-BOLD MRI is a non-invasive imaging techniqueto evaluate renal oxygenation. This analysis revealed that renal hypoxia is strongly associated with renal dysfunction, and that early left ventricular remodeling in cardiomyopathy leads to renal hypoxia. This renal hypoxia image helps clarify chronic cardiorenal interaction and the effects of drugs for cardiorenal disease.
OBJECTIVES
Tissue hypoxia plays a key role in the development of various heart and kidney diseases. Blood-oxygen-level-dependent (BOLD) MRI is the most promising imaging technique to monitor tissue oxygenation in humans. Cardiorenal syndrome is widely accepted as a complex clinical problem routinely faced by clinicians. It is difficult to explain the mechanism with imaging.Recently, oxygen-inhalation T2*-BOLD analysis reveals that myocardial hypoxia induces fibrosis in hypertrophic cardiomyopathy (1). We propose a new method for quantifying renal oxygenation that modifies the T2*-BOLD, and investigate whether renal hypoxia is associated with renal dysfunction and left ventricular (LV) remodeling in patients with non-ischemic cardiomyopathy.METHODS
Data of cardiac cine and renal T2*-BOLD MRI collected from 88 patients (mean age, 57 years) with non-ischemic cardiomyopathy using a 3-tesla scanner (Ingenia 3T CX, Philips Healthcare) were prospectively analyzed. All patients had an estimate glomerular filtration rate (eGFR) >40 mL/min/1.73m2and eGFR <50 mL/min/1.73m2was classified as mild renal dysfunction. Patients with chronic kidney disease were excluded. ECG-gated T2*-BOLD was conducted using the black blood, breath-hold, and multi-echo gradient-echo sequence. Over 10 min inhalation of oxygen at the flow rate of 10 L/min, R2* for a region of interest in the left renal parenchyma was measured following room-air and oxygen inhalation (Figure 1). ΔR2*(ms-1) and ΔR2*ratio (R2*oxy-R2*air/R2*air, %)were calculated, and defined as estimates of renal oxygenation. LV end-diastolic volume index (LVEDVi, ml/m2) was measured from cine imaging, and LVEDVi >95 ml/m2was defined as positive of LV remodeling.RESULTS & DISCUSSION
ΔR2*ratio was significantly lower for patients with eGFR <50 mL/min/1.73m2(n=12) than those with >50mL/min/1.73m2(n=76) (-10.5±4.5% vs. 0.6±11.8%; p<0.0001). Receiver-Operating-Characteristic curve analysis revealed that using the cutoff -6.1% of ΔR2*ratio could distinguish patients with eGFR <50 mL/min/1.73m2from those with >50mL/min/1.73m2, with an area under the curve of 0.86, a sensitivity of 92%, and a specificity of 80%. ΔR2*ratio was significantly lower for patients with LVEDVi >95 ml/m2(n=12) than those with <95 ml/m2 (n=76) (-8.2±10.9% vs. 0.2±11.5%; p<0.05) (Figure 2).In decreased eGFR, if oxygen is inhaled, the renal blood vessels have been expanded due to the chronic ischemic condition, and the blood vessels are poorly reactive, so no vasoconstriction occurs. As a result, the oxygen concentration stagnates as the microcirculation increases. Contrastingly, the oxygen consumption of the organ does not change, so the ratio of oxy-hemoglobin increases and T2*oxy also increase. Therefore, when eGFR decreases, R2 decreases due to the oxygen inhalation. Heart failure reduces renal blood flow. Even early LV remodeling adversely affects pump function, leading to renal hypoxia.
CONCLUSION
Renal hypoxia expressed as decreased ΔR2*ratio is strongly associated with reduced eGFR. Early LV remodeling can lead to renal hypoxia. O2-inhalation T2*-BOLD MRI is a non-invasive imaging to evaluate renal oxygenation.Acknowledgements
This work was supported by the Japan Society for the Promotion of Science (JSPS) KAKENHI (19K08209).References
1. Ando K, Nagao M, Watanabe E, et al. Association between myocardial hypoxia and fibrosis in hypertrophic cardiomyopathy: analysis by T2* BOLD and T1 mapping MRI. Eur Radiol 2020; 30 https://doi.org/10.1007/s00330-020-06779-9.Figures
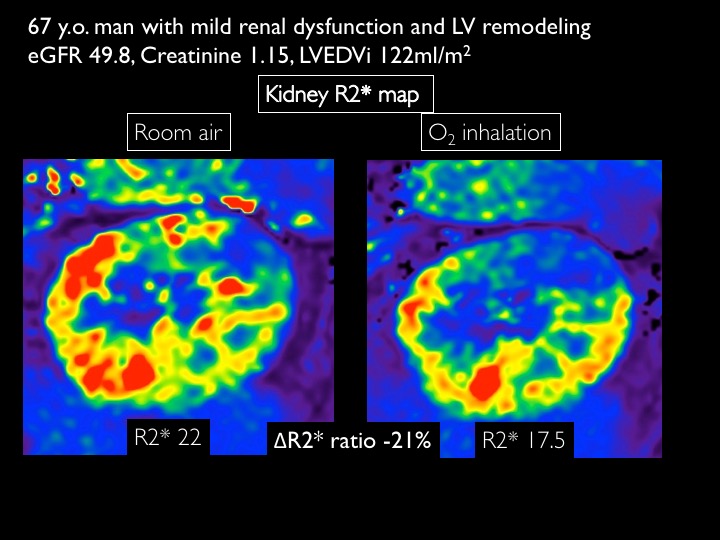
O2-inhalation T2* BOLD MRIR2* map for 67 years man with cardiomyopathy and mild renal dysfunction
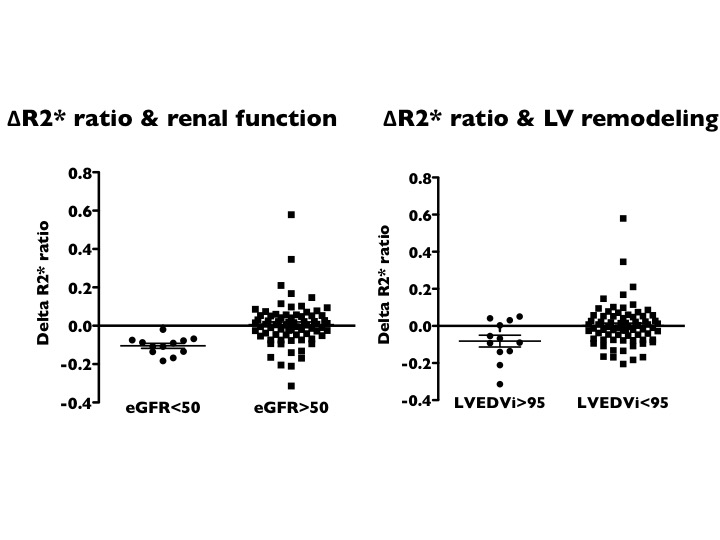
Comparison of ΔR2*ratio between patients with eGFR <50mL/min/1.73m2and >50 mL/min/1.73m2(left) and between patient with LVEDVi >95 ml/m2 and <95 ml/m2.