2532
Evaluation of renal oxygenation and hemodynamics in patients with chronic kidney disease by BOLD-MRI and intrarenal Doppler ultrasonography1Nephrology, Shuguang Hospital Affiliated to Shanghai University of Traditional Chinese Medicine, Shanghai, China, 2Radiology, Shuguang Hospital Affiliated to Shanghai University of Traditional Chinese Medicine, Shanghai, China, 3Ultrasonography, Shuguang Hospital Affiliated to Shanghai University of Traditional Chinese Medicine, Shanghai, China, 4MR Scientific Marketing, Siemens Healthcare, Shanghai, China, 5MR Applications Development, Siemens Shenzhen Magnetic Resonance Ltd, Shenzhen, China
Synopsis
The purpose of this study was to observe the alteration
of renal oxygenation and renal hemodynamics in CKD patients using blood
oxygenation level-dependent (BOLD) magnetic resonance imaging (MRI) and
intrarenal Doppler ultrasonography (IDU). The result showed that renal
oxygenation and blood flow velocities declined as the CKD stage progressed. The
BOLD-MRI and IDU techniques were able to dynamically evaluate intrarenal oxygenation
and hemodynamics changes, respectively, in CKD patients. Combination these two
techniques can detect the abnormalities associated with CKD stage sensitively.
Introduction
The basic pathophysiologic disarrangement of chronic kidney disease (CKD) begins with the loss of nephrons, leading to renal hemodynamic changes, that eventually cause a reduction in nephron numbers and lead to renal hypoxia. Blood oxygen level-dependent magnetic resonance imaging (BOLD-MRI) has been proposed to be a promising noninvasive method for renal oxygenation monitoring in preclinical and clinical studies [1, 2]. This technique identifies oxygenation changes in the renal cortex and medulla [3, 4]. Intrarenal Doppler ultrasonography (IDU) effectively assesses renal perfusion by measuring peak systolic velocities (PSVs) to estimate and evaluate renal function [5]. The purpose of this study was to prospectively observe renal oxygenation and hemodynamic alterations in CKD patients using BOLD-MRI and IDU.Methods
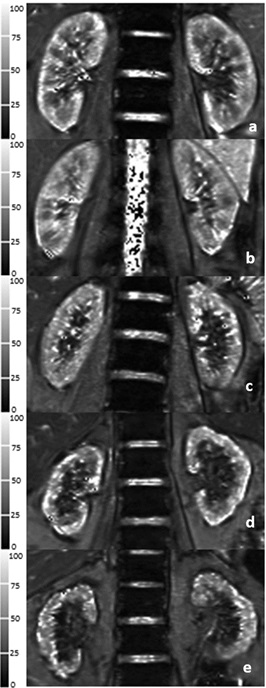
This experiment was approved by our Ethics Committee, and all participants signed the informed consent forms. Forty CKD1-4 patients and 19 healthy volunteers were enrolled in the study and underwent magnetic resonance imaging on a 3-Tesla MR scanner (MAGNETOM Skyra; Siemens Healthcare, Erlangen, Germany) equipped with an 18-channel body surface coil and a 32-channel spine coil. BOLD imaging of both left and right kidneys used a breath-hold coronal multi-echo 2D gradient-echo (GRE) sequence with TEs of 2.46, 4.92, 7.38, 9.84, 12.30, 14.76, 17.22 ms, a TR of 232 ms, slice thickness of 3.5 mm, flip angle of 60°, a bandwidth of 470Hz/Px, 1 average, a field of view of 380 mm, and matrix of 168 × 256. According to estimated glomerular filtration rate (eGFR), all patients were divided into two subgroups: a mild renal impairment (MI) group and a moderate-to-severe renal impairment (MSI) group. Nineteen healthy volunteers (HVs) were also added. The mean cortical T2* (COT2*) values and mean outer medullary T2* (OMT2*) values were monitored on BOLD-MRI images. IDU was used to measure the peak systolic velocities (PSVs) of renal arteries. The clinical indicators including eGFR were recorded and measured. The eGFR, PSV, COT2*, and OMT2* values were observed and compared in all participants. Correlation analyses were performed among eGFR, PSV, COT2* and OMT2* values.Results
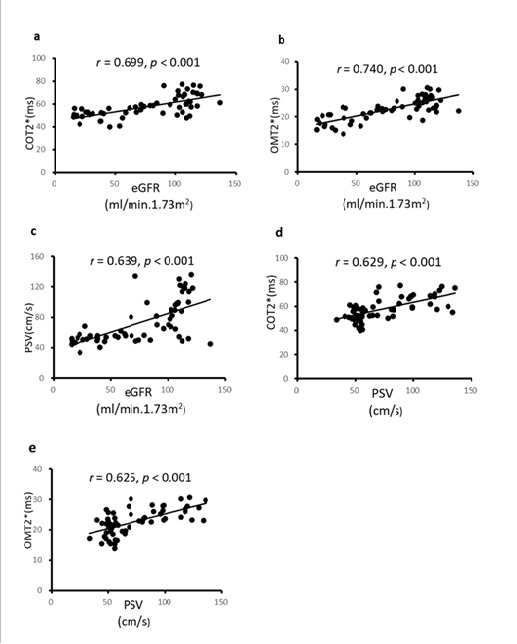
COT2*, OMT2*, and PSV values were significantly different among the HVs, MI, and MSI groups (68 ± 6 ms vs. 56 ± 4 ms vs. 49 ± 5 ms, X2 = 42.767, p < 0.001; 27 ± 2 ms vs. 23 ± 2 ms vs. 18 ± 3 ms, X2 = 43.205, p < 0.001; 103. 9 ± 20.4 cm/s vs. 67.4 ± 22.1 cm/s vs.51.7 ± 7.4 cm/s, X2 = 34.502, p < 0.001) (Fig.1). The spearman correlation analysis showed that eGFR levels were positively correlated with the COT2*, OMT2* and PSV values (r = 0.699, p < 0.001; r = 0.740, p < 0.001; r = 0.639, p < 0.001) in all participants; PSV values were positively correlated with the COT2* and OMT2* values (r = 0.629, p < 0.001; r = 0.625, p < 0.001) (Fig.2).Discussion and Conclusion
CKD is defined as abnormalities of renal function or structure for at least 3 months. In the development and progression of CKD, assessment in oxygenation and hemodynamics changes of cortex and medulla plays a crucial role in therapeutic strategy establishing. Higher COT2* values than OMT2* were observed indicated higher tissue oxygenation in the cortex than the outer medulla. COT2* and OMT2* values decreasing from HV to MSI groups with the positive correlation between the eGFR and COT2*/ OMT2* values demonstrated that renal tissue oxygenation depends on the progression from CKD to end-stage renal failure, which may be caused by renal interstitial fibrosis, glomerulosclerosis develop and loss of peripheral capillaries [6, 7]. Aortic PSV decreasing gradually from the HV to MSI groups and declining with CKD progression were also observed in this study. The differences between the MI and HV groups indicated that IDU could distinguish the early stages of CKD. PSVs positively correlating with increasing eGFR emphasized that PSV was a practical method to measure renal hemodynamics. Furthermore, PSV finding was related to significantly changed COT2* and OMT2* values. The underlying reasons for the changes in these values might be associated with renal hemodynamic changes, and reductions in arterial blood flow velocities, renal blood flow, and regional perfusion, all weakening the oxygen-carrying capacity of the blood. Hence, BOLD-MRI and IDU can evaluate intrarenal oxygenation and hemodynamic changes dynamically in CKD patients. BOLD-MRI combined with IDU has a potential clinical value in monitoring renal hypoxic states, guiding early intervention for patients with CKD.Acknowledgements
No acknowledgement found.References
1 Prasad PV. Functional MRI of the kidney: tools for translational studies of pathophysiology of renal disease. Am J Physiol Renal Physiol. 2006 May;290(5):F958-74.
2 Pohlmann A, Cantow K, Hentschel J, Arakelyan K, Ladwig M, Flemming B, et al. Linking non-invasive parametric MRI with invasive physiological measurements (MR-PHYSIOL): towards a hybrid and integrated approach for investigation of acute kidney injury in rats. Acta Physiol (Oxf). 2013 Apr;207(4):673-89.
3 Schachinger H, Klarhofer M, Linder L, DreweJ, Scheffler K. Angiotensin II decreases the renal MRI blood oxygenation level-dependent signal. Hypertension. 2006 Jun;47(6):1062-6.
4 Textor SC, Glockner JF, Lerman LO, Misra S, McKusick MA, Riederer SJ, et al. The use of magnetic resonance to evaluate tissue oxygenation in renal artery stenosis. J Am Soc Nephrol. 2008 Apr;19(4): 780–8.
5 Chen Q, He F, Feng X, Luo Z, Tong J. Correlation of Doppler parameters with renal pathology: A study of 992 patients. Exp Ther Med. 2014 Feb;7(2):439-442.
6 Mimura I, Nangaku M. The suffocating kidney: tubulointerstitial hypoxia in end-stage renal disease. Nat Rev Nephrol. 2010 Nov;6(11):667-78.
7 Basile DP. The endothelial cell in ischemic acute kidney injury: implications for acute and chronic function. Kidney Int. 2007 Jul;72(2):151-6.
Figures