2531
Quantitative T1 and R2* mapping in the evaluation of renal function in chronic kidney disease1Affiliated Hospital of Nantong University, Nantong, China, 2GE Healthcare, MR Research China, Beijing, China
Synopsis
In this study, we explore the quantitative T1 and R2* mapping in theclassification on renal function in chronic kidney disease (CKD) . 146 CKD patients and 26 healthy volunteers(HVs)underwent T1 mapping and renal BOLD-MRI for R2* mapping. All CKD cases were divided into two groups according to the estimated glomerular filtration (eGFR):mild renal impairment group and moderate to severe group.Clincal information were collected.Compared with HVs,the T1 and R2* values of renal cortex were significantly higher and were well correlated with renal function.Therefore,T1 mapping and BOLD-MRI derived R2* mapping might provide an effective method in assessing renal function.
Introduction
The incidence and prevalence of chronic kidney disease (CKD) has gradually increased and became a public health problem around the world1. Early monitoring of renal impairment and timely treatment could help postpone the progression of CKD. Biopsies remain the gold-standard to diagnose CKD despite several limitations2.Quantitative magnetic resonance imaging (qMRI), as a non-invasive method, has been reported to evaluate the renal characteristics quantitatively based on versatile MRI techniques3-4. T1 mapping, as a representative qMRI method for T1 relaxation measurement, has been used to assess the renal function of transplanted kidney5. Meanwhile, R2* mapping, derived from renal blood oxygenation level dependent (BOLD) imaging, has also been applied in the classification of renal function in CKD6. With these, we assumed T1 and R2* mapping might hold clinical potential in assessing renal function in CKD.
Therefore, the main goal of this study was to explore the feasibility of combined T1 and R2*mapping in evaluating renal function in CKD patients.
Methods and materials
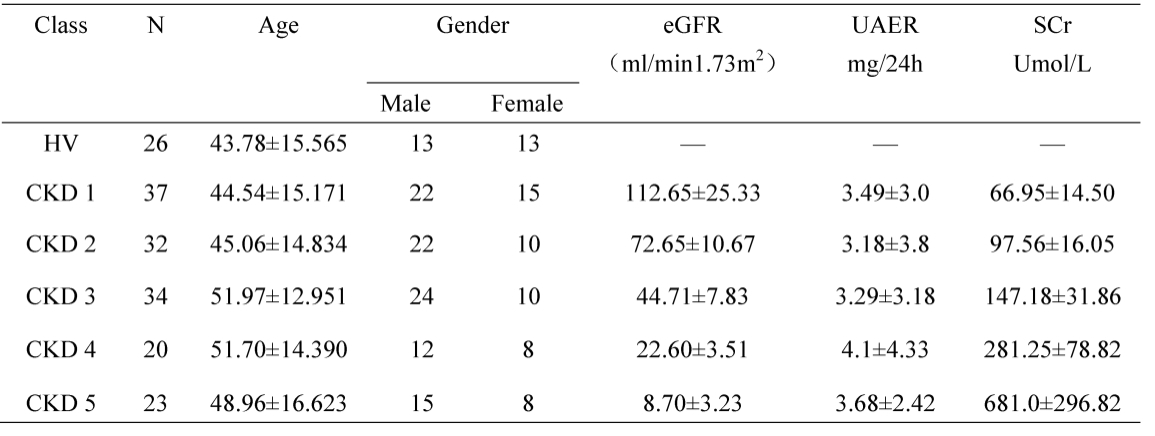
SubjectsIn this prospective study, 146 CKD patients (mean age: 48±15 years) and 26 age matched healthy volunteers (mean age: 46±15 years) were recruited. All patients gave informed consent and underwent MRI examinations.
MRI experiment
All MRI experiments were performed on a 3.0T MR scanner (Discovery MR750, GE Healthcare, Milwaukee, WI) with a 16-channel phased array coil employed. A single-point saturation-recovery FIESTA (SMART) T1 imaging7 was used for native T1 measurement. The scan parameters were as follows: 8 oblique coronal slices covering both whole kidneys; slice thickness 5.0mm; slice gap 1mm; FOV 32*32cm2; Matrix 192×128;NEX 1;acceleration factor 2;Respiration trigger was also adopted. Renal-BOLD MRI was applied for R2* mapping measurement. Coronal scan was performed to cover both left and right kidneys and adrenal gland with the following parameters: TR=175ms, 7 TEs=1.3ms, 4.6ms, 6.2ms, 7.8ms, 9.5ms, 11.1ms and 12.7ms, slice thickness=5mm, flip angle =15degrees, NEX=1, FOV=32*32cm2 and matrix=192x192. Total scan time was 2 mins 20 seconds.
Data analysis
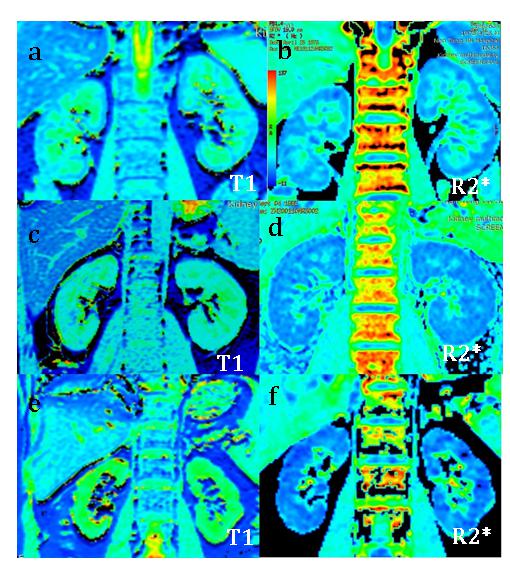
All SMART T1 and renal BOLD data were analyzed using vendor provided post-processing software on GE ADW 4.6 workstation.The corresponding T1 and R2* mapping were obtained accordingly(Fig.1).Three regions of interest(ROI) were selected from the upper, the middle and the inferior part In both renal cortex, respectively. The analyzed T1 values of renal cortex for every subject were averaged of right renal cortex T1 and left renal cortex T1,as well as R2* value.
Statistical analysis
All statistical analyses were performed in Prism 8.0 and SPSS25.0 software. Single factor analysis of variance (One-way ANOVA) was used to evaluate the group difference in T1 or R2* among healthy control group and two CKD groups. Least-significant difference (LSD) method was used for post-hoc pairwise comparison. Pearson or Spearman correlation coefficient was used to analyze the correlation between T1 or R2* and clinical parameters; receiver operating curve(ROC)was used for diagnosing CKD. p < 0.05 was considered statistical significance.
Results
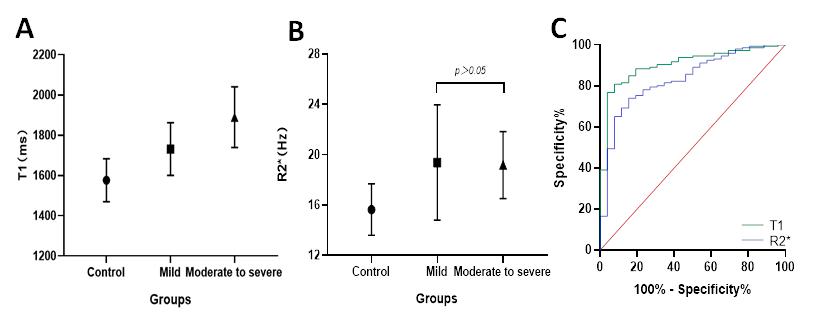
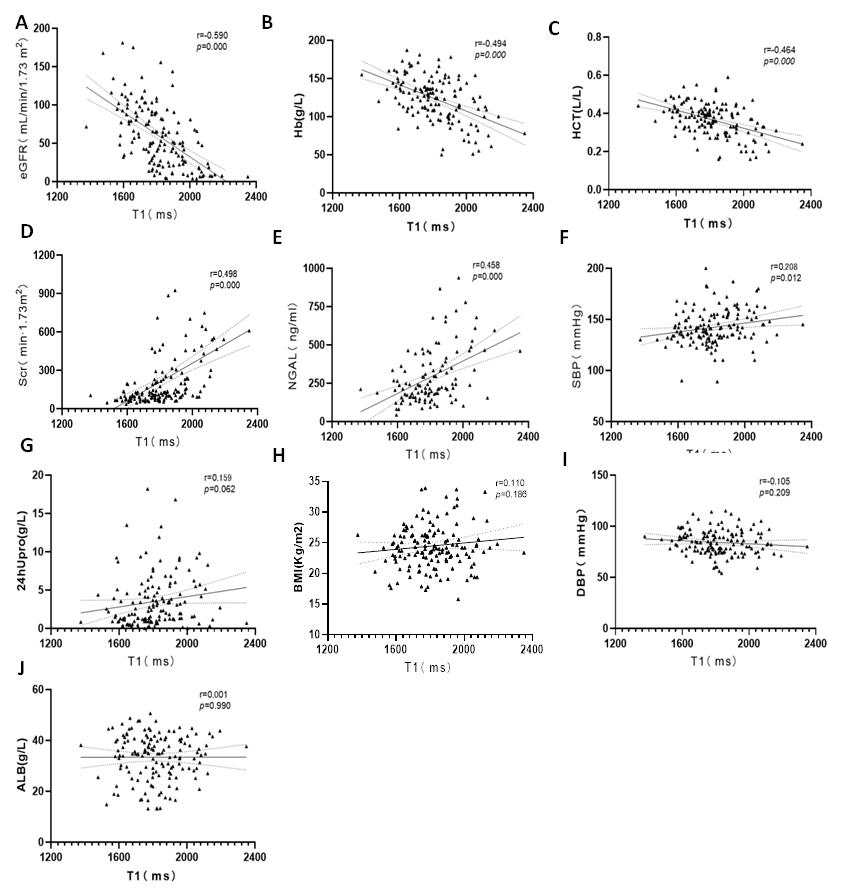
The demographics of HVs and CKD sub-groups are shown in Table 1. According to the renal function determined by eGFR,146 CKD cases were divided into two groups: 69 mild renal impairment (eGFR≥60 mL/min/1.73 m2) and 77 cases of moderate to severe renal impairment (eGFR<60 mL/min/1.73 m2)2. Significant differences were found in T1 and R2* values of renal cortex before and after multiple comparison correction among control group, mild and moderate to severe renal impairment group(P < 0.001), except for corrected R2* between mild and moderate to severe renal impairment group (p>0.05)(Fig 2 A&B). T1 and R2* were positively correlated with the CKD stage of patients(r=0.702, p<0.001; r=0.347,p<0.001). T1 value was positively correlated with the neutrophil gelatinase associated lipocalin(NGAL)(p<0.05, serum creatine(Scr) and negatively correlated with estimated glomerular filtration (eGFR),hemoglobin(Hb), systolic pressure(SBP) and hematocrit(HCT)(all p<0.05). However, no correlation was found in T1 with 24 hour urinary protein(24hUpro), Body Mass Index (BMI), diastolic blood pressure (DBP) and Albumin(ALB)(Fig 3). For R2*, no significant correlation was found with any clinical parameters. Using ROC analysis, when the thresholds of cortical T1 and R2* were set at 1663.65ms and 16.94Hz, the areas under the curve (AUC) were 0.905 and 0.835, respectively (Fig 2C).Discussion and Conclusion
In this study, we investigated the feasibility of T1 and R2* mapping in assessing CKD patients. Increased T1 was shown in renal cortex with the severity of renal impairment, and a significant association was revealed between T1 and clinical parameters, in consistent with a previous study8. A possible reason of increased T1 is that the edema, inflammatory cell infiltration, necrosis or other pathological changes might occur in renal interstitium with impaired renal function. Additionally, increased T1 was shown with the increased interstitial water concentration4. Consistent with Li et al6., cortical R2* value in mild impairment group was significantly higher than in control group. This reflects lower oxygen content in tissues and might be caused by high glomerular metabolism and compensatory changes in residual glomeruli during early renal lesions. Moreover, both T1 and R2* provided satisfactory sensitivity and specificity to distinguish the severity of renal function. In conclusion, combined T1 with R2* mapping provide solid evidence of good diagnostic performance in non-invasive evaluation of renal function in CKD patients.Acknowledgements
No acknowledgement found.References
1. Coresh J, Selvin E, Stevens LA, et al. Prevalence of chronic kidney disease in the United States. JAMA. 2007;298(17):2038-2047. doi:10.1001/jama.298.17.2038
2.Kidney Disease: Improving Global Outcomes (KDIGO) CKD Work Group. KDIGO 2012 Clinical Practice Guideline for the Evaluation and Management of Chronic Kidney Disease. Kidney inter, Suppl. 2013;3(1):1–150.
3. Buchanan CE, Mahmoud H, Cox EF, et al. Quantitative assessment of renal structural and functional changes in chronic kidney disease using multi-parametric magnetic resonance imaging. Nephrol Dial Transplant. 2020;35(6):955-964. doi:10.1093/ndt/gfz129
4.Wolf M, de Boer A, Sharma K, et al. Magnetic resonance imaging T1- and T2-mapping to assess renal structure and function: a systematic review and statement paper. Nephrol Dial Transplant. 2018;33(suppl_2):ii41-ii50. doi:10.1093/ndt/gfy198
5. Huang Y, Sadowski EA, Artz NS, Seo S, DjamaliA, Grist TM, Fain SB: Measurement and comparison of T1 relaxation times in nativeand transplanted kidney cortex and medulla.J Magn Reson Imaging 2011; 33: 1241–1247.
6. Li C, Liu H, Li X, Zhou L, Wang R, Zhang Y. Application of BOLD-MRI in the classification of renal function in chronic kidney disease. Abdom Radiol (NY). 2019;44(2):604-611. doi:10.1007/s00261-018-1750-6
7. Stainsby JA, Slavin GS. Comparing the accuracy and precision of SMART1Map, SASHA and MOLLI. J Cardiovasc Magn Reson. 2014. 16(1): P11.
8. Gillis KA, McComb C, Patel RK, et al. Non-Contrast Renal Magnetic Resonance Imaging to Assess Perfusion and Corticomedullary Differentiation in Health and Chronic Kidney Disease. Nephron. 2016;133(3):183-192. doi:10.1159/000447601
Figures