2529
Value of quantitative susceptibility mapping for detecting renal fibrosis of early diabetic nephropathy in type 2 diabetes1Radiology, Third Affiliated Hospital of Soochow University, Changzhou, China, 2Philips Healthcare, Shanghai, China
Synopsis
The purpose was to explore if quantitative susceptibility mapping (QSM) can assess renal fibrosis about early diabetic nephropathy (DN) in type 2 diabetes (T2D). 32 patients with early DN in T2D were included in the study to evaluate the potential clinical relevance of QSM. We found that susceptibility values of the medulla were statistically significant among different fibrosis. Susceptibility value of the medulla was highly correlated with estimated glomerular filtration rate (eGFR). QSM could serve as a quantitative biomarker to assess the renal fibrosis and monitor the treatment in patients with DN.
Introduction
Fibrosis plays an important role in DN, but lack of sensitive and non-invasive detection methods, especially in the early stage[1, 2]. So far, a number of studies have reported that QSM could be used to measure pathologic deposits in basal ganglia in various neurological diseases[3], or as an imaging biomarker of hepatic iron overload[4, 5]. However, it remains unknown whether QSM could serve as a noninvasive biomarker to assess the renal fibrosis. Therefore, the purpose of this study was to explore if QSM can assess the changes of fibrosis in DN and to associate susceptibility value with eGFR.Methods
Study populationThe study was approved by the local ethics committee, and written informed consent was obtained from all subjects. Between October 2019 and December 2020, patients who met the following criteria in the Third Affiliated Hospital of Soochow University were collected. Inclusion criteria: patients with type 2 diabetes, complete clinical data, and eGFR>30 ml/min/1.73 m2. Exclusion criteria: contraindications of MRI, poor image quality, and metabolic diseases other than diabetes. Thirty-two patients (mean age 58.97 ± 12.48 years) were included in the study. According to eGFR, patients with DN were divided into stage Ⅰ (eGFR ≥ 90 ml/min/1.73 m2, 11 cases), stage Ⅱ (60 ≤ eGFR < 90 ml/min/1.73 m2, 11 cases) and stage Ⅲ (30 ≤ eGFR < 60 ml/min/1.73 m2, 10 cases).
MRI protocol
All patients were performed with a 3.0-T Ingenia MR scanner (Philips Healthcare, the Netherlands) using a 32 channel abdomen coil. QSM data were acquired using an axial single breath-hold 3D multi-echo gradient echo sequence with the following parameters: number of echoes = 5, TE1/ ΔTE/TR = 7.2/5.2/32 ms, flip angle = 17°, acquisition matrix = 268 × 254, voxel size = 1.3 × 1.5 × 5 mm3, bandwidth = 254.9 Hz, slices=18, acquisition time 14 s.
Statistical analysis
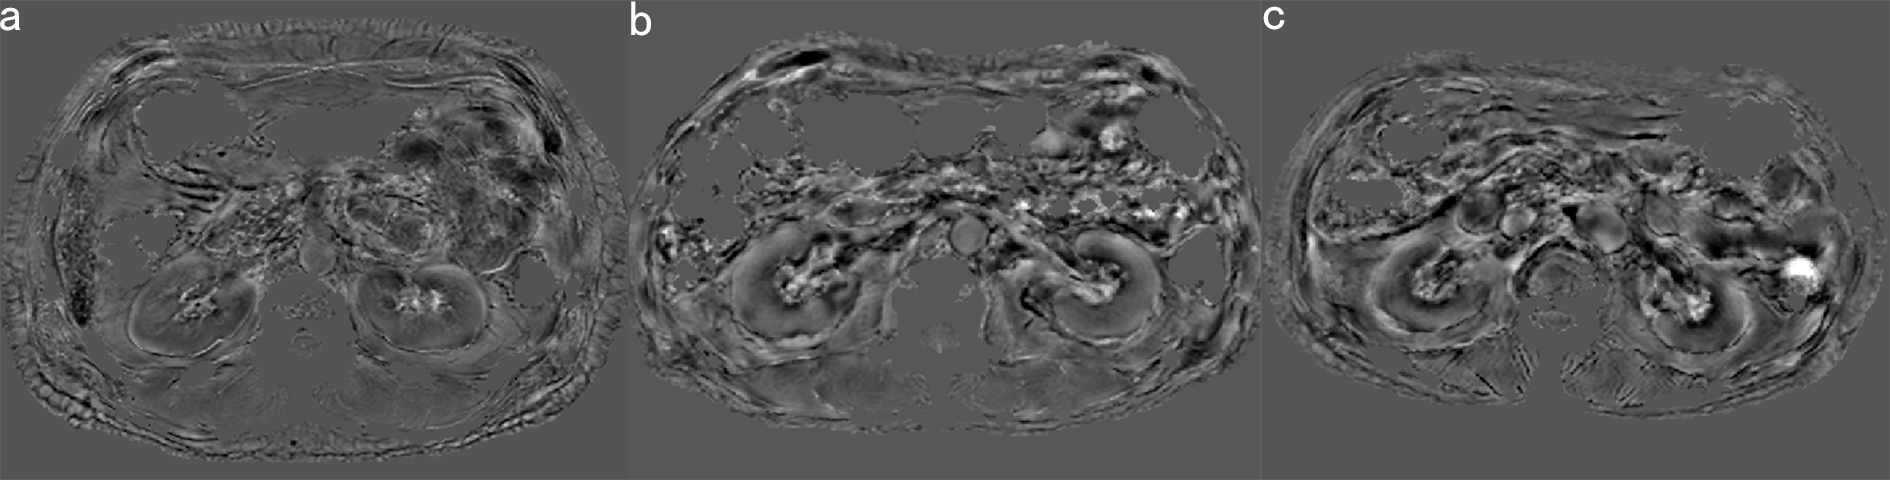
The susceptibility maps were calculated using STISuite toolbox in MATLAB (R2014b). The ImageJ software was used to manually draw regions of interest (ROIs) in cortex and medulla of bilateral kidneys and obtained the mean susceptibility value.
All statistical analyses were performed in SPSS software. Paired sample t-test was used to compare the difference of susceptibility values between renal cortex and medulla, and the difference between left and right kidneys. One-way ANOVA was used to test the difference of susceptibility values at different renal fibrosis groups. In addition, Spearman correlation analysis was employed to assess the relationship between eGFR and susceptibility values. ROC curve was used to analyze the diagnostic efficacy of QSM in the staging of early diabetic nephropathy and to determine the optimal cut-off-value. Significance threshold was set as P<0.05.
Results
In DN patients, the susceptibility values of left renal cortex and medulla were 0.006±0.009 and -0.078±0.019 respectively, and the differences were statistically significant (t=23.805, P < 0.001), while those of right renal cortex and medulla were 0.006±0.009, -0.072±0.023 respectively (t=17.308, P < 0.001). In addition, there was no significant difference between left and right renal cortex (t=0.186, P=0.854). There was a statistically significant difference between the medulla of left and right kidneys (t=-3.366, P=0.002). The susceptibility values of renal cortex in DN stage Ⅰ, Ⅱ and Ⅲ were 0.081±0.088, 0.086 ±0.085, 0.017±0.087 (left kidney) and 0.006±0.073, 0.007±0.011 and 0.007±0.009 (right kidney) respectively. There was no significant difference among these three groups (P > 0.05). The susceptibility values of renal medulla in DN stage Ⅰ, Ⅱ and Ⅲ were -0.060±0.010, -0.079±0.012, -0.096±0.014 (left kidney) and -0.051±0.013, -0.073±0.015, -0.091±0.022 (right kidney) respectively. There were significant differences among these three groups (P < 0.05). In addition, susceptibility values of the medulla were respectively significantly correlated with eGFR (r=0.732,P<0.001, left kidney, r=0.684,P<0.001, right kidney). For left renal medulla, a cut-off-value of -0.077 could be identified to detect DN stage Ⅰ and stage (Ⅱ and Ⅲ) with a sensitivity of 100.00% (95% CI: 0.69–1.00) and a specificity of 90.48% (95% CI: 0.70–0.99), while a cut-off-value of -0.093 could be identified to detect DN stage (Ⅰ and Ⅱ) and stage Ⅲ with a sensitivity of 100.00% (95% CI: 0.84–1.00) and a specificity of 70.00% (95% CI: 0.35–0.93). For right renal medulla, a cut-off-value of -0.066 could be identified to detect DN stage Ⅰ and stage (Ⅱ and Ⅲ) with a sensitivity of 100.00% (95% CI: 0.69–1.00) and a specificity of 76.19% (95% CI: 0.53–0.92), while a cut-off-value of -0.093 could be identified to detect DN stage (Ⅰ and Ⅱ) and stage Ⅲ with a sensitivity of 100.00% (95% CI: 0.84–1.00) and a specificity of 70.00% (95% CI: 0.35–0.93).Conclusion
QSM can evaluate the renal fibrosis in the early DN. The susceptibility values of medulla have higher diagnostic efficiency in DN stage Ⅰ, Ⅱ and Ⅲ. Therefore, QSM may serve as a noninvasive and quantitative biomarker for DN.Acknowledgements
No acknowledgement found.References
[1] Zhu M, Wang H, Chen J, et al. Sinomenine improve diabetic nephropathy by inhibiting fibrosis and regulating the JAK2/STAT3/SOCS1 pathway in streptozotocin-induced diabetic rats[J]. Life Sci,2020:118855.
[2] Liu X, Jiang L, Lei L, et al. Carnosine alleviates diabetic nephropathy by targeting GNMT, a key enzyme mediating renal inflammation and fibrosis[J]. Clinical Science,2020,134(23):3175-3193.
[3] Li D, Liu Y, Zeng X, et al. Quantitative Study of the Changes in Cerebral Blood Flow and Iron Deposition During Progression of Alzheimer’s Disease[J]. Journal of Alzheimer's Disease,2020,78(1):439-452.
[4] Deh K, Zaman M, Vedvyas Y, et al. Validation of MRI quantitative susceptibility mapping of superparamagnetic iron oxide nanoparticles for hyperthermia applications in live subjects[J]. Sci Rep,2020,10(1):1171.
[5] Simchick G, Liu Z, Nagy T, et al. Assessment of MR‐based and quantitative susceptibility mapping for the quantification of liver iron concentration in a mouse model at 7T[J]. Magnetic Resonance in Medicine,2018,80(5):2081-2093.
Figures