2528
Explore the performance of FF and R* value measured by mDIXON-quant for heathy controls, mild and acute CKD patients.1Dalian Medical University, Dalian, China, 2The First Affiliated Hospital Of Dalian Medical University, Dalian, China, 3Philips Healthcare, Beijing, China
Synopsis
Early diagnosis and treatment of chronic kidney disease (CKD) can significantly improve the prognosis and reduce the occurrence of end-stage renal disease. This study aims to explore the performance of fat-fraction and R* value measured by mDIXON-quant for differential diagnosis between heathy controls, mild and acute CKD patients. The renal cortex R2* values of CKD patients (mild or severe) were significantly higher than those of heathy controls. The fat fraction in renal cortex and medulla of acute CKD patients was significantly higher than those mild CKD patients and healthy controls.
Introduction
Chronic kidney disease (CKD) is a kind of disease associated with chronic progress in structural and functional degeneration of kidney. The early diagnosis and treatment of CKD can significantly improve the prognosis of patients and reduce the occurrence of end-stage renal disease. The mDIXON-Quant imaging enables reliable separation of water and fat signals, as well as accurate mapping of fat-fraction and R* values, which allow quantitative evaluation of hypoxic degree and fat deposition in tissues. This study aims to explore the performance of fat-fraction and R* value measured by mDIXON-Quant for differential diagnosis between heathy controls, mild and acute CKD patients.Methods
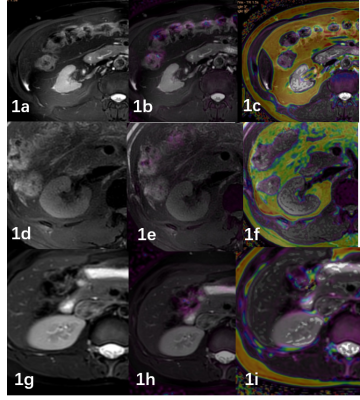
This study collected 36 chronic kidney disease (CKD) cases from the First Affiliated Hospital of Dalian Medical University, and divided them into mild (18 subjects) and acute CKD (18 subjects) groups according to the eGRF[MOU1] . 25 healthy volunteers(mean age 33, age range:24-60 years; 5 males, 20 females). All patients and volunteers underwent mDixon Quant imaging of kidney on a 3.0T MR scanner (Ingenia CX; Philips Healthcare, the Netherlands). An extra T2 weighted (T2w) imaging sequence was scanned to confirm the absence of any visible lesions. The detailed scanning parameters were listed in Table 1. With reference to the fusion of T2w and mDixon Quant images on the Intellispace Portal workstation (Philips Healthcare), circle regions of interest (ROIs) were manually drawn by two radiologists (independently) on the renal cortex and medulla in three slices of mDixon Quant images (the slice with maximum kidney diameter and its adjacent (6 mm apart) upper and lower slices) on the right kidney (Figure 1). ROI sizes for cortex and medulla were approximate 10 and 30 mm², respectively. The consistency of renal cortex and medulla measurement between the two observers were tested using intra-class correlation coefficients (ICC) in SPSS 22.0 (IBM). The average value of measurement data was used for follow-up statistical analyses. The R2* and FF values for right renal cortex and medulla were compared among the healthy control, mild and acute CKD groups by t test.Results
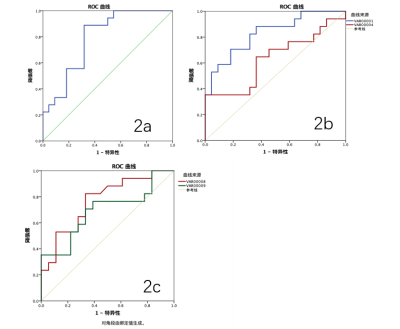
The R2* values of renal cortex in mild () or acute () CKD patients were significant higher than those of heathy controls () (p<0.05). The area under the ROC curve (AUC) of R2* value for differential diagnosis between heathy controls and mild CKD patients was 0.788. And the diagnostic sensitivity and specificity were 88.9% and 68.2% with a cut-off value of 15.85 ms.Conclusion and Discussion
The renal cortex R2* values of CKD patients (mild or severe) were significantly higher than those of heathy controls, suggesting that the renal cortex of CKD patients is relatively hypoxic, and the degree of hypoxia gradually increases with the severity of hypertension damage. The R2* value in renal medulla of CKD patients was also relatively higher than in heathy controls (not statistically significant), which is consistent with the trend of renal damage hypoxia. The less sensitivity of R2* value in the medulla region may because of the effects from increased water content, blood volume, hematocrit and distribution of capillary. CKD patients can be associated with dyslipidemia, glomerular sclerosis and interstitial fibrosis, which may result in the significantly increased fat fraction in renal cortex and medulla of acute CKD patients than those mild CKD patients and healthy controls. It is unclear why the renal FF value was observed relatively lower in mild CKD patients than in healthy controls. In summary, the R2* value and fat fraction by mDIXON-Quant may help clinical diagnosis of CKD with quantitative evaluation of hypoxia and lipid deposition in renal tissues.Acknowledgements
No acknowledgement found.References
1. Global kidney health 2017 and beyond: a roadmap for closing gaps in care, research, and policy[J]. Lancet, 2017, 390(10105).
2. Bonventre JV. Primary proximal tubule injury leads to epithelial cell cycle arrest, fibrosis, vascular rarefaction and glomerulosclerosis[J]. Kidney Int Suppl, 2014, 4(1): 39- 44.
3. Hines CD, Yu H, Shimakawa A,et a1.T1 independent T2*eorrected MRl with accurate spectral modeling for quantification of fat: validation in a fat water SPIO phantom[J]. J Magn Reson Imaging,2009,30(5):1215 1222.
4. J Quantification of hepatic macrosteatosis in living, related liver donors using T1-independent, T2*-corrected chemical shift MRI[J]. Journal of Magnetic Resonance Imaging, 2012.
5. de Castro UG, dos Santos RA, Silva ME et al. Age-dependent effect of high-fructose and high-fat diets on lipid metabolism and lipid accumulation in liver and kidney of rats [J]. Lipids Health Dis,2013,12:136.
6. Xiang DM,Song XZ,Zhou ZM,et al.Chronic kidney disease promotes chronic inflammation in visceral white adipose tissue[ J]. Am J Physiol Renal Physiol,2017,312 (4): F689-F701.
Figures


Fig1. A 50-year-old male with CKD grade 5,eGFR was 7.87ml/min (1a). T2WI image. (1b)R2* image (1c). FF image.
A 40-year-old male with CKD grade 1,eGFR was 124.09ml/min (1d). T2WI image. (1e)R2* image (1f). FF image
A 31-year-old female volunteer (1g). T2WI image. (1h)R2* image (1i). FF image

Fig2. Diagnostic efficiency curve of the R2* values in heathy controls and mild CKD patients (2a).
Diagnostic efficiency curve of the R2* values in heathy controls and acute CKD patients (2b).
Diagnostic efficiency curve of the FF values in mild CKD patients and acute CKD patients (2c).