2526
Detection of fibrosis in patients with moderate renal impairment with multiparametric MRI1Translational and Clinical Research Institute, Newcastle University, Newcastle upon Tyne, United Kingdom, 2Centre for In Vivo Imaging, Newcastle University, Newcastle upon Tyne, United Kingdom, 3South Tees Hospitals NHS Foundation Trust, Middlesborough, United Kingdom, 4GlaxoSmithKline, Philadelphia, PA, United States, 5University of Sheffield, Sheffield, United Kingdom
Synopsis
A multiparametric renal MRI scan protocol was employed to characterise the impact of renal fibrosis on tissue relaxation properties. The study recruited patients with moderate renal dysfunction (CKD stage 3, eGFR between 30 and 60 ml/min/1.73 m2) with biopsy-proven fibrosis and age-matched healthy volunteers. Statistically significant differences in kidney cortical native T1 and T2 were observed between patients and controls, ascribed to tissue microstructural changes associated with the mild fibrosis observed in the patient group.
Introduction
Chronic Kidney Disease (CKD) is common, affecting up to 10% of the population, associated with an increase in morbidity and mortality and a risk of progression to kidney failure. On biopsy patients with progressive disease have evidence of scarring, with fibrous tissue replacing the functioning units of the kidney. Treatments to stop fibrosis potentially would have a significant impact but development of new drugs has been slow, partly because it is difficult to monitor the level of fibrosis without biopsy.We recruited patients with moderate renal impairment and a cohort of healthy volunteers. We measured renal T1 and T2 to report on cortical and medullary tissue composition and T2* to as a metric of blood oxygen level-dependent (BOLD) contrast with the aim assessing the difference in tissue relaxation rates associated with biopsy-confirmed renal fibrosis.Methods
Ethical approval was granted by the NHS Health Research Agency, UK, and sponsored by the Newcastle upon Tyne Hospitals NHS Foundation Trust. Patients (n=10) with biopsy-confirmed renal fibrosis and moderate renal impairment (eGFR between 30 and 60 ml/min/1.73m2) and healthy volunteers (n=7) were recruited to the study. Clinical data on fibrosis grade from biopsy samples obtained from study participants as part of their standard clinical care graded by a pathologist on a four point scale (0 = none, 1 = mild, 2 = moderate, 3 = severe). Participants attended for a study visit comprising collection of blood and urine samples followed by an MR scan session with administration of gadolinium-based contrast agent (Dotarem, half standard dose). MR data were acquired on a Philips Achieva 3T and torso receive array coil. The scan protocol employed acquisition under expiration breathhold (except for the DCE scan) with scan resolution of 1.4 x 1.4 x 7mm over an FOV of 448 x 375mm. The protocol comprised a modified look-locker inversion recovery (MOLLI) sequence for T1 mapping (TR/TE = 3.1/0.96 ms, flip = 25°, inversion delay = 350ms) , BOLD R2* acquired with a multiple gradient echo sequence (TR/TE/delta TE = 51/5/3 ms, flip = 25°), T2mapping acquired with a GRASE sequence (TR/TE/shot = 873/17/85 ms, flip = 90°, SPAIR fat-suppression), DCE-MRI (2D IR-FFE, flip = 25°, TR/TE = 3.5/1.62ms, 1.2sec dynamic resolution, 250 dynamics), and a second T1 map acquisition after contrast agent administration. Relaxation rate maps were calculated from MRI data by the scanner’s built-in software. Regions of interest were drawn using Horos (www.horoproject.net) on cortical and medullary regions on a central slice through each kidney. Typical ROI selection comprised two cortical regions and 6-9 medullary regions. ROI size-weighted means were calculated for each participant, and the mean and standard deviation calculated across each cohort for each relaxation rate. Regional ADC was assessed but data quality was considered too low for analysis, likely due to motion effects. Statistical significance (p<0.05) of differences in relaxation parameters between the patient and control groups was determined by t-test using SPSS.Results
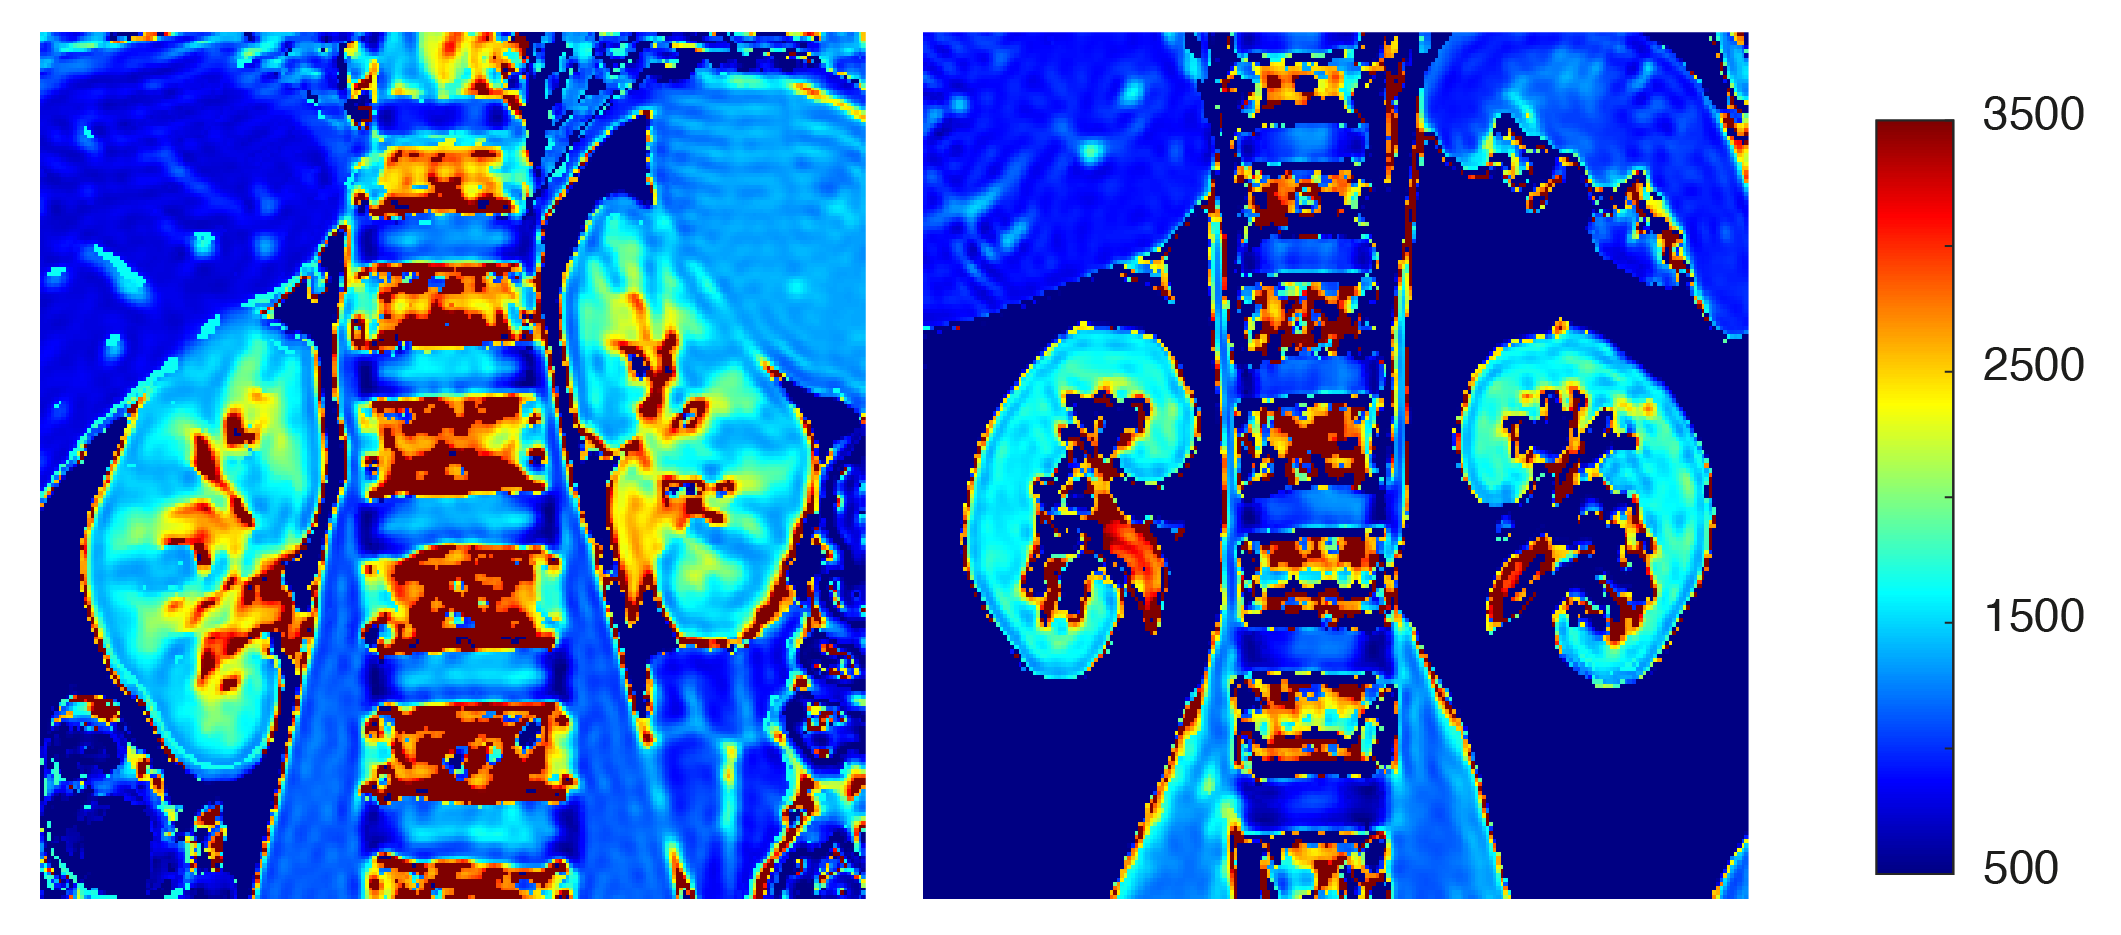
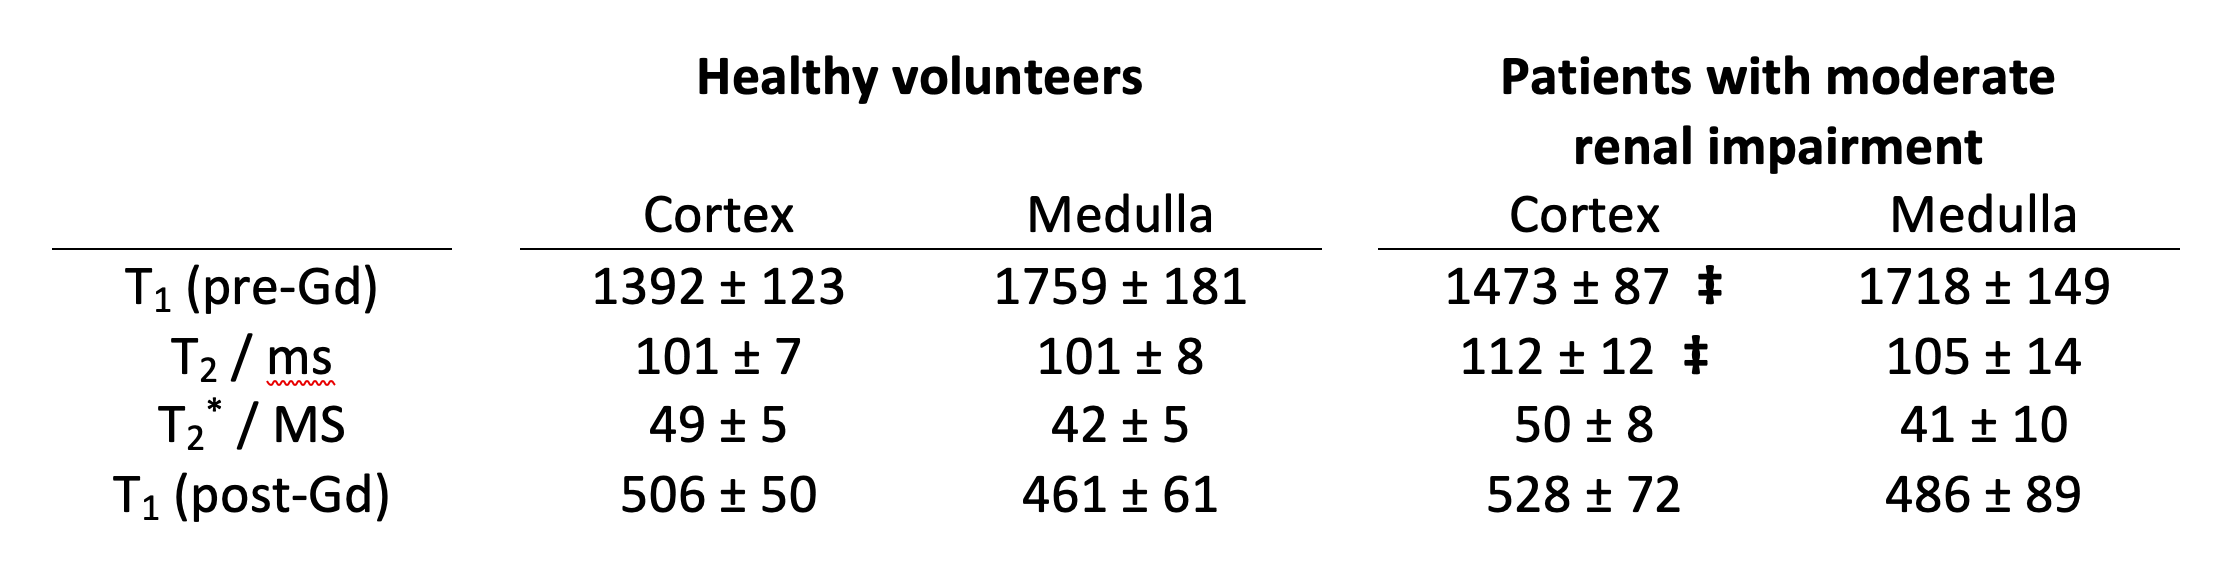
Patients with moderate renal impairment had a mean eGRF of 50 ± 7 mL/min/1.73m2 and a mean age of 49 ± 17 years. Healthy volunteers had eGFR > 90 mL/min/1.73m2 and a mean age of 42 ± 13 years. Mean fibrosis score for the patient cohort was 1.3 ± 0.5 on a scale ranging from 0 (none) to 3 (severe). Figure 1 shows a representative T1 map for data acquired from a patient with moderate renal impairment. Table 1 shows measured renal cortical and medullary native T1, T2, T2* and post-contrast agent T1. for the two participant groups. A statistically significant difference between patients and healthy volunteers for cortical native T1 and T2 relaxation times (p<0.05). No statistically significant differences were observed between the two cohorts for cortical T2* and post-contrast T1, or for any of the measured relaxation rates in medullary regions of interest.Discussion
Our data demonstrate a difference in cortical native T1 and T2 between the patients with biopsy-proven renal fibrosis and healthy volunteers, which we ascribe to changes in tissue microstructure associated with fibrosis causing an increase in the T1 of tissue water protons. T1 measurement has been demonstrated as a sensitive biomarker of cardiac fibrosis (1) and a number of studies have reported an increase in T1 associated with renal fibrosis (eg: 2-4). Studies have also demonstrated that diffusion measurements provide a more sensitive fibrosis index than T1 measurement (5,6). Consensus papers on methods for renal MRI have recently been published (7-11), which provide direction on study design for future renal multiparametric renal studies that aids comparison between different sites and studies.Conclusions
Our data demonstrate a change in the native T1 and T2 of renal cortex of patients with moderate renal impairment with biopsy-proven fibrosis. Multiparametric renal MRI offers potential as a method to monitor change in renal structure and function associated with pathology. Current efforts to form consensus on optimised renal multiparametric scan acquisition and data processing methods will foster multi-site studies and comparison of data from separate studies.Acknowledgements
This project was funded by GlaxoSmithKline.References
(1) Messroghli DR et al. Modified Look-Locker inversion recovery (MOLLI) for high-resolution T1 mapping of the heart. Magn Reson Med. 2004 Jul;52(1):141-6.
(2) Friedli I et al. New Magnetic Resonance Imaging Index for Renal Fibrosis Assessment: A Comparison between Diffusion-Weighted Imaging and T1 Mapping with Histological Validation. Sci Rep. 2016 Jul 21;6:30088.
(3) Buchanan et al. Quantitative assessment of renal structural and functional changes in chronic kidney disease using multi-parametric magnetic resonance imaging. Nephrol Dial Transplant. 2020 Jun 1;35(6):955-964.
(4) Graham-Brown MP et al. Association between native T1 mapping of the kidney and renal fibrosis in patients with IgA nephropathy. BMC Nephrol. 2019 Jul 11;20(1):256.
(5) Berchtold L et al. Validation of the corticomedullary difference in magnetic resonance imaging-derived apparent diffusion coefficient for kidney fibrosis detection: a cross-sectional study. Nephrol Dial Transplant. 2020 Jun 1;35(6):937-945.2.
(6) Berchtold L et al. Diffusion magnetic resonance imaging detects an increase in interstitial fibrosis earlier than the decline of renal function. Nephrol Dial Transplant. 2020 Jul 1;35(7):1274-1276.
(7) Dekkers IA et al. Consensus-based technical recommendations for clinical translation of renal T1 and T2 mapping MRI. MAGMA. 2020 Feb;33(1):163-176.
(8) Mendichovszky I et al. Technical recommendations for clinical translation of renal MRI: a consensus project of the Cooperation in Science and Technology Action PARENCHIMA. MAGMA. 2020 Feb;33(1):131-140.
(9) Bane O et al. Consensus-based technical recommendations for clinical translation of renal BOLD MRI. MAGMA. 2020 Feb;33(1):199-215.
(10) Nery F et al. Consensus-based technical recommendations for clinical translation of renal ASL MRI. MAGMA. 2020 Feb;33(1):141-161.
(11) Ljimani A et al. Consensus-based technical recommendations for clinical translation of renal diffusion-weighted MRI. MAGMA. 2020 Feb;33(1):177-195.
Figures