2525
Severity of Tubular Atrophy and Fibrosis in Acute Kidney Injury Revealed by Multi-parametric MRI1Vanderbilt University Institute of Imaging Science, Vanderbilt University Medical Center, Nashville, TN, United States, 2Department of Radiology and Radiological Sciences, Vanderbilt University Medical Center, Nashville, TN, United States, 3Division of Nephrology and Hypertension, Vanderbilt University Medical Center, Nashville, TN, United States
Synopsis
Acute kidney injury (AKI) is a predictor of mortality, often resulting in incomplete recovery, giving rise to chronic kidney disease (CKD). AKI is defined in clinical practice as a rapid decline in kidney function that occurs over a 7-day period or less, but concerns about the risks of renal biopsies in patients with AKI have limited our ability to identify diagnostic features that are predictive of CKD progression. Multi-parametric MRI, including quantitative spin-lock imaging, relaxometry, and magnetization transfer, can be used to identify features of experimental AKI that are predictive of CKD progression without need for renal biopsy.
Purpose
Ischemia reperfusion injury (IRI) is one of the common contributions to acute kidney injury (AKI). Tubular atrophy and fibrosis are characteristic features of AKI. In this study, we evaluated the ability of parameters derived from quantitative magnetization transfer, MRI relaxometry, and spin-lock relaxation R1ρ dispersion imaging, for detecting structural damage and functional alterations in a murine model of AKI.Methods
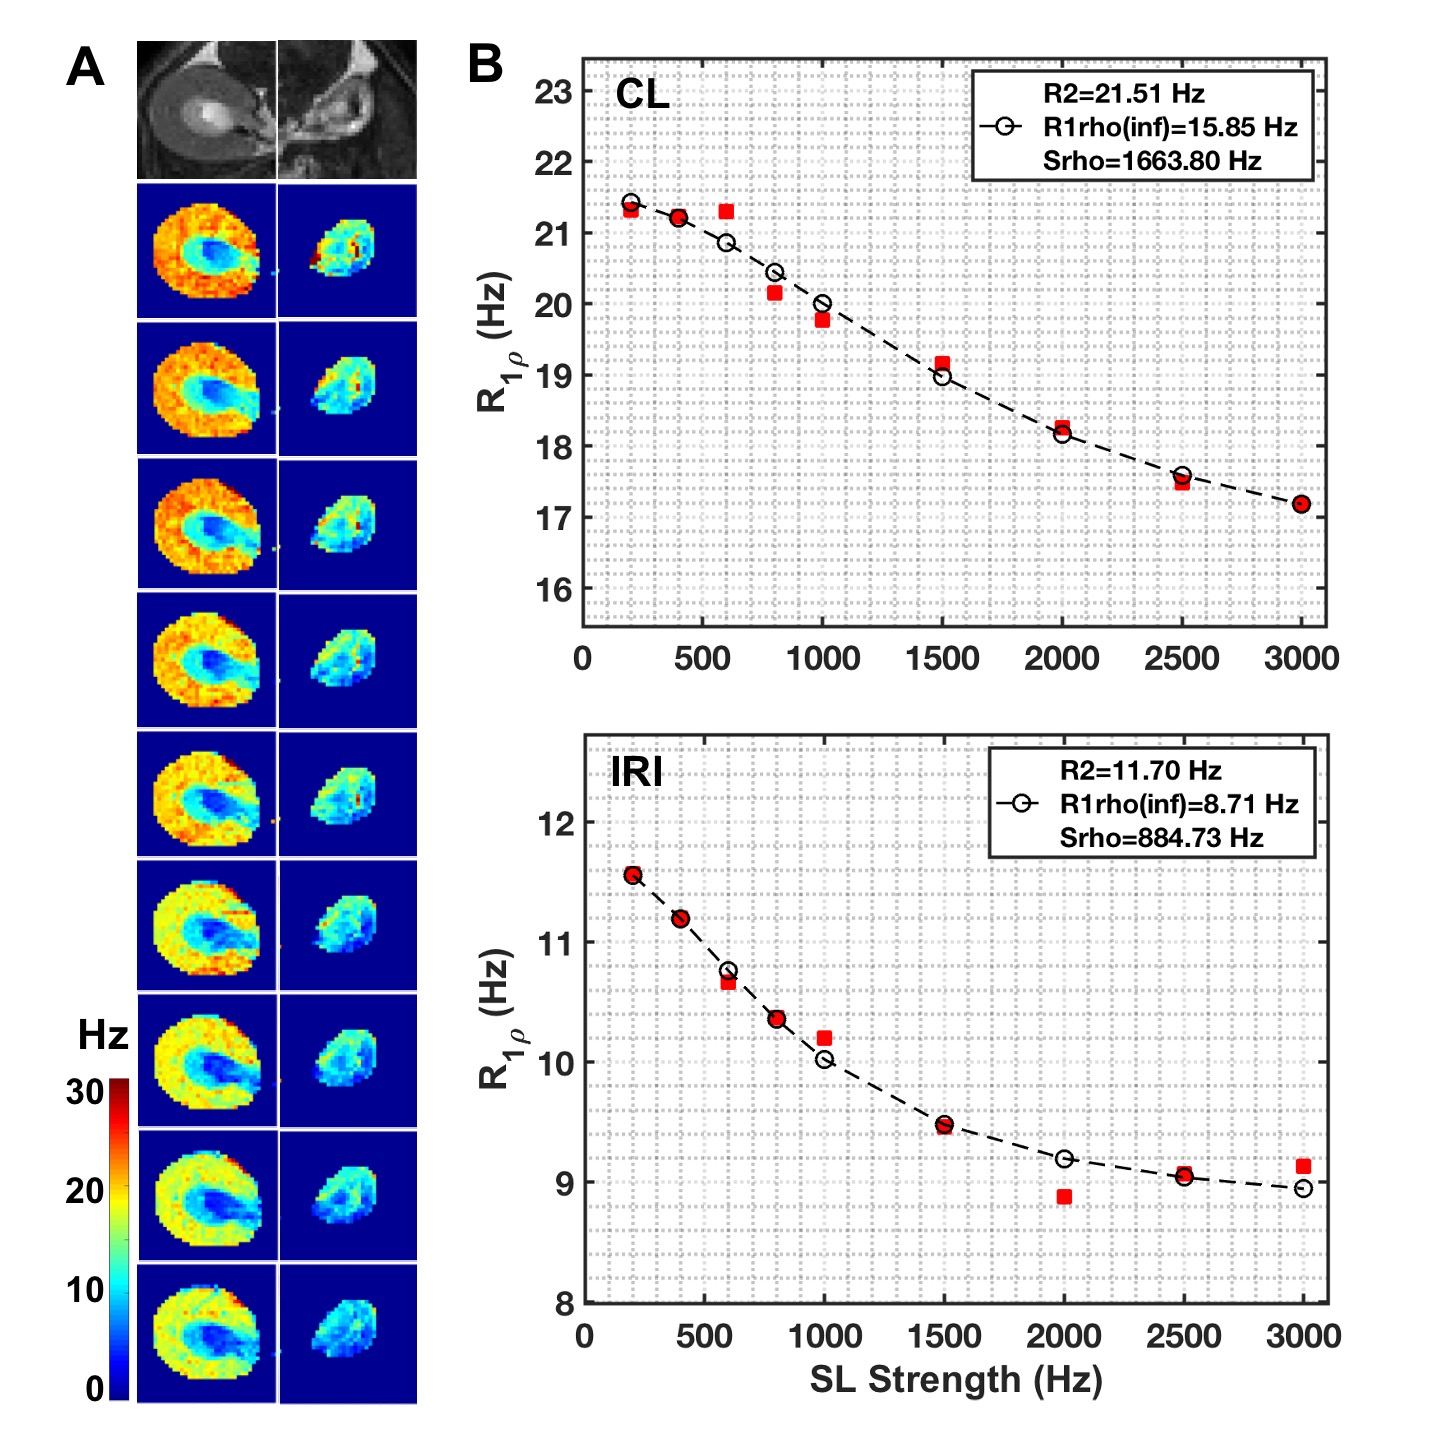
The 8-week old male C57BL/6J mice first underwent acute kidney injury induced by a unilateral ischemia-reperfusion injury (IRI) for 45 mins. Then they were imaged by MRI at 7T 56 days after IRI. Spin-lock images were acquired in a transverse plane using a fast spin echo sequence preceded by a preparatory spin-lock cluster. A series of images were acquired with different locking fields and the dispersion of R1ρ with locking frequency was fit to a two-pool model that includes chemical exchange as described by Chopra et al.1 The fits provided values of transverse relaxation rate R2fit, R1ρ at infinite spin-lock frequency (R1ρinf), and an exchange rate-weighted parameter Sρ. A fast spin-echo (FSE) sequence (TR = 5500 ms; RARE-factor = 4, resolution = 0.25x0.25x1 mm3) was used to achieve T2 contrast and calculate R2 (=1/T2) maps (multiple TE at 14, 42, 70, 98, 126 ms). R1 was measured by variation of repetition time (TR at 308, 400, 800, 1500, 3000 and 5500 ms). R2* was measured using gradient echo sequence by variation of echo time (multiple TE equally spaced from 1.9 to 38.3 ms). The qMT data acquisition has been described in detail in our previous studies and incorporates a series of images acquired with off-resonance saturating pulses at different powers and frequencies2-3 which are then fit to a two-pool model to provide estimates of the pool size ratio (PSR). Magnetization transfer ratio (MTR)4 has also been calculated for comparison. The significances of differences in derived parameters between groups were evaluated using Student’s t-tests. Paraffin tissue sections were stained using Masson trichrome.Results
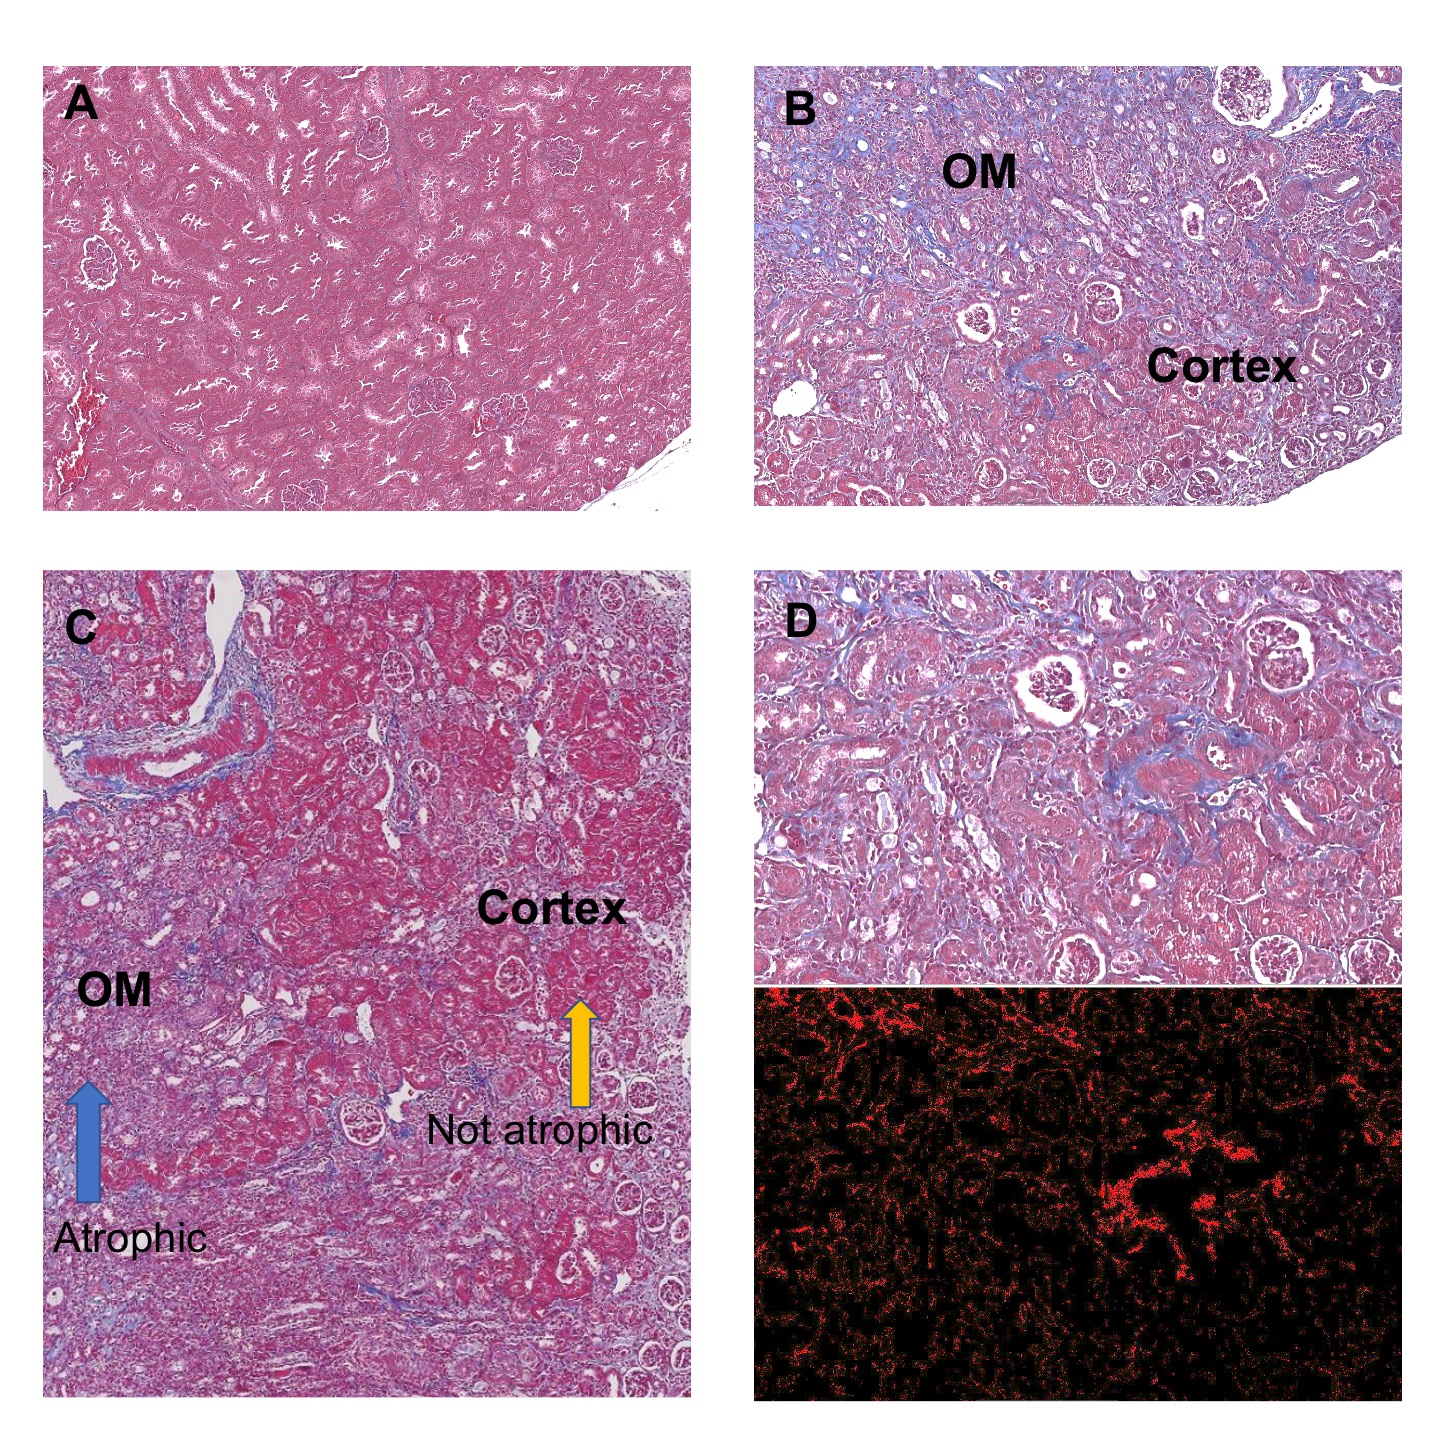
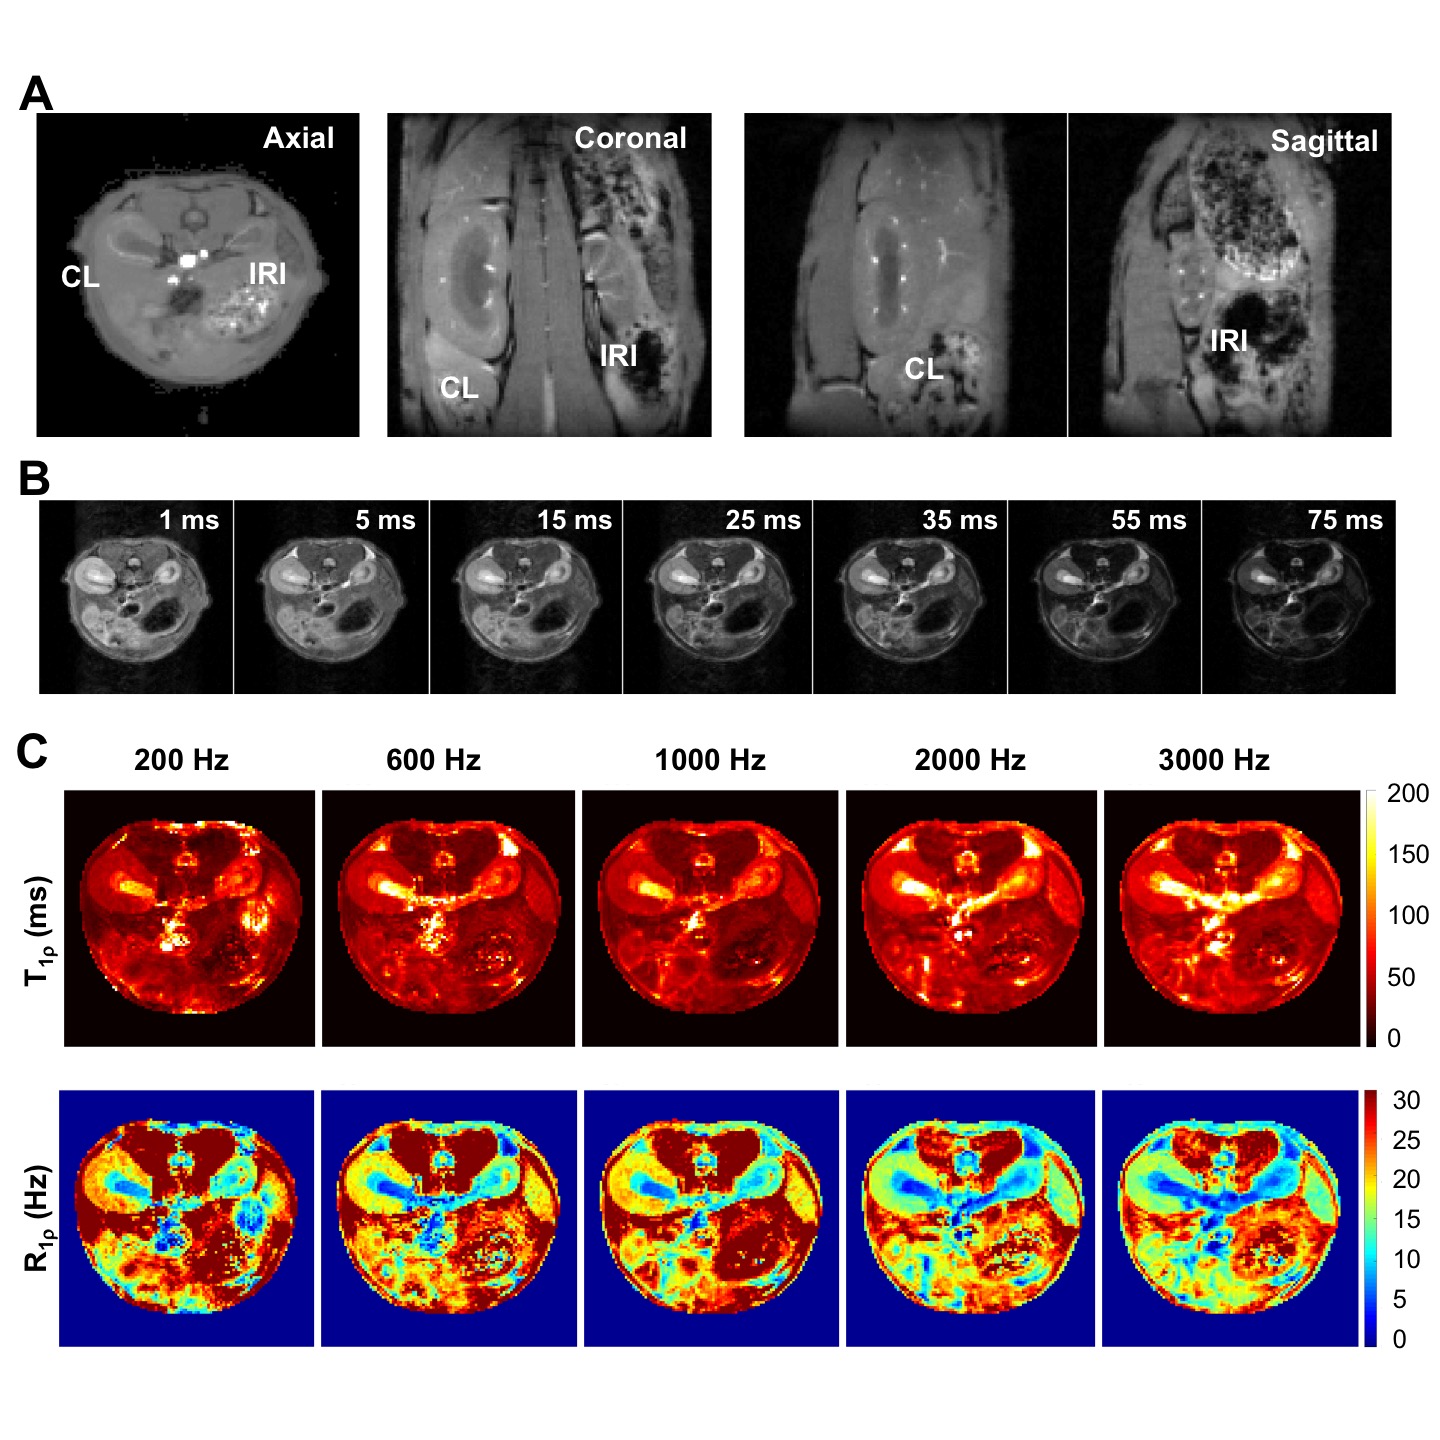
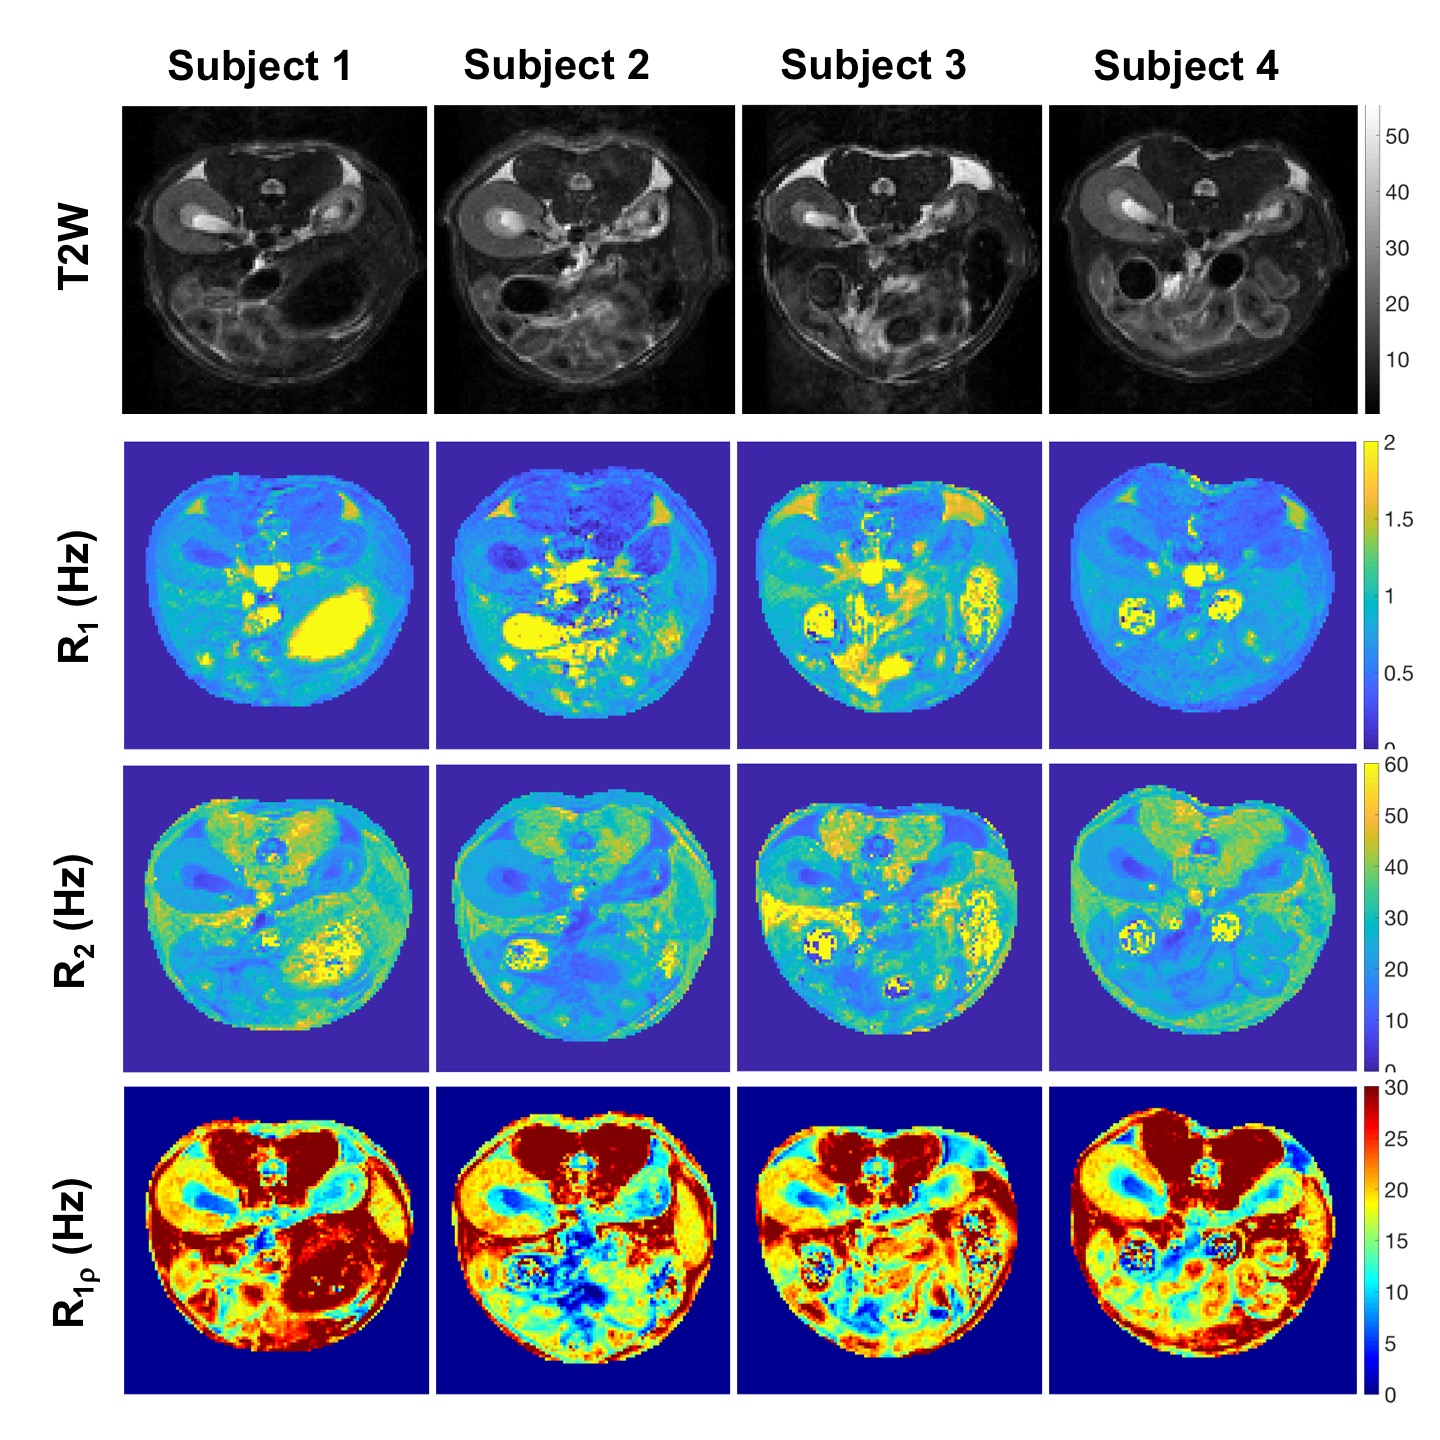
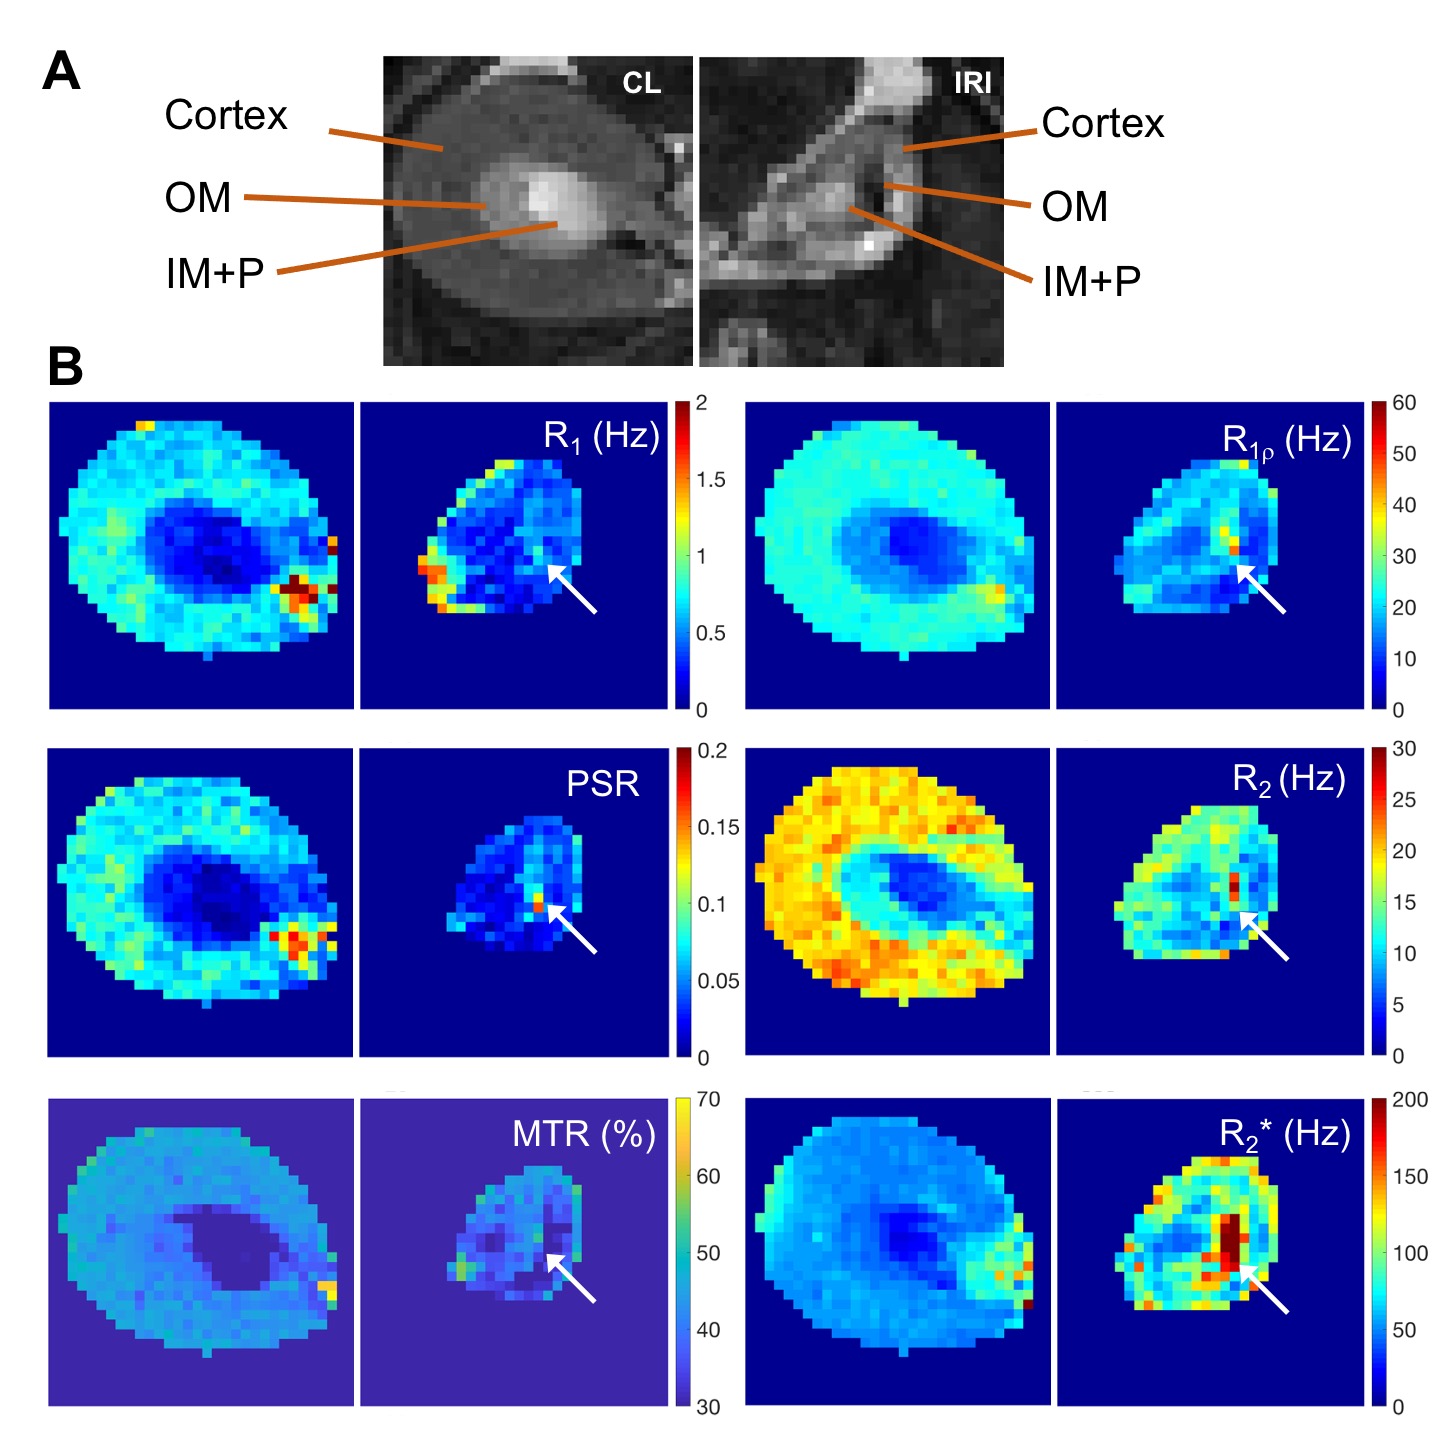
Histology detected extensive tubular atrophy and moderate to severe fibrosis in the cortex and outer medulla of IRI kidneys (Fig. 1). T1- and T2-weighted images showed evident volume shrinkage of IRI kidneys (Fig. 2). Evident decreases in R1, R2 and R1ρ were observed in IRI compared to CL (control lateral) kidneys (Fig. 3), with R1ρ showing most significant changes. We integrated values over ROIs corresponding to the cortex or outer medulla (OM) for data fitting (Fig. 4). The exchange parameter Sρ changed by the largest factor among the parameters obtained. Among all the MRI parameters, Sρ values dropped by the largest factor as tubular atrophy and fibrosis occurred. We used T2-weighted images to differentiate cortex, OM, and inner medulla plus papilla (IM+P) in kidneys (Fig. 5). Even though IRI kidneys shrank drastically, the cortex and OM can be distinguished because their T2 values change in different directions. Decreases in PSR, MTR, R1, R2 and R1ρ were observed in cortex. However, they changed in opposite directions in OM. In addition, R2* showed significant increases in OM of the IRI kidney.Conclusion
Tubular atrophy and tubulointerstitial fibrosis in kidneys can be assessed by pool size ratio, relaxation rates and parameters derived from R1ρ dispersion. Spin-lock MRI provides measures with higher sensitivity than R1 and R2, and more specific information about changes in exchange processes, which may be useful as a novel imaging approach to assess abnormal features in acute kidney diseases. R2* is a leading MRI measure for assessing renal function.Acknowledgements
We thank Mr. Fuxue Xin, Dr. Daniel C. Colvin, Mr. Jarrod True, and Dr. Mark D. Does in the Center for Small Animal Imaging at Vanderbilt University Institute of Imaging Science. This work was supported by National Institutes of Health grants DK114809 and EB024525. This work was also supported by grant 1S10OD019993-01 for the Advance III HD Console, housed in the Vanderbilt Center for Small Animal Imaging.References
1. Chopra S, Mcclung RED, Jordan RB. Rotating-frame relaxation rates of solvent molecules in solutions of paramagnetic-ions undergoing solvent exchange. J Magn Reson. 1984;59(3):361-372.
2. Wang F, Katagiri D, Li K, et al. Assessment of renal fibrosis in murine diabetic nephropathy using quantitative magnetization transfer MRI. Magn Reson Med. 2018;80(6):2655-2669.
3. Wang F, Wang SW, Zhang YH, et al. Noninvasive quantitative magnetization transfer MRI reveals tubulointerstitial fibrosis in murine kidney. NMR Biomed. 2019;32(11):e4128.
4. Wang F, Jiang R, Takahashi K, et al. Longitudinal assessment of mouse renal injury using high-resolution anatomic and magnetization transfer MR imaging. Magnetic resonance imaging. 2014;32(9):1125-1132.
Figures