2524
BOLD MRI for evaluating intra-renal oxygenation level during acute saline loading1Medical College of Wisconsin, Milwaukee, WI, United States
Synopsis
Enhanced sensitivity of blood pressure to salt intake is observed in many hypertensive patients. The kidney plays a key role in the development of hypertension including salt-sensitive hypertension. In this study, we used BOLD MRI to examine the temporal response of renal medullary and cortical oxygenation levels during saline infusion in a small set of young subjects. The results showed that during the period of fast saline infusion, tissue oxygenation levels remained almost constant in the cortex but showed 10%-15% average reduction in the medulla. The responses, however, varied between subjects, which may reflect differences in salt-sensitive versus salt-insensitive individuals.
Introduction
Hypertension affects approximately 45% of the adult population in the US, and less than one half of hypertensive patients have their blood pressure adequately controlled. Enhanced sensitivity of blood pressure to salt intake is observed in many hypertensive patients. The kidney, including the renal medulla, plays a key role in the development of hypertension including salt-sensitive hypertension. MRI transverse relaxation constant T2* is commonly used to quantitatively assess oxygenation changes. The apparent spin-spin relaxation time T2*, is directly related to the tissue content of oxyhemoglobin. Increases in T2* values imply an increase in the oxygenation of hemoglobin and thus improved blood oxygenation. Therefore, estimated changes using blood-oxygenation level dependent (BOLD) MRI can be interpreted as changes in tissue pO2. In this study, we used T2*-weighted BOLD imaging on a 3T MRI scanner to examine the temporal response of renal medullary and cortical oxygenation levels during saline infusion in a small set of young subjects.Methods
Four healthy, young subjects (two females, two males) with no prior history of renal disease participated in this study. All of the participants gave informed consent according to the protocol approved by the Institutional Review Board before taking part in the study. Dynamic BOLD images were acquired in a coronal slice covering both kidneys. Scanning continued for 60 min with acquisition rate of ~one slice per minute. The subjects received baseline saline infusion at rate of 10 ml/h for 5 minutes, followed by higher rate of infusion of 500 ml/h for 50 minutes, and finally back to low infusion rate of 10 ml/h for the last five minutes of the experiment. MRI scans were performed on a 3T, 70cm wide-bore Premier MRI scanner (GE Healthcare, Milwaukee, WI, USA). The scanner had a maximum gradient strength of 80 mT/m and a slew rate of 200 mT/m/ms. An AIR coil was utilized for signal reception. A T2*-weighted BOLD sequence with eight echoes was used to acquire data during a 12 second breath-hold. The imaging parameters were as follow: repetition time (TR) = 16.8 ms, echo time (TE) = 2-14.9 ms (eight echoes in equal increments), flip angle = 20°, field of view (FOV) = 40x40 cm2, acquisition matrix = 192x192, slice thickness = 6 mm, bandwidth = 651 Hx/pixel, # averages = 1. T2* maps were constructed using cvi42 software (Circle, Calgary, Canada) by fitting a single exponential function to the signal intensity versus echo time data pixel-wise. The acquired images were processed to measure temporal changes in the medulla and cortex T2* during saline infusion.Results
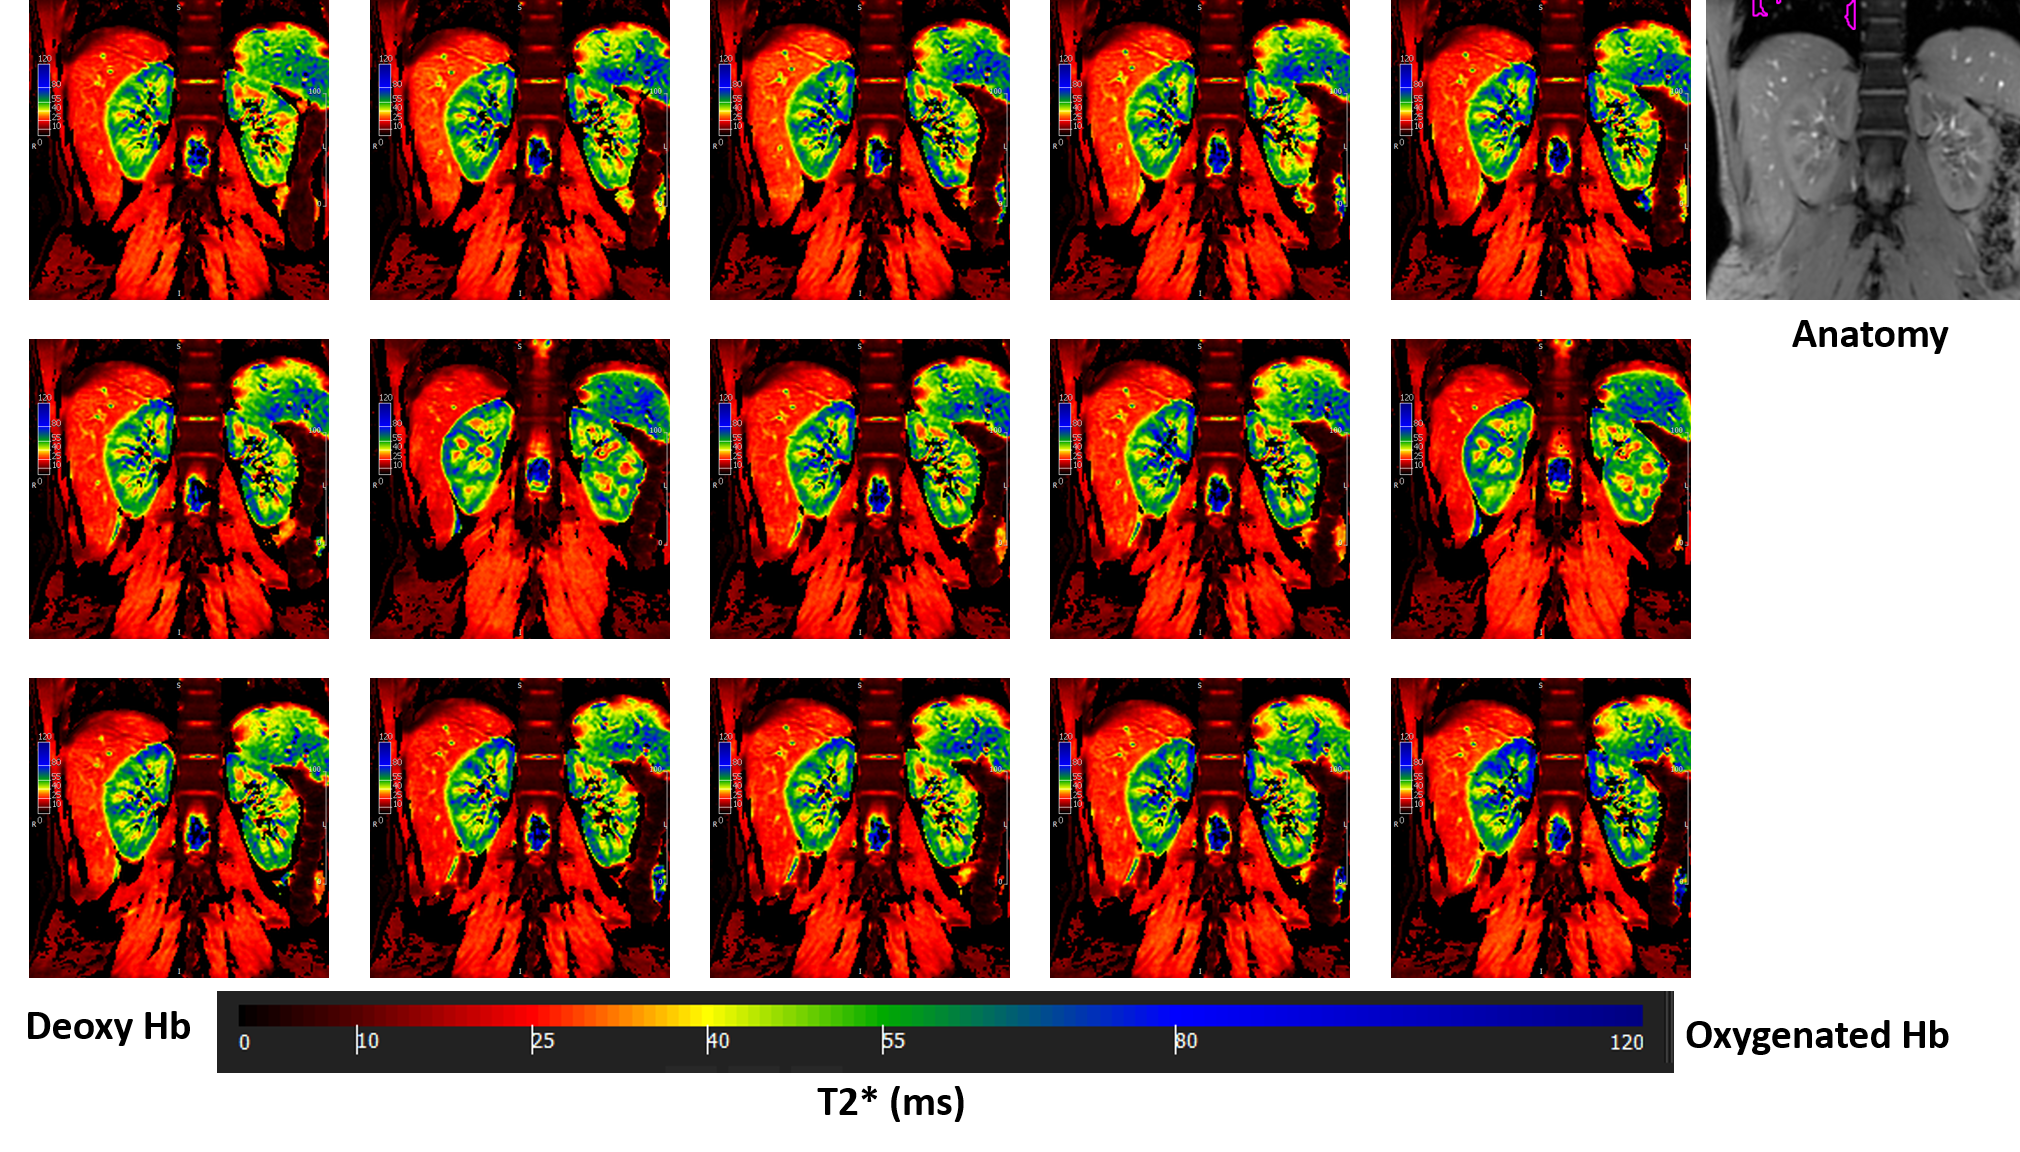
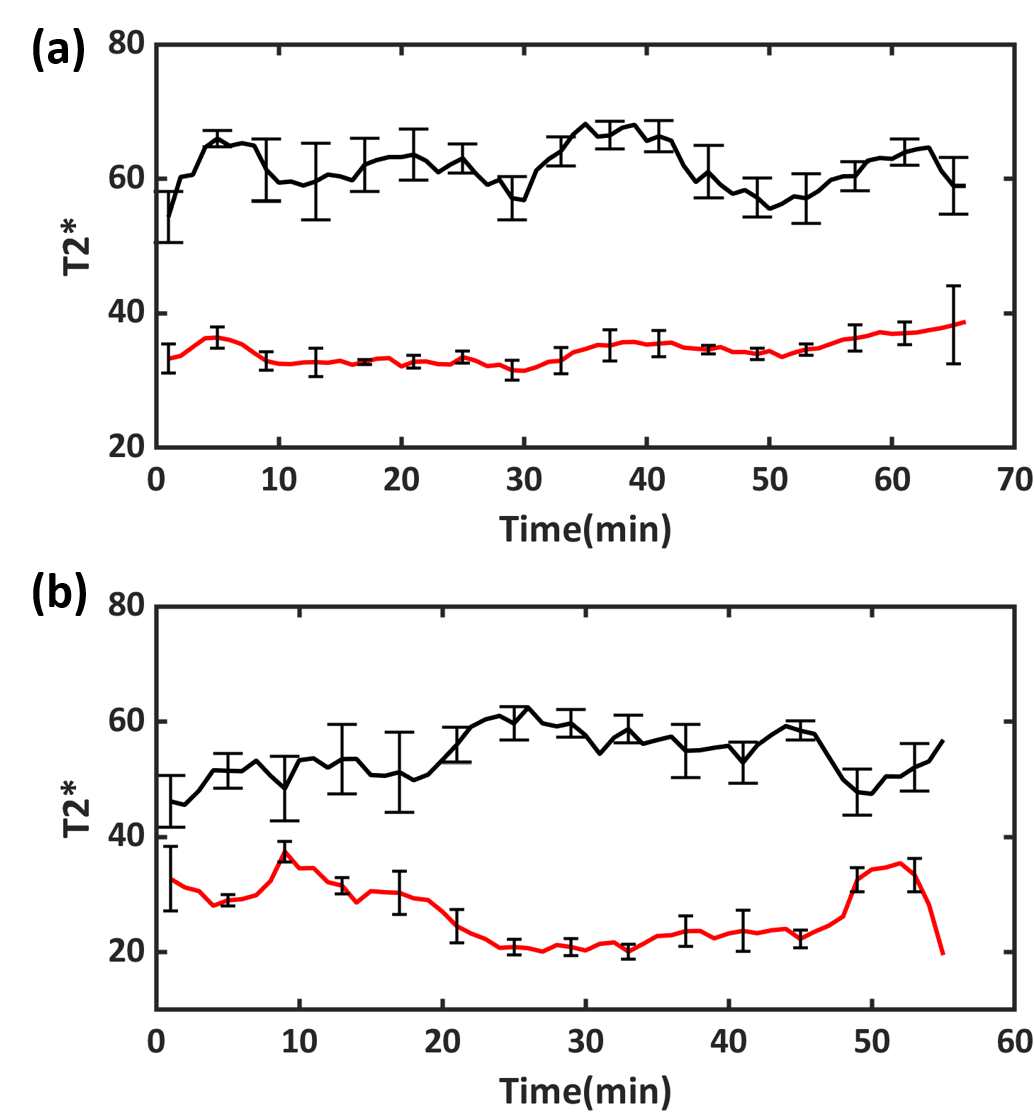
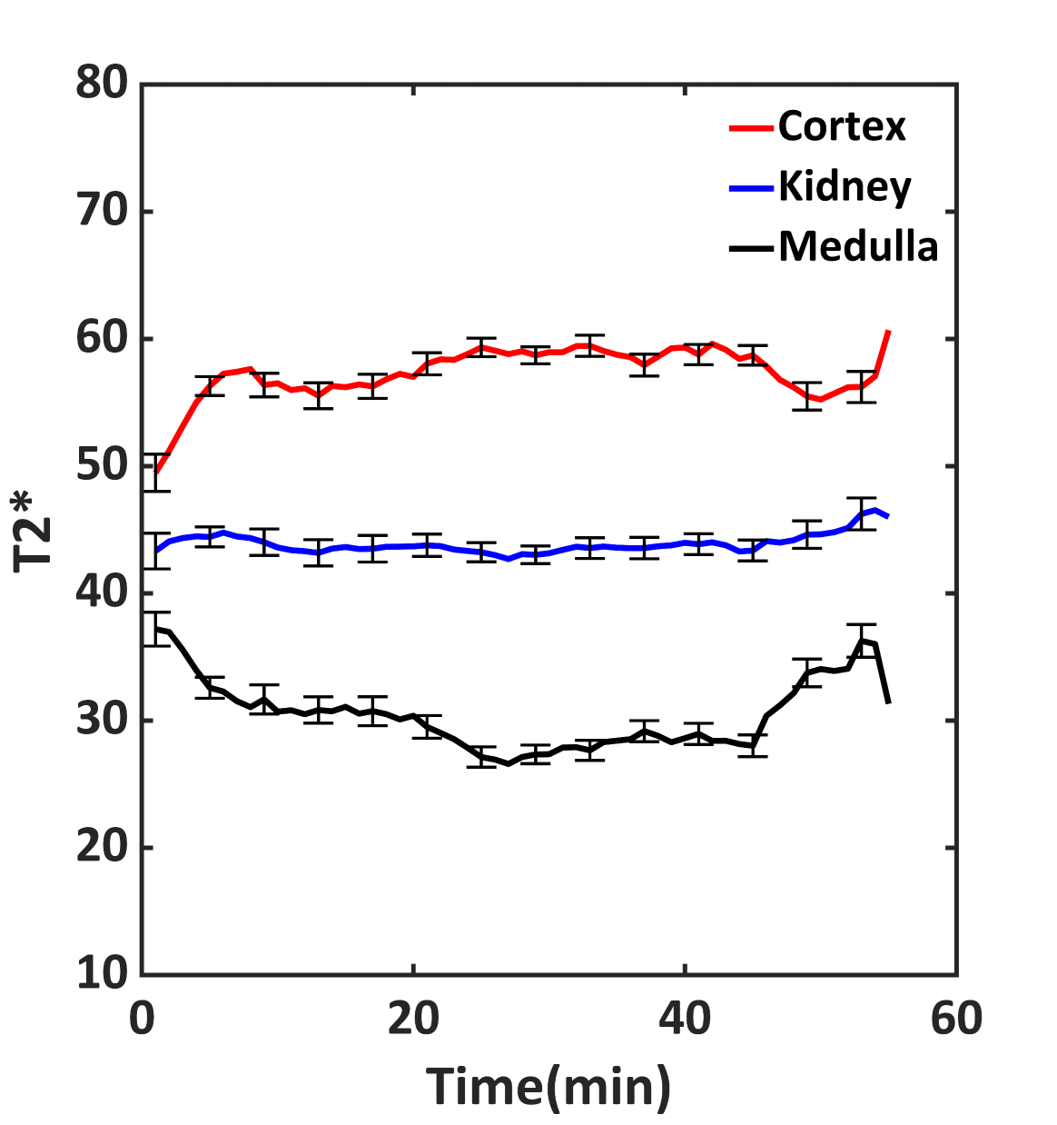
Figure 1 shows example BOLD T2* maps acquired every ~4 minutes in one of the imaged subjects. On average, the T2* measurements showed slight reduction (rate of 1.1ms decrease of T2* per minute of infusion) and increase (rate of 1.6ms increase of T2* per minute of infusion) in the oxygenation levels of the medulla and cortex, respectively, during the slow saline infusion in the beginning of the experiment. This pattern was reversed during the slow saline infusion toward the end of the experiment (rates of 0.9ms increase and 0.3ms decrease of T2* in the medulla and cortex, respectively, per minute of infusion). During the period of fast saline infusion, tissue oxygenation levels, shown as T2*, remained almost constant in the cortex but showed, on average, a reduction of approximately 10% to 15% in the medulla. The responses, however, varied between subjects. Two subjects did not show any reduction in the medulla, one showed substantial reduction, and the other one fluctuated. Representative T2* levels during the whole experiment in two subjects are shown in Figure 2. The average T2* measurements during the whole experiment in all subjects were 57±2 ms (mean ± SD), 30±2.7 ms, and 44±0.76 in the cortex, medulla, and whole kidney, respectively (Figure 3).Discussion and Conclusions
Using BOLD MRI, we were able to observe changes in oxygenation level in the renal medulla and cortex during slow and fast saline infusion. The interest in medullary hypoxia is that the kidneys have evolved to deal with it by developing a number of protective endogenous mechanisms, such that the compromise to one or more of these protective mechanisms may lead to acute renal failure. Therefore, an efficient method for non-invasively evaluating oxygenation levels in the human kidneys would be highly desirable. In conclusion, the preliminary results from this study support the ability of BOLD MRI to monitor acute changes in the regional hemodynamics within the kidney. The variable responses seen in the imaged subjects may reflect differences in salt-sensitive versus salt-insensitive individuals, which warrants conducting larger studies to confirm differences in renal BOLD response between the two groups.Acknowledgements
Funding from Daniel M. Soref Charitable Trust, MCW, USA.References
1. Pruijm et al. Nephrol Dial Transplant, 33: ii22-ii28.
2. Bane et al. MAGMA, 33:199-215.
3. Textor et al. Am J Kidney Dis, 59: 229-237.
Figures