2523
Effect of gravity on kidney function: evaluation using multiposture MRI1Division of Health Sciences, Kanazawa University, Kanazawa, Japan
Synopsis
We assessed the effect of gravity on regional kidney function in the supine and upright positions using an original MRI that can obtain functional information in any posture (multiposture MRI). We compared the mean blood flow, T2, and T2’, apparent diffusion coefficient of the kidney between the supine and upright positions. Gravity reduced the blood flow and T2 of the kidney, and these differences between postures potentially provide new diagnostic information.
INTRODUCTION
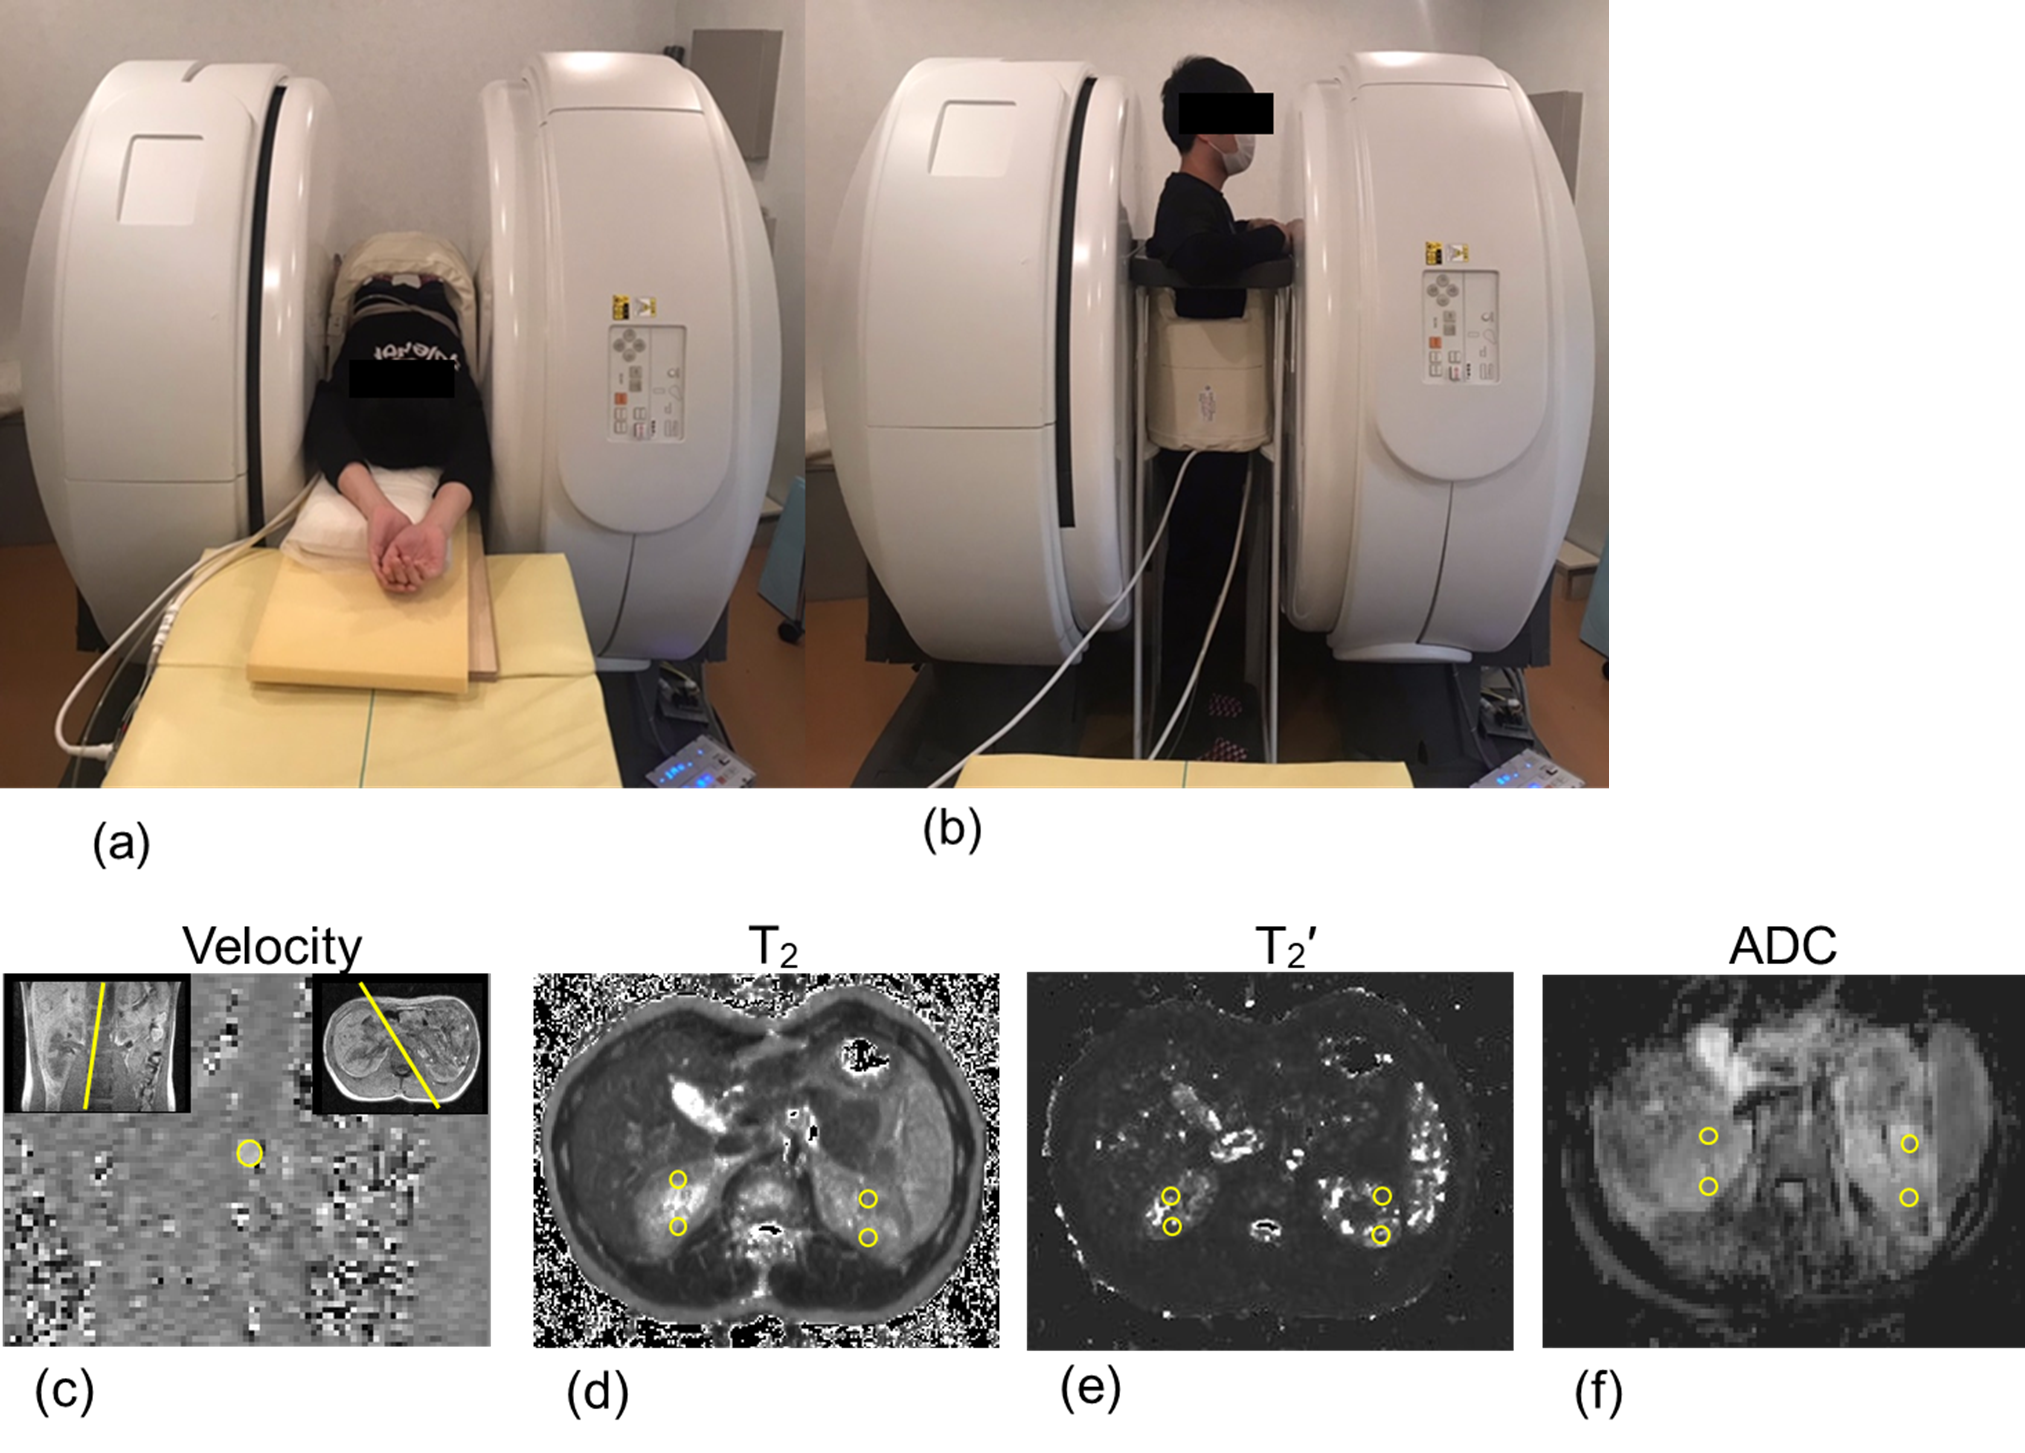
Understanding normal regulation of the kidney is important for improving the diagnosis and management of kidney disease.1 Nevertheless, it is unclear how regional kidney function is altered by postural changes, ie, differences in the effects of gravity. In this study, we evaluated the effect of gravity on regional kidney function in the supine and upright positions using an original magnetic resonance imaging (MRI) system that can obtain functional information in any posture (multiposture MRI).2MATERIALS AND METHODS
Regional kidney functions (the mean renal blood flow, T2, T2’, and apparent diffusion coefficient (ADC)) were evaluated in seven healthy volunteers (mean age, 22.9 ± 0.9 years) in the supine and upright positions using multiposture MRI (0.4 T) (Fig. 1). The mean renal blood flow, T2, T2*, and ADC of the kidney were obtained with the ECG-triggered cine phase-contrast, single-shot diffusion echo-planar imaging, fast multiple spin-echo, and multiple gradient-echo techniques, respectively. T2’ was calculated from the T2 and T2*. Then, those functional values in each region of the kidney were compared between postures.RESULTS AND DISCUSSION
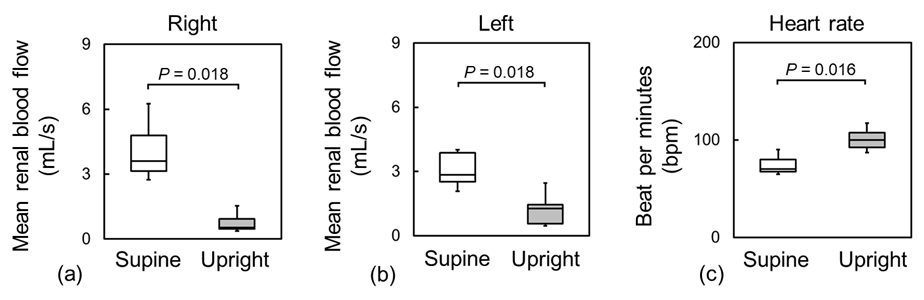
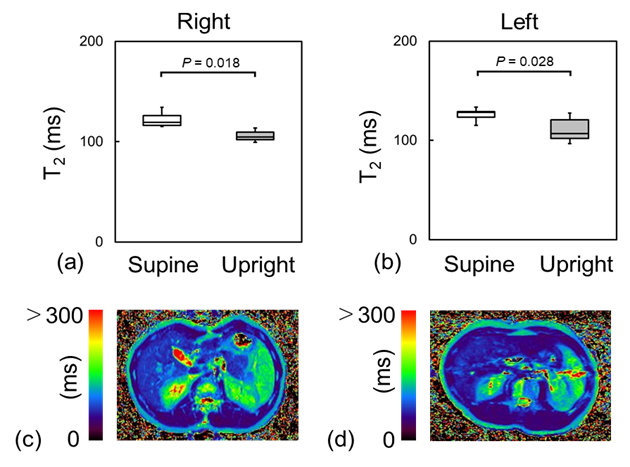
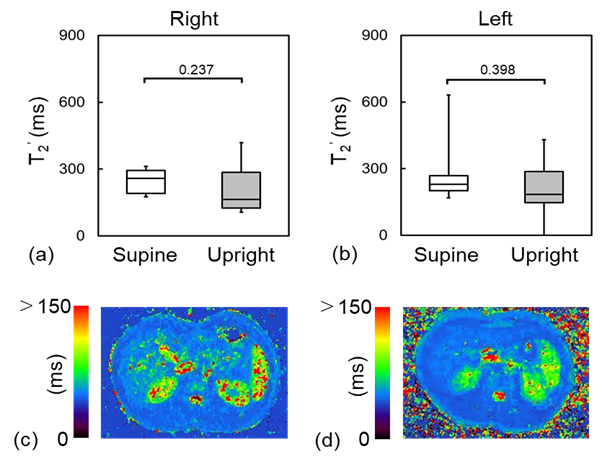
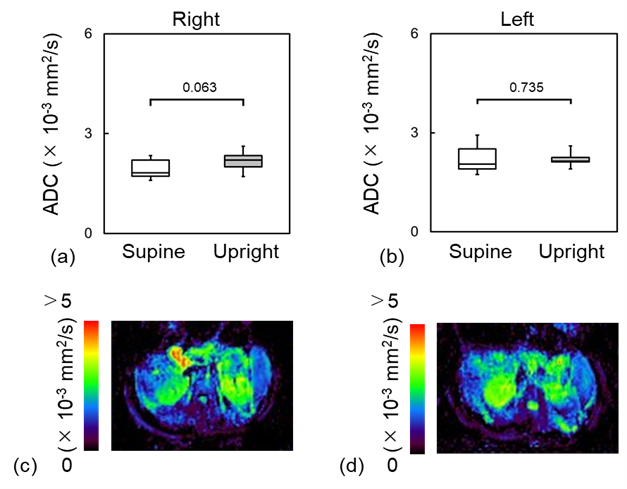
The mean renal blood flow in the upright position (right kidney, 0.81 ± 0.65 mL/s; left kidney, 1.36 ± 1.16 mL/s) was significantly lower than that in the supine position (right, 4.14 ± 1.67 mL/s; left, 3.02 ± 0.96 mL/s) (P < 0.05) (Figs. 2a and b), despite an increase in the heart rate due to the autoregulation to the fluid shift effect as the body was positioned upright (Fig. 2c).3 The T2 for all regions in the upright position (right, 114 ± 11.3 ms; left, 106 ± 6.22 ms) were significantly lower than that in the supine position (right, 124 ± 11 ms; left, 122 ± 8.86 ms) (P < 0.05) (Fig. 3), which indicates decrease in blood and urine volume in the kidney during the upright position.4 These results potentially provide new diagnostic information on the regulatory functions to the gravity as compared with the standard MRI examination of the kidney. However, no significant difference was observed in the T2’ and ADC for all regions between the supine and upright positions (Figs. 4 and 5).CONCLUSION
Gravity reduces the blood flow and T2 of the kidney. Multiposture MRI makes it possible to evaluate the effect of gravity on regional kidney function.Acknowledgements
No acknowledgement found.References
1. Stevens LA, et al., Assessing kidney function—measured and estimated glomerular filtration rate. N Engl J Med. 2006; 354: 2473-2483.
2. Kadoya Y et al., Effect of gravity on portal venous flow: Evaluation using multiposture MRI. J Magn Reson Imaging. 2019; 50: 83-87.
3. Kadoya Y et al., Evaluation of gravity effect on inferior vena cava and abdominal aortic flow using multi-posture MRI. Acta Radiol. 2020;16: 284185120950112.
4.Rosenbaum JD, et al., The influence of cortisone upon the diurnal rhythm of renal excretory function. J Clin Invest. 1952; 14927741.
Figures