2522
Improved Accuracy of Ratiometric CEST pH Mapping using Two Iodinated Agents with Nonequivalent Amide Protons and a Single Low Saturation1School of Biomedical Engineering, Southern Medical University, Guangzhou, China, 2Philips healthcare, Guangzhou, China
Synopsis
Various Iodinated agents were supposed to be pH sensors in kidney or tumor based on chemical exchange saturation transfer (CEST) mechanism. We compared different contrast agents (CAs) and their combination, established a ratiometric CEST pH imaging method to improve the accuracy of pH measurement in vivo, by combined the molar concentration ratio of two nonequivalent amide protons resonated at 4.3 ppm and 5.6 ppm.
Introduction
Chemical exchange saturation transfer (CEST) MRI has emerged as one of the promising noninvasive techniques for pH quantification. Clinically approved iodinated X-ray agents have been studied as diaCEST agents for pH imaging[1,2], like Iopamidol and etc. possess two nonequivalent amide protons, resonated at 4.3 ppm and 5.5 ppm from water proton respectively[3]. In this study, five clinically approved iodinated agents and/or their combinations were thoroughly investigated to construct two nonequivalent amide protons for pH imaging in vitro and vivo.Method
In Vitro Phantom Studies: Various iodinated agents were prepared to dissolved in phosphate buffer solution (PBS) and pH titrated to 5.6, 6.0, 6.4, 6.8, 7.2, 7.6, the total amide proton concentration is held constant at 120 mM with mixed molar ratio between two amide protons were 2:1, 1:1 and 1:2. All MRI studies were conducted on a 7 T animal MRI scanner (Bruker Biospec, Billerica, MA). Rapid acquisition with relaxation enhancement (RARE) with resolution of 0.3 mm2, rare factor=8, slice thickness=5 mm been used. Z spectrum acquired under 1, 1.5, 2, 2.5 μT saturation power, repetition time (TR)/saturation time (TS)/echo time (TE)=10000/5000/40 ms.In Vivo MRI Studies: Animal studies have been approved by our Institutional Animal Care and Use Committee. SD rats (n=5, 250±20 g) were scanned for the left kidneys under anesthesia induced by 3%~5% isoflurane. Body temperature was maintained at 37 ℃ using a heating pad. A 30G needle is inserted into the caudal vein to facilitate injection of medication. During MRI scaning, a mixture of iodixanol and iobitridol (3.375g I/kg body weight) was injected into tail vein via a syringe pump. The first half dose was infused at rate of 0.4 ml/min in the beginning, and the rest was injected at 0.03 ml/min. Scout and T2-weighted images were collected by a RARE sequence. CEST images scanned with resolution of 0.5 mm2, RARE factor=36, slice thickness=3 mm, and a Z-spectrum acquired under 1.5 μT saturation power, TR/ TS/ TE=6000/3000/40 ms. The total scan time for the Z-spectrum was 11 min. The B0 was corrected by WASSR method.
Data Analysis: All data were processed by multi-pool Lorentzian fitting,
$$$Z(w)=\sum_{i=1}^{5}L_{i}(w)$$$
where ,$$$M_{z}$$$, $$$M_{0}$$$is the magnetic resonance signal with and without saturation, $$$L_{i}$$$is Lorentzian spectrum of the i pool, and the w is the saturation frequency. The five pools include magnetization transfer (MT), direct water saturation (DS), nuclear overhauser effect (NOE), and the two amide proton.The generalized ratiometric be described by the ratio of two CEST signal located at 4.3 ppm and 5.5 ppm,
$$$Ratio=\frac{ST_{4.3 ppm}}{ST_{5.6 ppm}}$$$
A log10 ratio of CEST effects from two amide protons was calculated, a linear calibration of CEST versus pH also acquired.
CT Experiments: The imaging protocol was performed on a micro-CT scanner ( HITACHI-ALOKA, Japan). The injection protocol were same as in MRI studies. CT images were acquired with the following parameters: 1024 projection, 50 kV, 10 seconds exposuretime, FOV 81.5 mm. Reconstructed CT images were analyzed by MATLAB.
Results
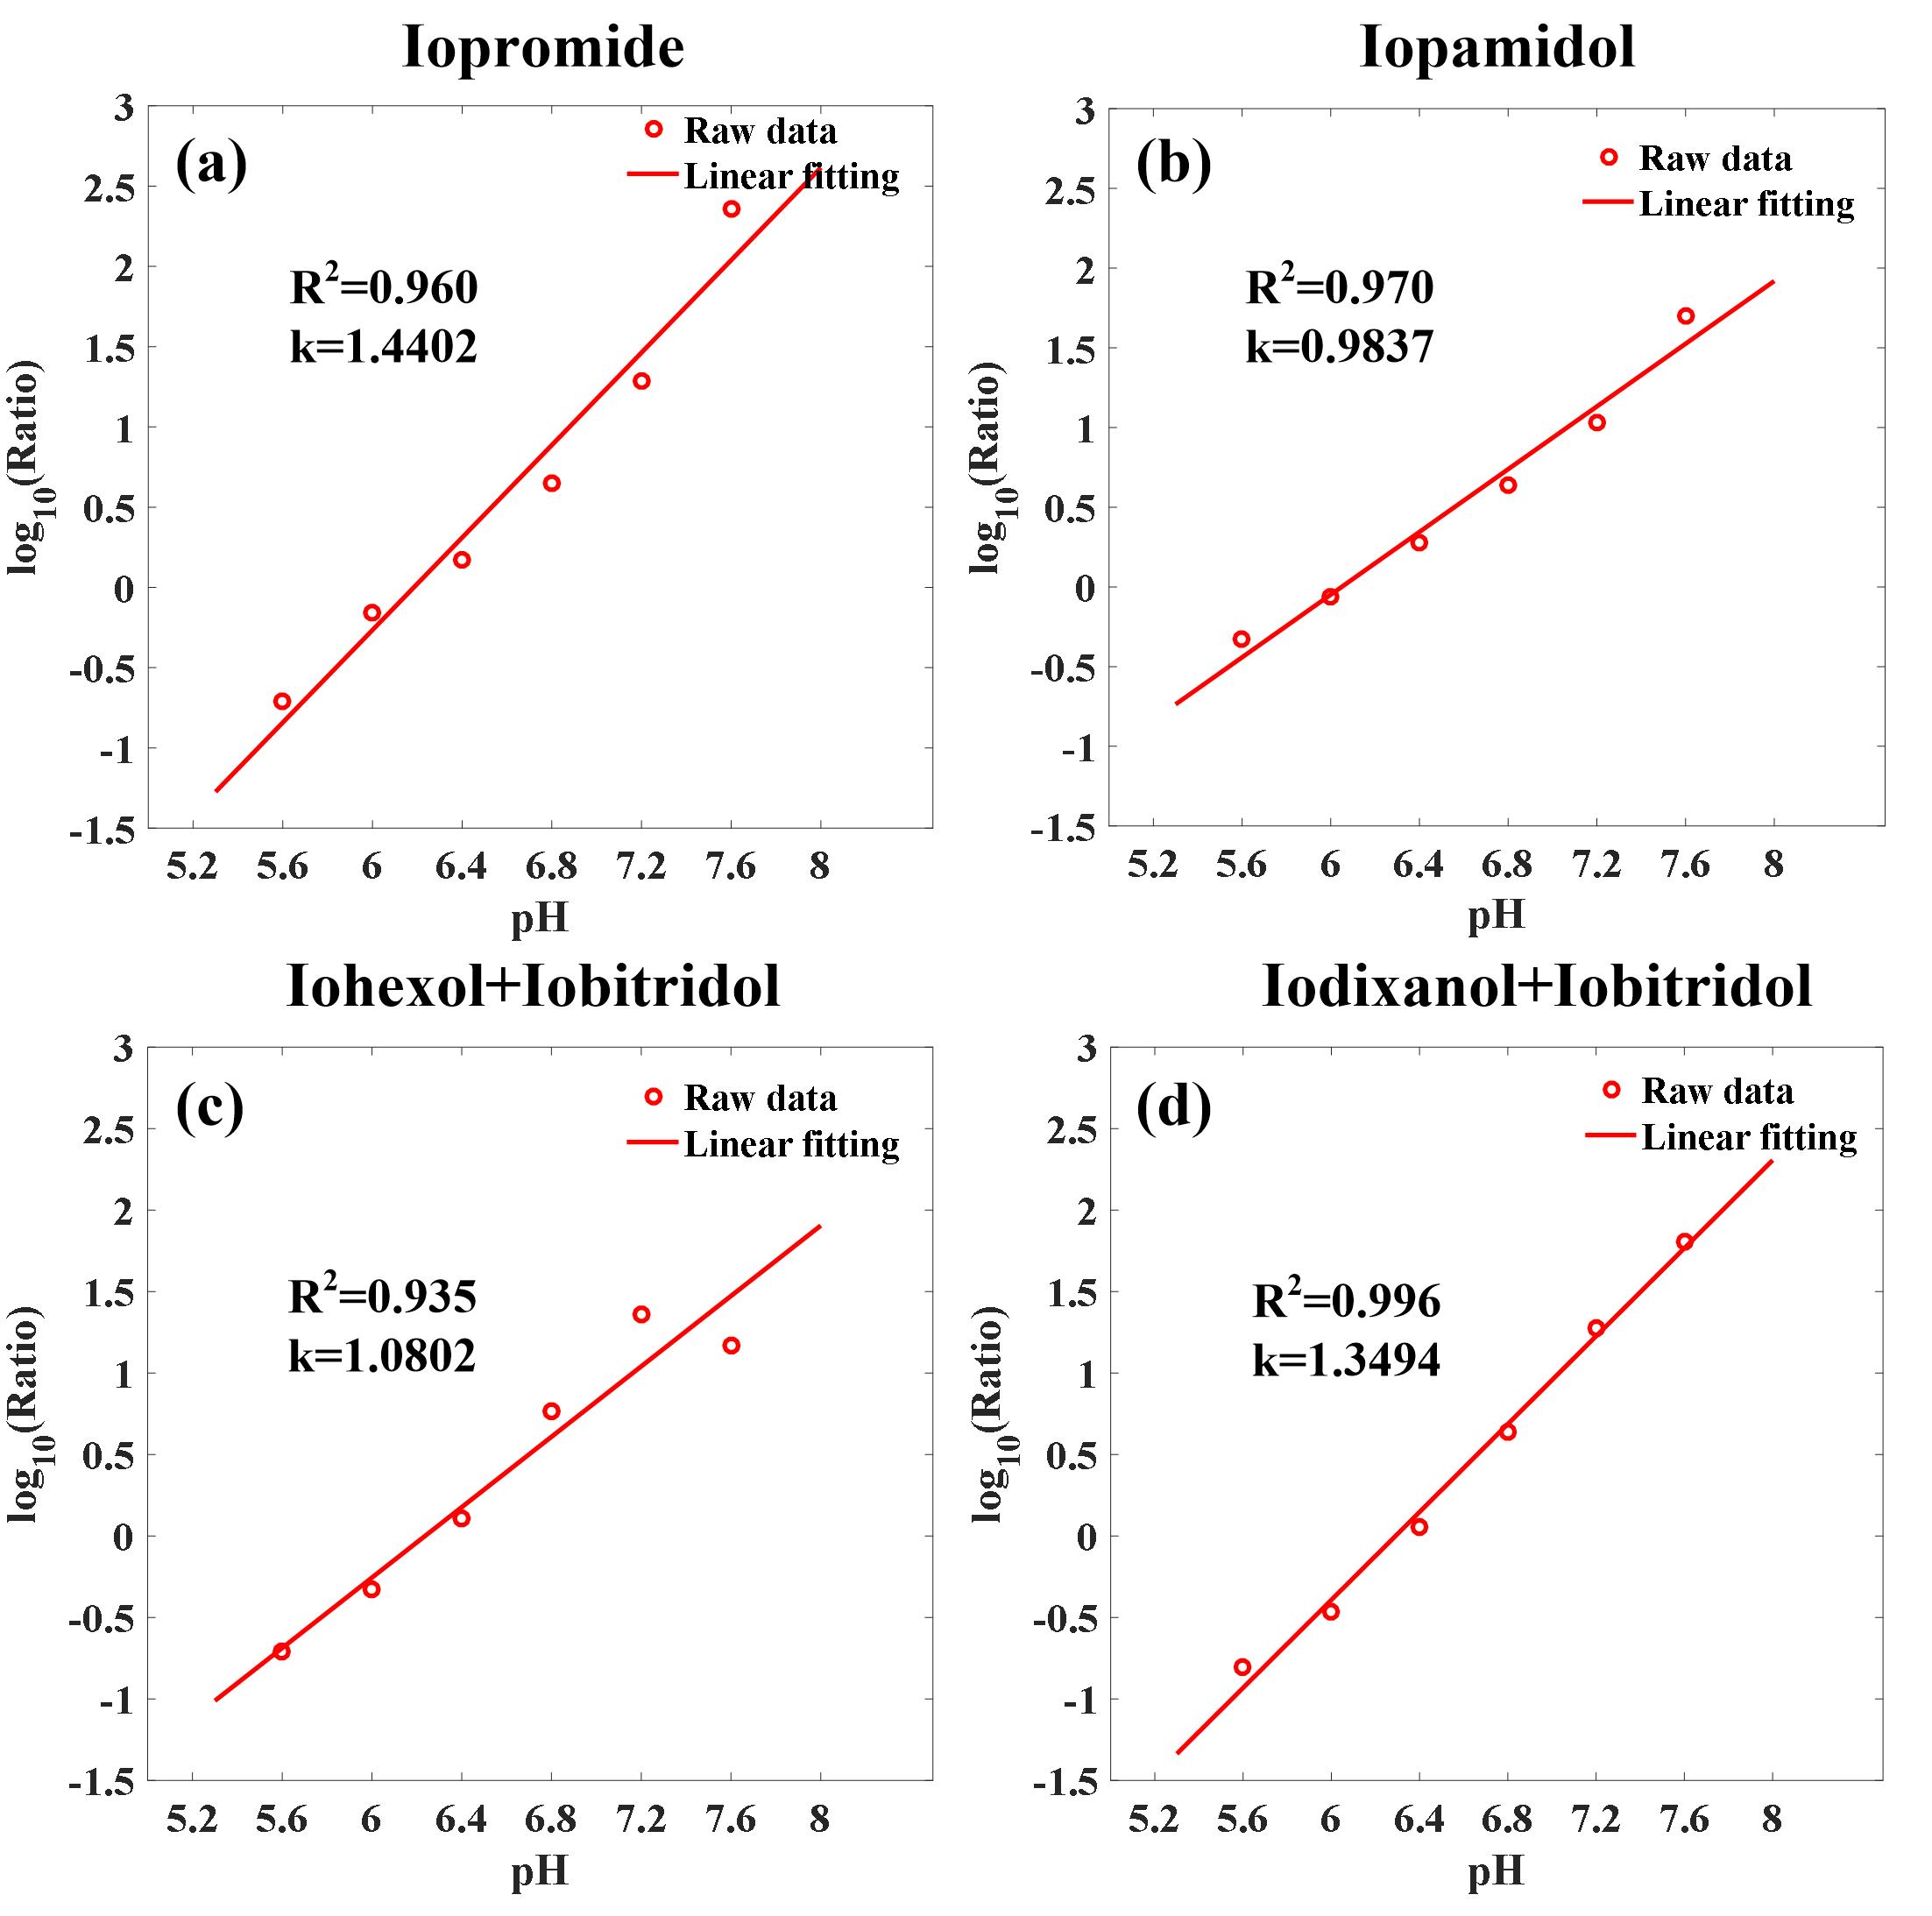
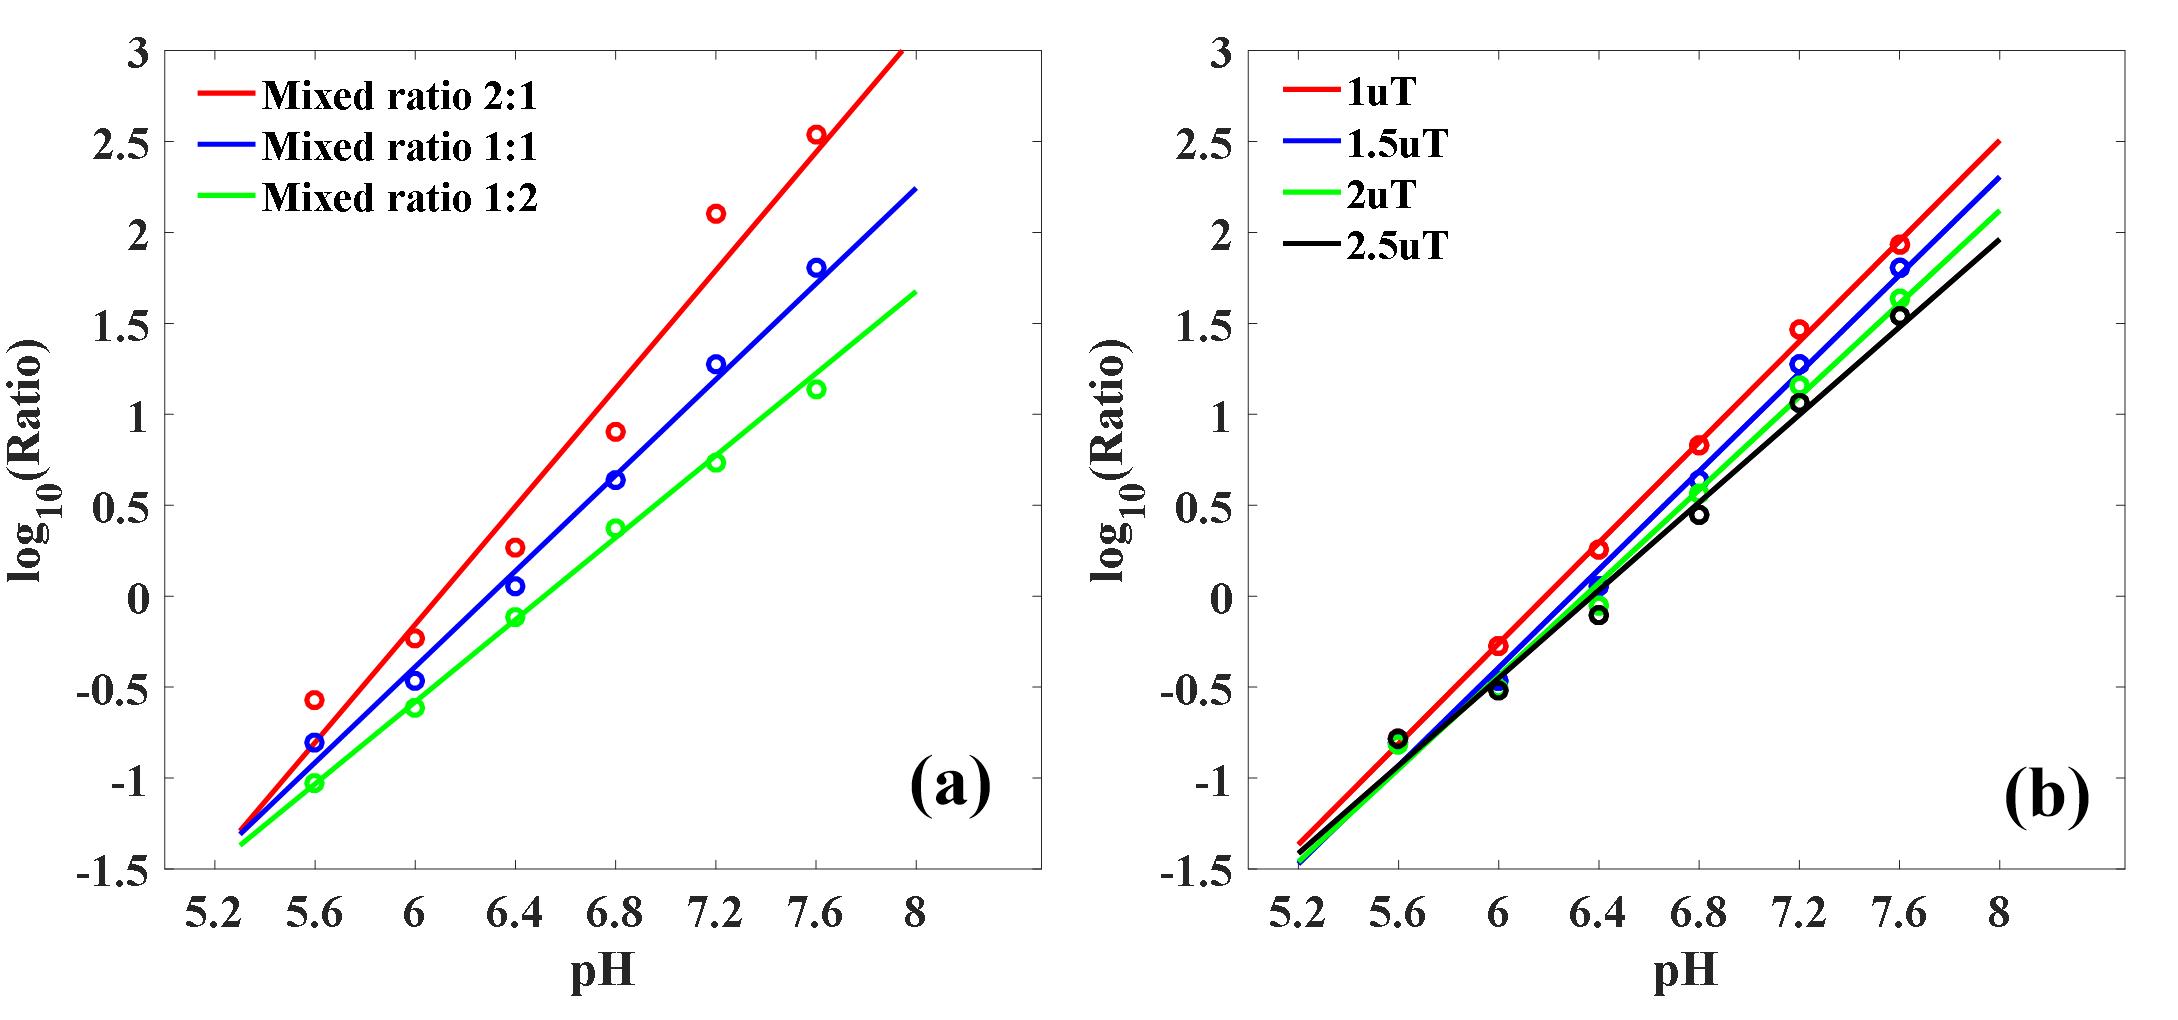
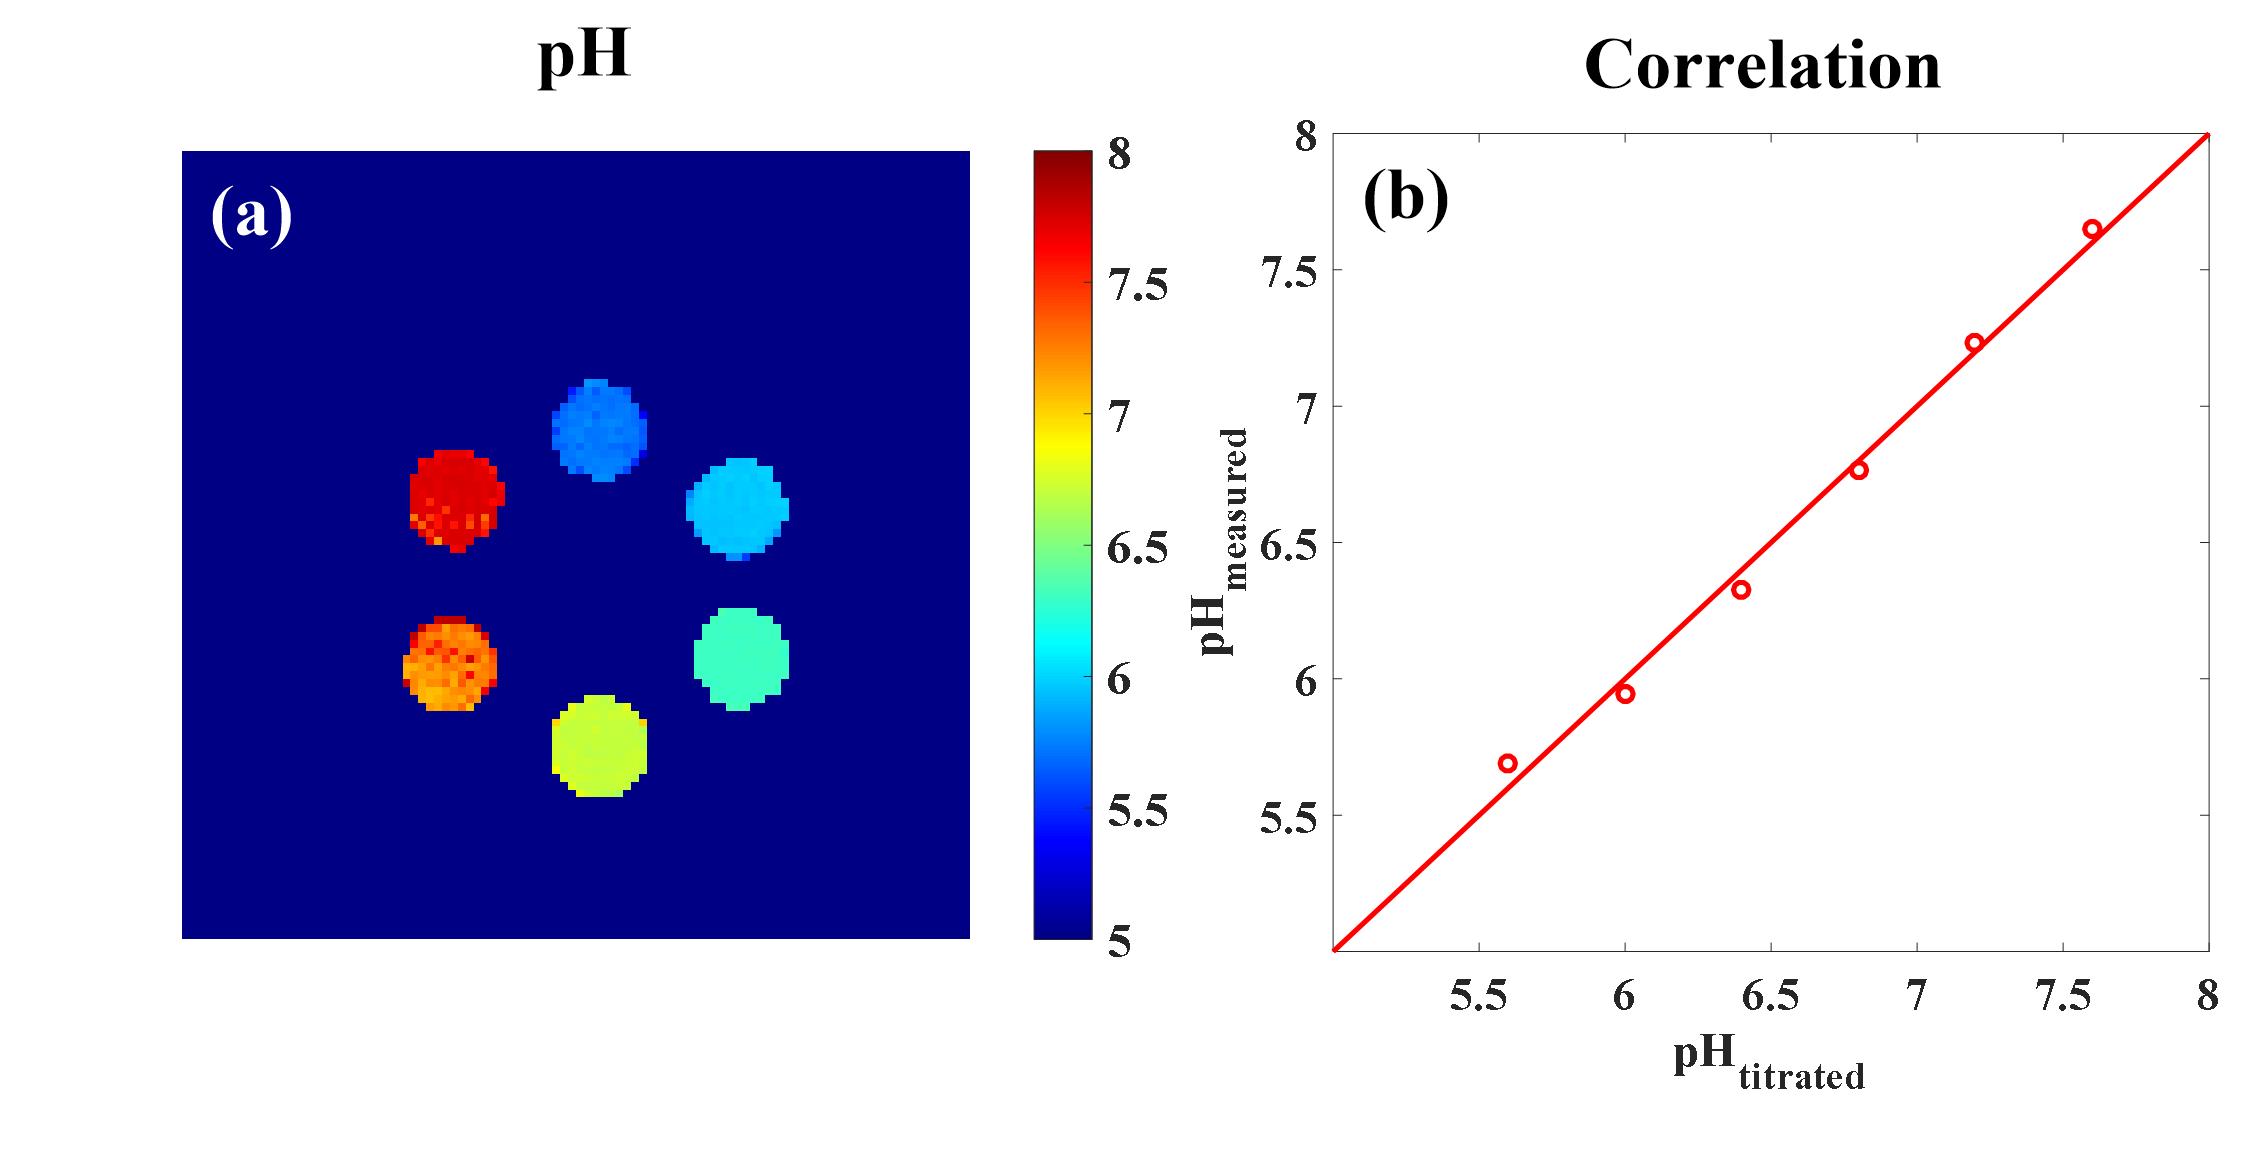
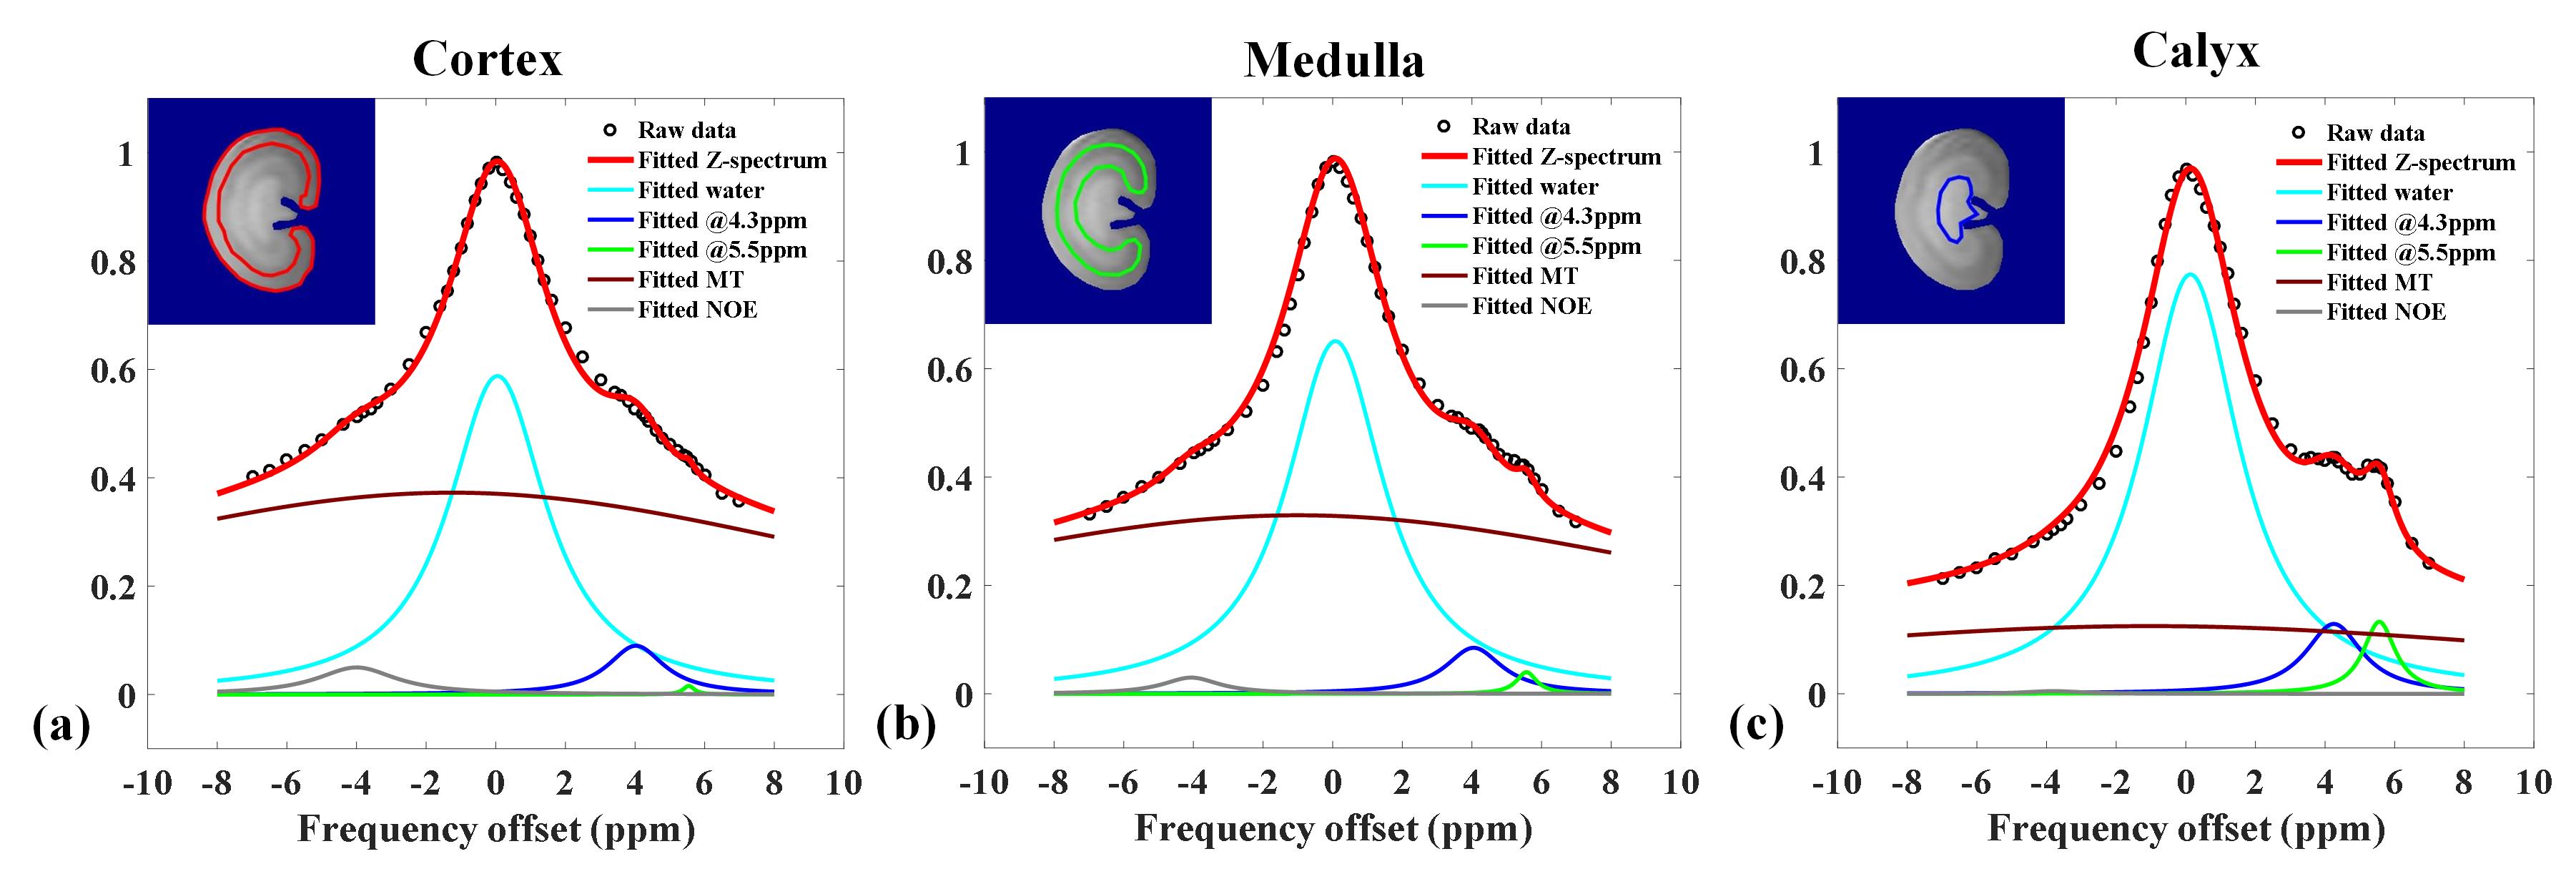
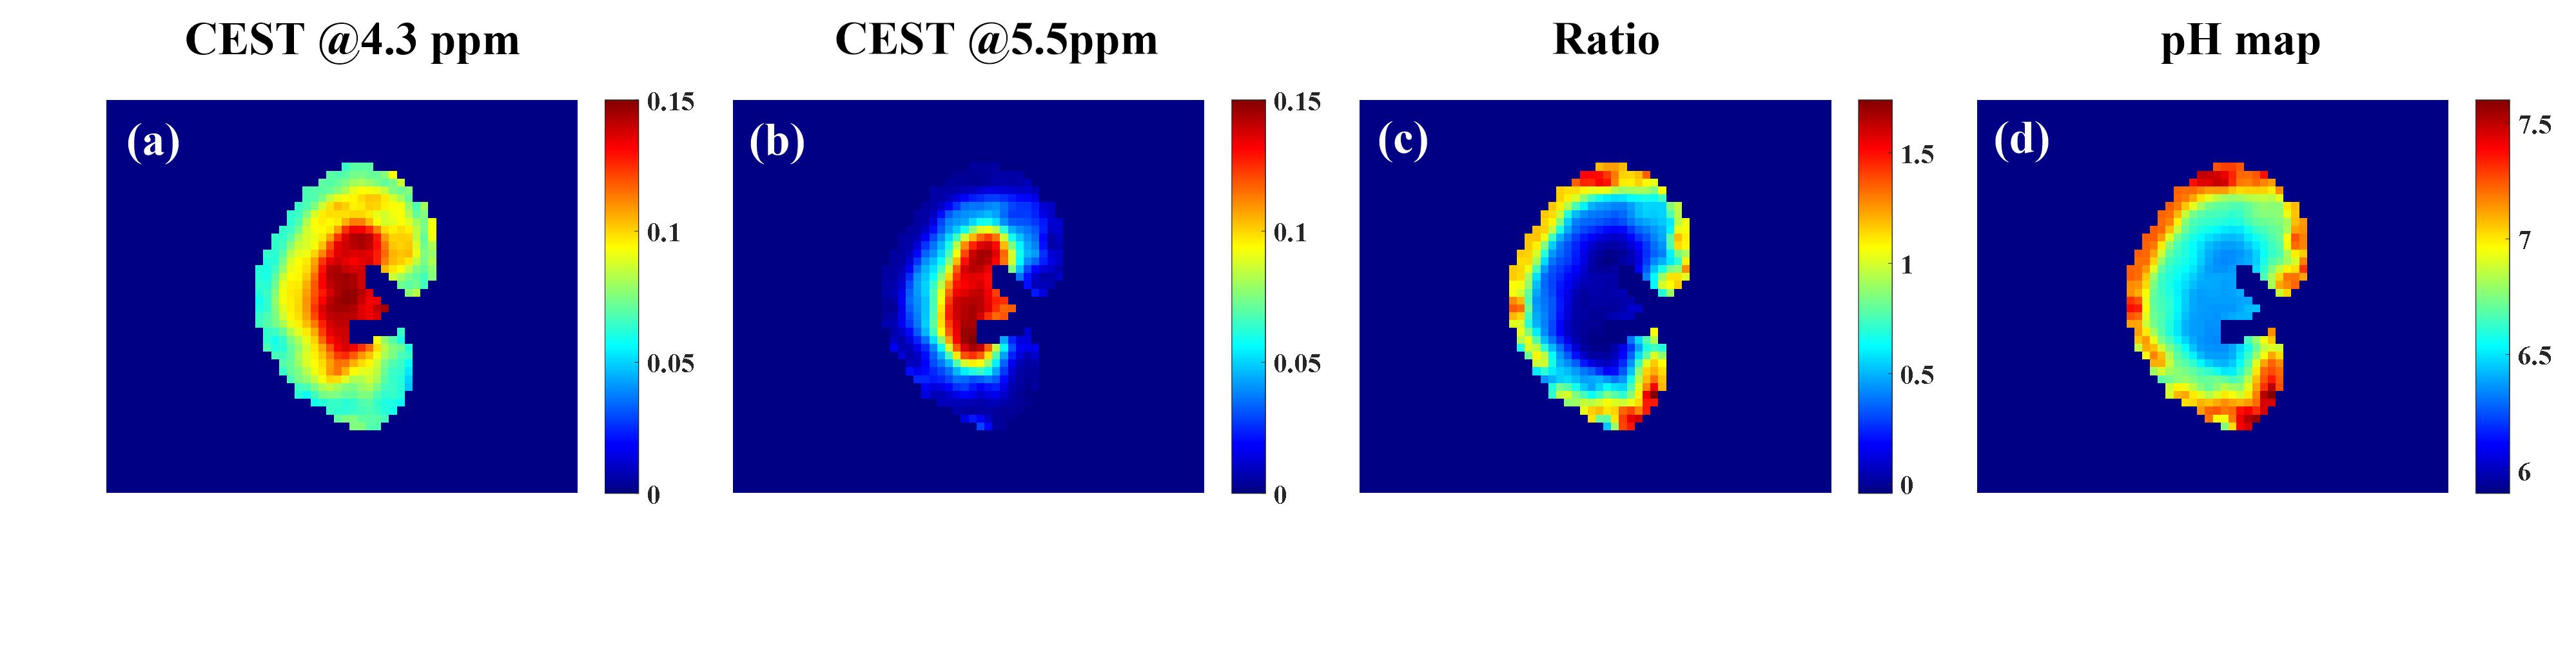
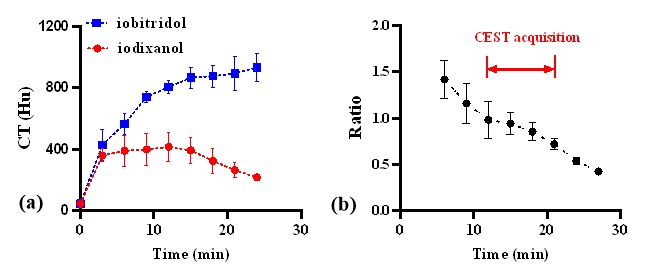
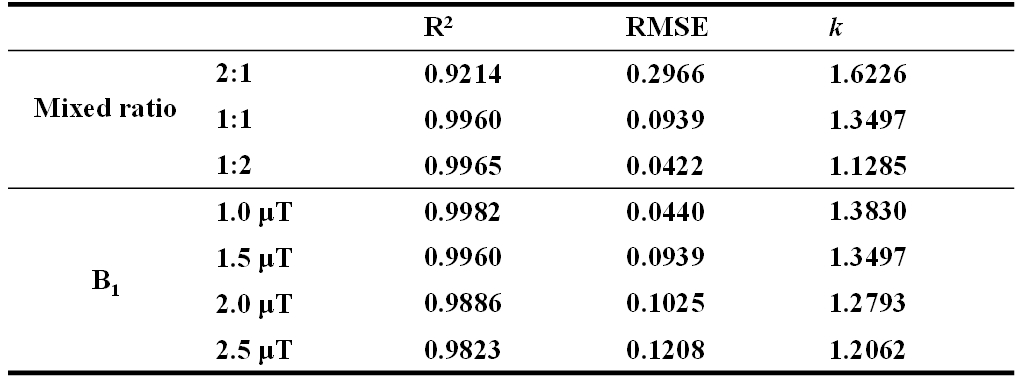
A log10 ratio based on two CEST signals at 4.3 ppm and 5.5 ppm (dubbed hereafter as “CEST ratio”) from different iodinated agents and their combination were calculated and linearly correlated with measured pH in Figure 1. It was no doubt that the ratio signal of iodixanol and iobitridol mixture acquired better linearity (R2=0.996, k=1.3494) with pH. Moreover, using this mixture, we varied the ratio of two amide protons and saturation power in Figure 2, and shown the quantization parameter in table 1, 1:1 ratio and 1.5 μT were supposed to more suitable apply in vivo than another parameters. Figure 3 also show the pH consistency between measurement and titration by using the combination of iodixanol and iobitridol, when the ratio is 1:1 and under 1.5 μT saturation power. Typical inverted Z-spectra of cortex, medulla and calyx of one kidney was showed in Figure 4. Small peaks around 4.3 ppm and 5.5 ppm could be observed clearly in both Z-spectra of calyx and medulla. All layers of kidney were showed with good fitting. The resolved CEST signals at two resonance frequency were showed in Figure 5a and 5b. We can observe that the amplitude of these two CEST signals increase from cortex to calyx. The ratio image and the corresponding pH map were presented in Figure 5c and 5d respectively. The pH values of cortex, medulla and calyx was measured to be 7.24±0.28, 6.75±0.20, and 6.45±0.05 respectively, which was significantly different from each other (n=5, *p<0.05). To make sure the ratio of these two CAs in kidney, CT image were acquired. From the figure 6(b), during the 10 ~ 20 minutes, the ratio of those two CAs was stabilize at 1:1, which located at the time of CEST imaging.Discussion and Conclusion
In this study, we compared five clinically approved iodinated agents and their combination for CEST pH mapping. The combination of iobitridol and iodixanol with the mixed ratio of 1:1 was found to be the suitable for pH mapping. Improved accuracy and extended pH detection range have been achieved under a single reduced B1 of 1.5 μΤ, which enable the reliable pH mapping of kidney in vivo.Acknowledgements
No acknowledgement found.References
1. Moon B F, Jones K M, Chen L Q, et al. A comparison of iopromide and iopamidol, two acidoCEST MRI contrast media that measure tumor extracellular pH.[J]. Contrast Media & Molecular Imaging, 2015, 10(6): 446-455.
2. Chen Z, Li Y, Airan R, et al. CT and CEST MRI bimodal imaging of the intratumoral distribution of iodinated liposomes[J]. Quantitative imaging in medicine and surgery, 2019, 9(9): 1579.
3. Wu Y, Zhou I Y, Igarashi T, et al. A generalized ratiometric chemical exchange saturation transfer (CEST) MRI approach for mapping renal pH using iopamidol[J]. Magnetic Resonance in Medicine, 2018, 79(3): 1553-1558.
Figures