2521
Measurement of renal medullary perfusion using a 7-compartment model for MR Renography1University Medical Center Utrecht, Utrecht, Netherlands, 2University of Leeds, Leeds, United Kingdom, 3University of Sheffield, Sheffield, United Kingdom
Synopsis
Medullary perfusion potentially is an early marker of renal damage, but cannot be measured using existing models in MR renography. In this study a novel 7-compartment, 10-parameter model is proposed and evaluated in synthetic and patient data. Robustness of an iterative fitting approach was assessed by the coefficient of variation over multiple fits, resulting in median values <2.5% both in synthetic and patient data. According to simulations, medullary perfusion was underestimated by 5.3%, but in diabetic patients medullary perfusion was relatively high (81 mL/100mL/min). Future studies will be needed to determine this model’s sensitivity to pathophysiological changes in medullary perfusion.
Introduction
MR Renography traces contrast passage through the kidneys and uses subsequent modelling of the contrast enhancement curve to measure renal perfusion and filtration. Existing models however do not allow for measurement of medullary perfusion (Fmed).(1,2) Since the renal medulla functions on the border of hypoxia,(3) it is very sensitive to perfusion defects, rendering a promising marker of early stage renal damage.Theory
A 7-compartment model (7CM) of renal perfusion and filtration was constructed (Figure 1), reflecting renal physiology. The model involves 10 free parameters: for each compartment X a time constant TX , the filtration fraction EPT,PA, the extraction fraction to the vasa recta EVR,PA, and cortical perfusion Fcor. Glomerular filtration rate (GFR) is derived by $$$E_{PT,PA}F_{cor}$$$ and $$$F_{med}=E_{VR,PA}F_{cor}$$$. Cortical and medullary enhancement are modelled separately and mathematically described as:$$C_{cor}(t)=\left[T_{PA}+ R_{PV}(1-E_{PT,PA}-E_{VR,PA})+R_{PV}*H_{VR}E_{VR,PA}+R_{PT}E_{PT,PA}+R_{DT}*H_{LH}*H_{PT}E_{PT,PA}\right]...$$
$$...*H_{PA}* F_{cor}C_{A}(t)$$
$$C_{med}(t)=\left[R_{VR}E_{VR,PA}+R_{LH}*H_{PT}E_{PT,PA}+R_{CD}*H_{DT}*H_{LH}*H_{PT}E_{PT,PA}\right]*H_{PA}*F_{cor}C_{A}(t)$$
Here, $$$*$$$ denotes convolution and for each compartment X, $$$R_{X}=e^{-\frac{t}{T_{X}}}$$$ and $$$H_{X}=\frac{1}{T_{X}}e^{-\frac{t}{T_{X}}}$$$.
Methods
ImplementationThe model was implemented in Matlab (R2019, MathWorks, Natick, MA, USA). Medullary and cortical curves were fitted simultaneously using a nonlinear least squares fit. Each timepoint was weighted by the inverse of its magnitude (except baseline signal). The model fit was iterated 50 times with random initial values (within bounds). Median values were used as parameter estimations.
Simulations
Ten arterial input functions obtained from patient data were used to generate 20 different ground-truth renal enhancement curves using the 7CM. Ground truth parameter values were obtained from the normal distribution with a standard deviation of 20% around values obtained from explorative fits in patient data. Gaussian noise was added to obtain curves visually resembling patient data (CNR 150). To determine accuracy and precision, the iterated fit was repeated 60 times. Accuracy and precision were calculated for EPT,PA, Fcor, GFR and Fmed. Accuracy was defined as the average deviation of the ground truth parameters over 60 repetitions of the iterated fit. Precision was measured using the coefficient of variation (CoV, the standard deviation of those 60 iterations divided by the mean).
Patient data
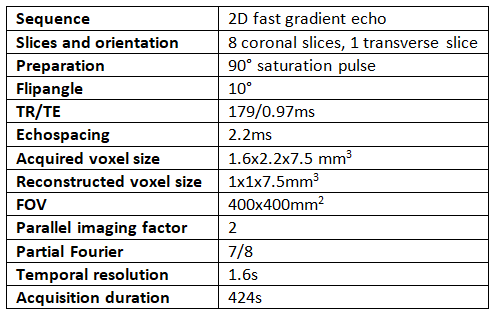
Patient data (type-2 diabetes, eGFR >30) was used from the iBEAt study.(4) Data was acquired on a 3T MR system (MAGNETOM Siemens, Erlangen, Germany), using a 2D fast gradient echo with a non-selective 90 degree saturation pulse prior to each slice readout. Scan parameters are provided in table 1. During DCE MRI, a quarter dose 0.05 mL/kg of Dotarem was infused at a rate of 2 mL/s followed by a 20mL saline flush. Deformable motion correction was performed using model-driven registration.(5) Enhancement curves were extracted after segmentation of renal cortex and medulla by k-means clustering.(6) Fitting stability was assessed by 20 iterated fits. Values for GFR, TPA and FPA,A were compared to values obtained using a two compartment model (2CM)(1) using linear regression and the ICC. Data are presented as median (interquartile range (IQR)).
Results
Of the 24 datasets available, 4 were excluded because of heavy variations of inflow effects in the arterial input function. A representative example of the MR images is shown in Figure 2. In Figure 3a and b, an example of the simulated time intensity curve and 7CM fit is shown alongside a measured time intensity curve in Figure 3c and d. As shown in Figure 4a, precision of estimation (CoV 1.7(1.2-2.4)%) was slightly less compared to the other parameters (FPT,PA, Fcor and GFR with an IQR <1%). Also, Fmed was underestimated by median 5.3(0.2-16)% (Figure 4b).In patient data, median values for EPT,PA, Fcor, Fmed and GFR were 0.28(0.25-0.34), 238(188-309)mL/100mL/min, 81(58-111)mL/100mL/min and 67(59-86)mL/100mL/min, respectively. Stability was excellent with a CoV of 0(0-0)% for all four parameters of interest (Figure 4c). However, in some curves the fit was less stable resulting in outliers with CoVs of max 13, 1.6, 50 and 13% for EPT,PA, Fcor, Fmed and GFR, respectively.
Correlation of GFR and Fcor to values obtained by a 2CM fit yielded systematically higher values of GFR and lower values of Fcor (Figure 4d and e). ICCs were 0.86 and 0.57 in GFR and Fcor, respectively.
Discussion
A 7CM capable of modelling Fmed was developed and tested both in synthetic and patient data. Although the model contains 10 free parameters, the fit was relatively stable both in synthetic and patient data. However, iterative fitting with varying initial values is recommended to avoid local minima. Based on simulations, Fmed could be estimated reasonably accurate with an underestimation of only 5.3%. Considering patient data however, Fmed was relatively high, around one third of Fcor, while Fcor was underestimated compared to a conventional 2CM fit. Partly, this might be explained by impaired cortical perfusion in diabetes, while medullary perfusion is preserved.(7) Additionally, the inability of the model to capture the first pass peak correctly might play a role. It might therefore be indicated to incorporate a delay before arrival of contrast agent in the cortex.In conclusion, the 7CM model enables measurement of Fmed using a MR renography experiment, which might be helpful in detecting early stage renal damage. In future studies the model’s sensitivity to pathological and physiological changes in medullary perfusion has to be determined.
Acknowledgements
The iBEAt study is part of the BEAt-DKD project. The BEAt-DKD project has received funding from the Innovative Medicines Initiative 2 Joint Undertaking under grant agreement No 115974. This Joint Undertaking receives support from the European Union’s Horizon 2020 research and innovation programme and EFPIA with JDRF. For a full list of BEAt-DKD partners, see www.beat-dkd.eu.
Anneloes de Boer was supported by stipends from the COST action PARENCHIMA (CA16103), "Stichting De Drie Lichten" and the "van Wijck-Stam-Caspers" foundation.
References
- Annet L, Hermoye L, Peeters F, Jamar F, Dehoux JP, Van Beers BE. Glomerular filtration rate: assessment with dynamic contrast-enhanced MRI and a cortical-compartment model in the rabbit kidney. J Magn Reson Imaging 2004;20:843-849.
- Lee VS, Rusinek H, Bokacheva L, et al. Renal function measurements from MR renography and a simplified multicompartmental model. Am J Physiol Renal Physiol 2007;292:F1548-1559.
- Heyman SN, Khamaisi M, Rosen S, Rosenberger C. Renal parenchymal hypoxia, hypoxia response and the progression of chronic kidney disease. Am J Nephrol 2008;28:998-1006.
- Gooding KM, Lienczewski C, Papale M, et al. Prognostic Imaging Biomarkers for Diabetic Kidney Disease (iBEAt): Study protocol. medRxiv 2020:2020.2001.2013.20017228.
- Buonaccorsi GA, O'Connor JP, Caunce A, et al. Tracer kinetic model-driven registration for dynamic contrast-enhanced MRI time-series data. Magn Reson Med 2007;58:1010-1019.
- Li S, Zollner FG, Merrem AD, et al. Wavelet-based segmentation of renal compartments in DCE-MRI of human kidney: initial results in patients and healthy volunteers. Comput Med Imaging Graph 2012;36:108-118.
- Kreft E, Sałaga-Zaleska K, Sakowicz-Burkiewicz M, Dąbkowski K, Szczepánska-Konkel M, Jankowski M. Diabetes Affects the A1 Adenosine Receptor-Dependent Action of Diadenosine Tetraphosphate (Ap4A) on Cortical and Medullary Renal Blood Flow. Journal of Vascular Research 2020.
Figures