2520
Repeatability of multi-parametric renal MRI biomarkers in healthy subjects: An iBEAt pilot study1Department of Imaging, Infection, Immunity and Cardiovascular Disease, University of Sheffield, Sheffield, United Kingdom, 2Department of Biomedical Imaging Sciences, University of Leeds, Leeds, United Kingdom, 3Leeds Teaching Hospitals, Leeds, United Kingdom, 4Siemens Healthcare GmbH, Erlangen, Germany
Synopsis
The iBEAt study MRI biomarker panel has been developed to determine if imaging biomarkers can improve predictions of renal function decline in diabetic kidney disease. The aim of this pilot study was to inform the approach to quality control and image processing of iBEAt data. Repeatability in 5 healthy volunteers (4 scans per subject) was analysed with a prototype image-processing pipeline. The results indicated that repeatability of renal T1, T2* and phase-contrast renal blood flow was comparable to literature, and measurement precision was sufficient to detect differences between volunteers. ASL had poor repeatability presumably from B0 inhomogeneities in labelling plane.
Introduction
Multi-parametric renal MRI allows characterisation of renal tissue structure and function, facilitating non-invasive interpretation of pathophysiological changes in the kidney. The iBEAt study MRI biomarker panel has been developed to determine if imaging biomarkers can improve predictions of renal function decline in diabetic kidney disease1 (DKD). The aim of this pilot study was to inform the approach to quality control and image processing of iBEAt data. Repeatability data in healthy volunteers were analysed with a prototype image processing pipeline, and results were compared to literature values.Methods
Data acquisition: Five healthy volunteers (HV: 4F/1M; median age: 39 yrs) were each scanned 4 times on MAGNETOM Prisma 3T MRI (Siemens Healthcare GmbH, Erlangen, Germany) using the iBEAt MRI protocol1. HVs arrived fasted (>8hrs) and were provided with standardised meal & fluid prior to the MRI scan (same hour/weekday per HV). MRI acquisition included IR-prepared T1-MOLLI, Multi-echo T2*, 2D-cine PC-MRI, and 3D-ASL (pCASL, prototype sequence*). The MRI acquisition parameters are available in Gooding et al. (supplementary material)1.*Work-In-Progress package, the product is currently under development and is not for sale in the US and in other countries. Its future availability cannot be ensured.
Data post-processing:
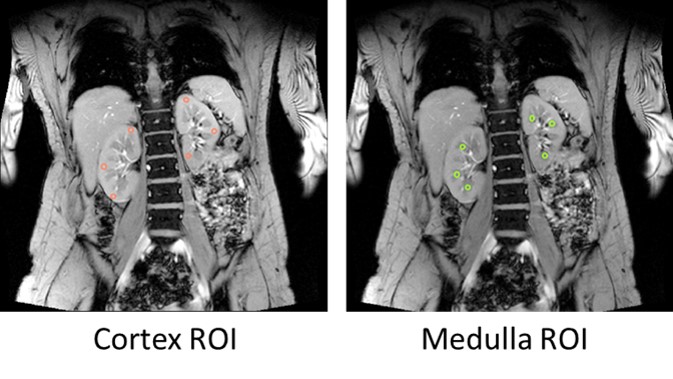
Relaxation times. Kidney cortex and medulla ROIs were selected on the middle slice of kidneys for each sequence with six circular regions (3 per kidney; Figure 1) using ImageJ2. Cortex and medulla ROI masks were imported in MATLAB3 for pixel-wise nonlinear curve fitting with Levenberg‐Marquardt algorithm using the standard MOLLI4 model for T1 and a mono-exponential decay for T2*.
Renal perfusion. PC-MRI was analysed on syngo.via (Siemens Healthcare GmbH, Erlangen, Germany) with an oval-shape ROI, threshold adjusted to segment the renal artery. RBF was averaged over the cardiac cycle and normalised to body-surface-area (DuBois formula). ASL perfusion maps were generated inline on the scanner and average parenchymal perfusion was extraction by semi-automatic segmentation on the perfusion map.
Summary parameters: For each parameter and for every volunteer, a repeatability error (RE) and relative repeatability error (RRE) were calculated as RE = 1.96 x SD and RRE = 1.96 x SD/AVR, where SD is the standard deviation over 4 measurements and AVR is the average. With this definition, RE and RRE measure the absolute and relative 95% confidence interval (CI) for a measurement in an individual. RE and RRE were averaged over all volunteers and the 95% CI on the average was determined as 1.96 x standard error. Boxplots and pairwise t-tests were computed in R (v.4.0.3)5.
Results
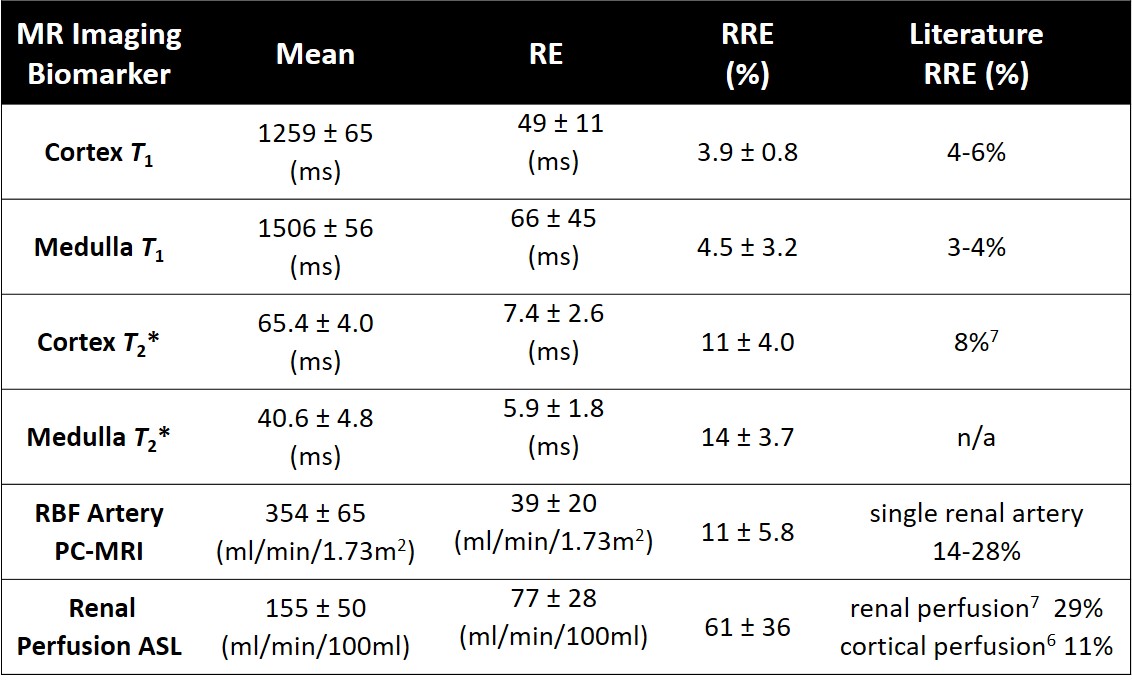
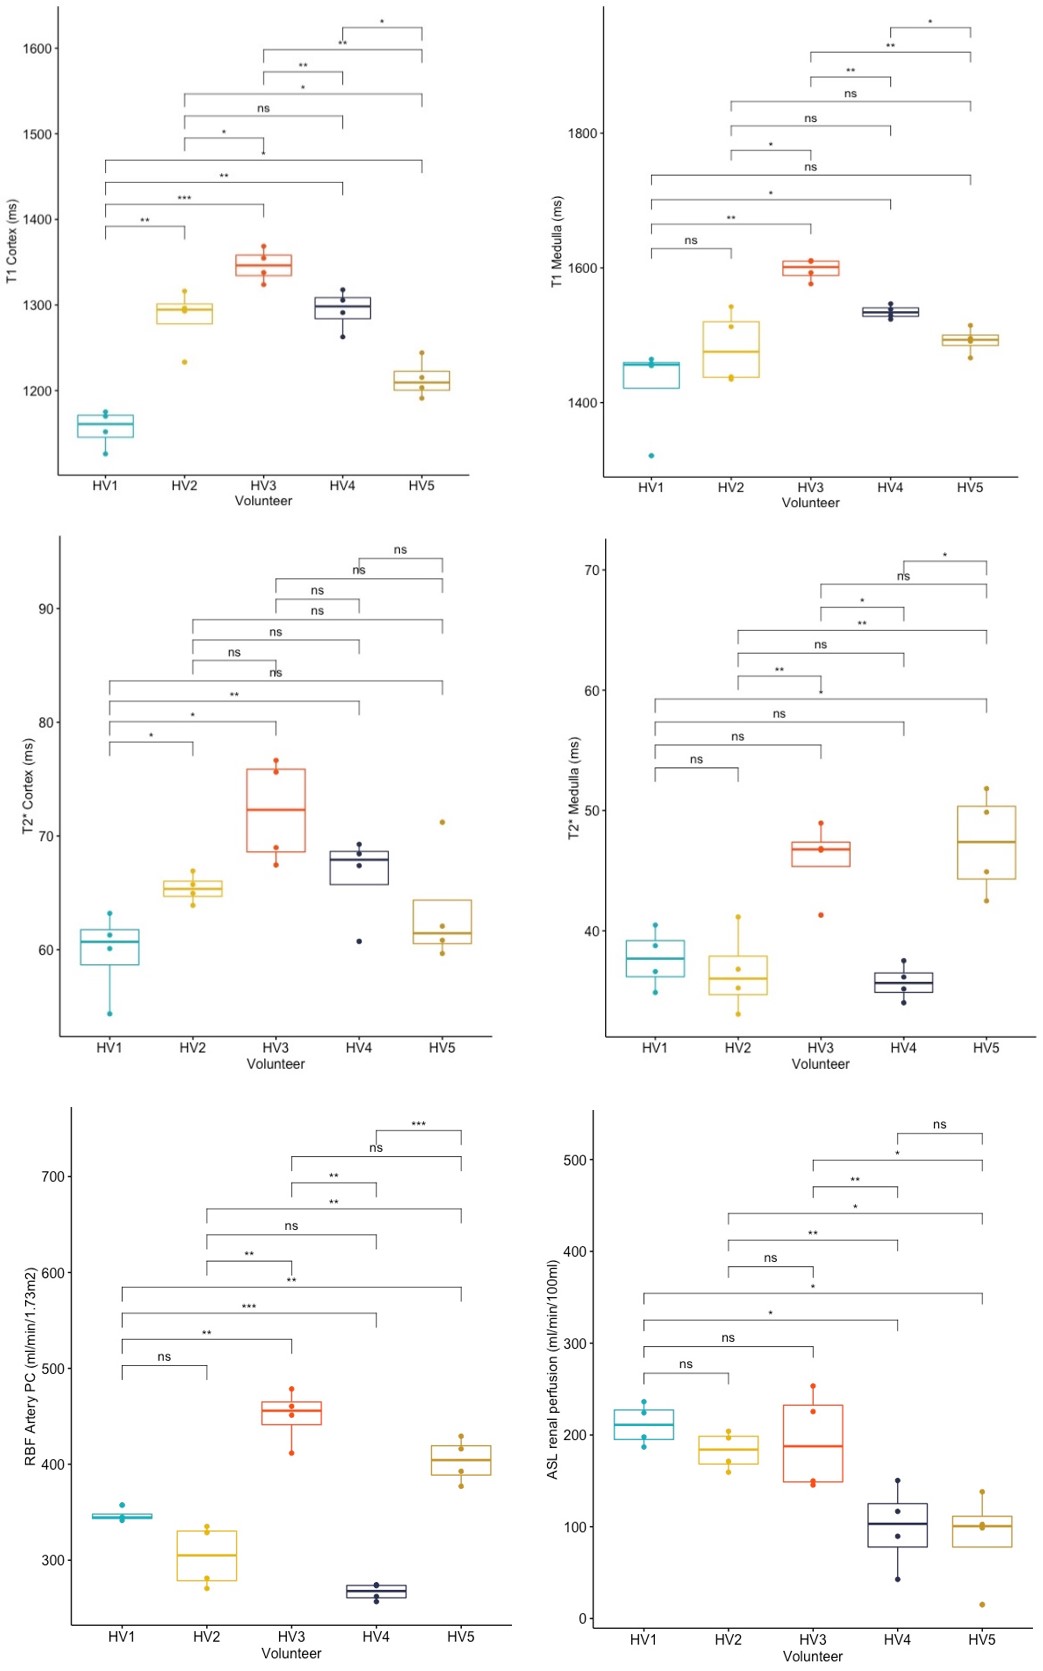
Table 1 shows the main results. RRE was lowest for T1 (<5%), followed by T2* (11-14%), PC-RBF (11%), and renal perfusion using ASL (61%).Figure 3 compares all parameters between individual subjects. Between-subject variability was evident with statistically significant differences among subjects in T1, PC-MRI, and ASL.
Discussion
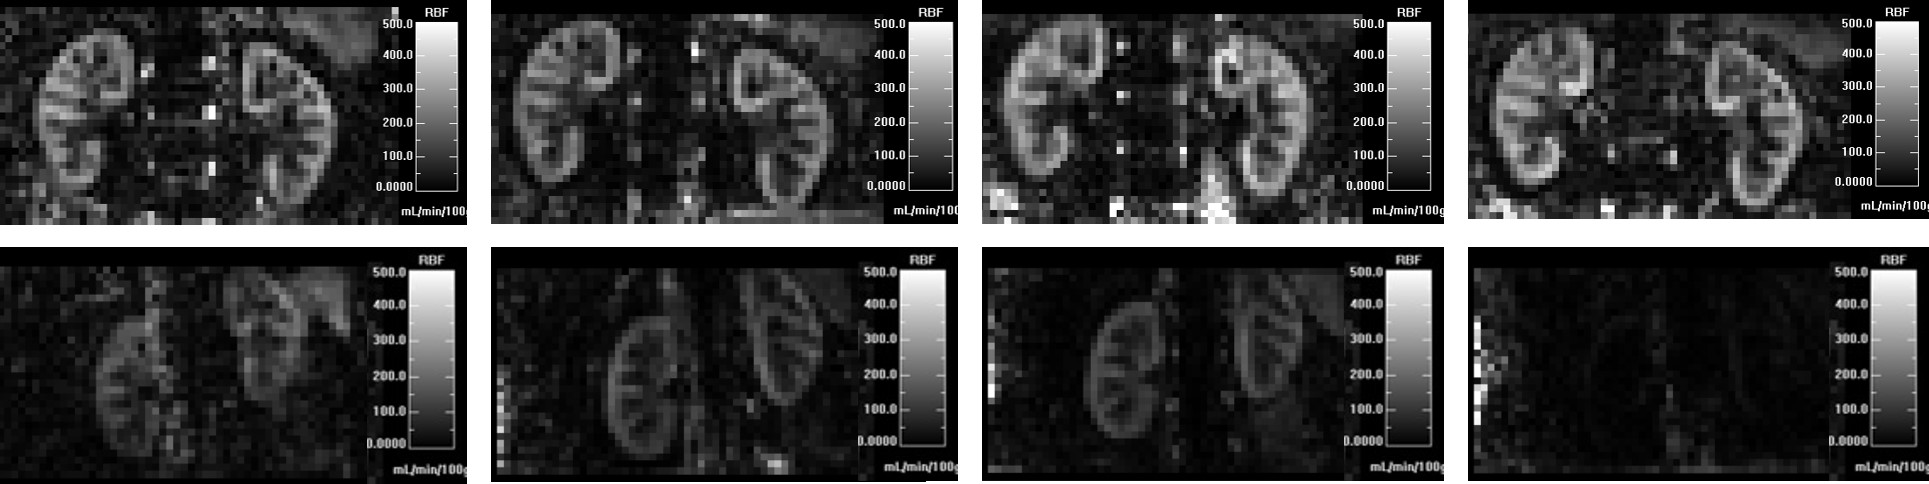
After correction for different definitions of the metrics, the repeatability of relaxation times and arterial RBF (PC-MRI) were comparable with literature6,7, but ASL was significantly worse (Table 1).The ASL RBF maps showed large signal dropout in individual cases (Figure 2), consistent with the effect of B0 inhomogeneity in the labelling plane. This artifact was largely reproducible within a subject and the main contributor to the observed differences between subjects. In the current acquisition protocol, the shim volume did not include the labelling plane, an area sensitive to B0 effects. For future studies, the acquisition protocol will incorporate volume shim across the labelling plane.
Inspection of T1 outliers (eg. HV1 scan 4) showed that kidney motion can result in T1 errors (Figure 3). The final processing protocol will mitigate this effect by including motion-correction in breath hold scans and extend the ROIs to whole medulla/cortex ROIs to further reduce motion sensitivity. Comparison of T1-MOLLI model fit to the data also revealed a smaller mismatch, potentially because the T1-MOLLI model does not account for differently spaced inversion times. Future analyses will use a more general signal model to correct for this effect.
A unique feature of this pilot study is the use of 4 rather than 2 repeat scans to measure repeatability errors, providing relatively accurate assessment of the measurement uncertainty at a single site. The data indicated that subtle differences in T1, T2* and phase-contrast RBF between HVs may reflect actual physiological differences instead of measurement uncertainty. Future studies are needed to better understand these differences and their relationship to factors including gender, age, obesity, or ethnicity.
Conclusion
The data show good repeatability of the iBEAt protocol for T1, T2*, and phase contrast with potential improvement in relaxation times by refining the processing protocol. ASL repeatability was poor but expected to improve significantly after minor adjustments in the acquisition. Data suggest that these markers are sufficiently sensitive to capture subtle structural differences in healthy renal tissue.Acknowledgements
iBEAt study is part of the BEAt-DKD project. The BEAt-DKD project has received funding from the Innovative Medicines Initiative 2 Joint Undertaking under grant agreement No 115974. This Joint Undertaking receives support from the European Union’s Horizon 2020 research and innovation programme and EFPIA with JDRF. For a full list of BEAt-DKD partners, see www.beat-dkd.eu.
B. Alhummiany is supported by a government scholarship from Saudi Arabia.
References
- Gooding KM, et al. Prognostic Imaging Biomarkers for Diabetic Kidney Disease (iBEAt): Study protocol, BMC Nephrol. 2020 Jun; 21(242).
- Schneider, C. A.; Rasband, W. S. & Eliceiri, K. W. (2012), "NIH Image to ImageJ: 25 years of image analysis", Nature methods 9(7): 671-675, PMID 22930834 (on Google Scholar).
- MATLAB 2018a, The MathWorks, Inc., Natick, Massachusetts, United States.
- Messroghli DR, Radjenovic A, Kozerke S, Higgins DM, Sivananthan MU, Ridgway JP. Modified Look-Locker inversion recovery (MOLLI) for high-resolution T1 mapping of the heart. Magn Reson Med. 2004;52(1):141-146.
- R Core Team (2013). R: A language and environment for statistical computing. R Foundation for Statistical Computing, Vienna, Austria.URL www.R-project.org/.
- de Boer A, Harteveld AA, Stemkens B, et al. Multiparametric Renal MRI: An Intrasubject Test-Retest Repeatability Study [published online ahead of print, 2020 Apr 16]. J Magn Reson Imaging. 2020;10.1002/jmri.27167.
- Cox
EF, Buchanan CE, Bradley CR, et al. Multiparametric Renal Magnetic Resonance
Imaging: Validation, Interventions, and Alterations in Chronic Kidney Disease.
Front Physiol. 2017;8:696. Published 2017 Sep 14.
Figures