2519
Phosphorus Magnetic Resonance Spectroscopy of Healthy Human Kidney in-situ at 3T
Maysam Jafar1 and Jan Weis2
1Clinical Science, Philips Healthcare, Stockholm, Sweden, 2Department of Medical Physics, Uppsala University Hospital, Uppsala, Sweden
1Clinical Science, Philips Healthcare, Stockholm, Sweden, 2Department of Medical Physics, Uppsala University Hospital, Uppsala, Sweden
Synopsis
Phosphorous (31P) spectra of healthy human kidney are invaluable in studies of kidney physiology, disease and in the evaluation of allograft viability pre and post renal transplantation. However, 31P-spectroscopy of the kidney in-situ is challenging due to the relatively large distance between the kidney and the surface coil. The aim of this study was to investigate whether it is possible to acquire 31P spectra of normal kidney in a clinically acceptable measurement time using a 3T MR scanner. We demonstrate that localized phosphorous spectroscopy of normal kidney in-situ is feasible in today’s 3T clinical MR systems.
Introduction
Phosphorus magnetic resonance spectroscopy (31P-MRS) is a non-invasive tool for in-vivo detection and quantification of phosphorus-containing metabolites involved in cell membrane synthesis, cell membrane degradation and in the energy-producing pathways necessary for cell functions 1,2. 31P-MRS of the kidney of healthy volunteers in-situ is challenging due to the relatively large distance (60-80 mm) between the kidney and transmit-receive 31P surface coil. Despite this difficulty, phosphorous spectra of the normal kidney are needed in studies of kidney physiology, disease and in the evaluation of human allograft viability and its function pre and post renal transplantation. To the best of our knowledge, the only reports of 31P spectra of the healthy human kidney in-situ were published in 1988 and 1990 3,4. The main aim of this study was to investigate the feasibility of localized 31P-MRS of normal kidney in-situ in a clinically acceptable measurement time using a state-of-the-art 3T MR scanner.Methods
Five healthy volunteers participated in this study. All examinations were performed on a Philips 3T Achieva dStream MR system. 31P spectra were acquired by a tunable transmit-receive loop coil with a diameter of 14 cm. Single voxel spectra were acquired using the ISIS localization sequence (TR 5000 ms, 512 scans, spectral bandwidth 3000 Hz, 2048 complex points, net acquisition time 43 min). The ISIS sequence was combined with broad-band proton decoupling and nuclear Overhauser effect (NOE) enhancement. The whole body coil was used for imaging, decoupling and NOE enhancement.The acquired spectra were fitted by Lorentzians using the AMARES algorithm (jMRUI software package 5). No apodization of the FID was used in spectrum processing. However, a Lorentzian apodization corresponding to 8 Hz line broadening was applied for the purpose of illustration. The frequency axis (0 ppm) was defined by setting the phosphorylethanolamine (PE) singlet to 6.77 ppm 6. The chemical shifts of the phosphorylcholine (PC) and membrane phospholipids (MP) resonances with respect to the PE line were found to be -27.92 Hz and -246.7 Hz respectively. Peak positions of inorganic phosphate (Pi), glycerol-3-phosphorylcholine (GPC), and γ-, α-, β- adenosine triphosphate (ATP) were estimated by AMARES. The frequency shift between GPC and glycerol-3-phosphorylethanolamine (GPE) was fixed to 28.44 Hz. Nicotinamide adenine dinucleotide (NAD) spectral line was placed -40.9 Hz from α-ATP 7. PE linewidth was constrained to an interval of 5-20 Hz, Pi to 15-30 Hz, and MP to 25-40 Hz. PC linewidth was set to be equal to PE and GPE equal to GPC. The splitting of ATP multiplets was set to 16 Hz 6. The amplitude ratios of doublets and triplets were set to 1:1 and 1:2:1, respectively. ATP and NAD linewidths were fixed with respect to PE using predefined ratios of 1.3, 0.9, 1.8, and 1.22 for γ-, α-, β, and NAD lines respectively 6. The zero- and first-order phase corrections were estimated by AMARES. The first-order correction was constrained to ±0.5 ms in the time domain. The left kidney spectra from each volunteer were phase and frequency corrected using the described prior knowledge and added together.
Results and discussion
A representative voxel position is shown in Figure 1. The typical voxel size was 35 (AP) x 50 (LR) x 70 (FH) mm3. B0 shimming resulted in a voxel water linewidth between 26 and 32 Hz. Distance between the centre of the voxel and the surface coil was ~70±10 mm. The large depth of the kidney in human body with respect to the surface coil combined with respiratory movement worsens SNR and the spectral quality. To improve SNR, the spectra of all five volunteers were added and the resulting spectrum was fitted as shown in Figure 2. The spectral intensity ratios of phosphomonoesters (PME = PE+PC), phosphodiesters (PDE = GPE+GPC), Pi, and (γ+ α-ATP) are shown in Table 1. These ratios are frequently utilized in the evaluation of allograft's viability pre and its function post renal transplantation. Total ATP spectral intensity is preferable to these ratios but the intensity of β-ATP resonances is significantly reduced due to the non-ideal excitation profile of the hyperbolic-secant inversion and the detection B1 pulses used in the ISIS sequence. Furthermore, B1 pulses have limited bandwidth and their respective amplitudes drop rapidly with distance from the transmit coil. This fast decay in amplitude results in a narrower effective excitation bandwidth.Conclusions
We have demonstrated that localised 31P-MRS of normal kidney in-situ is feasible in today’s 3T clinical MR scanners. Measured reference phosphorous spectral intensity ratio of healthy kidney may prove to be beneficial in evaluating changes in renal metabolism associated with diseases and transplantation.Acknowledgements
We would like to thank all volunteers who took part in this study.References
- Heerschap A, Houtman C, Zandt HJ et al. Introduction to in vivo 31P magnetic resonance spectroscopy of (human) skeletal muscle. Proc Nutr Soc 1999;58:861-870.
- Balaban RS. MRS of the kidney. Invest Radiol 1989;24:988-992.
- Boska MD, Meyerhoff DJ, Twieg DB et al. Image-guided 31P magnetic resonance spectroscopy of normal and transplanted human kidneys. Kidney International 1990;38:294-300.
- Jue T, Rothman DL, Lohman JAB, et al. Surface coil localization of 31P NMR signals from orthotopic human kidney and liver. Proc Natl Acad Sci USA 1988;85:971-974.
- Naressi A, Couturier C, Devos JM, et al. Java-based graphical user interface for the MRUI quantitation package. Magn Reson Mater Phys Biol Med 2001;12:141-152.
- Deelchand DK, Nguyen TM, Zhu XH et al. Quantification of in vivo 31P NMR brain spectra using LCModel. NMR Biomed 2015;28:633-641.
- Potwarka JJ, Drost DJ, Williamson PC. Quantifying 1H decoupled in vivo 31P brain spectra. NMR Biomed 1999;12:8-14.
Figures
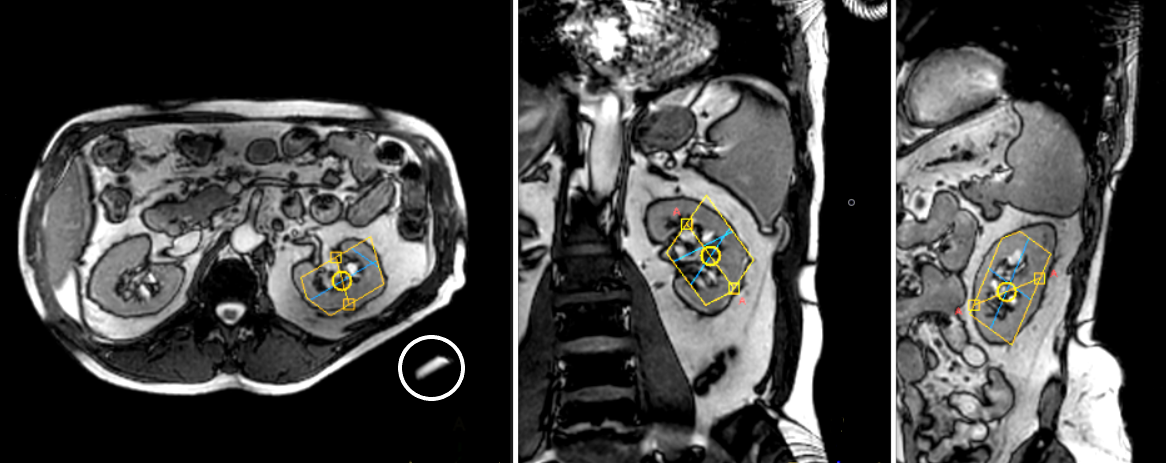
Figure 1: Typical voxel position in axial,
coronal and sagittal planes. A small water-containing bottle (circled) was
attached to the centre of the coil as a marker of coil position.
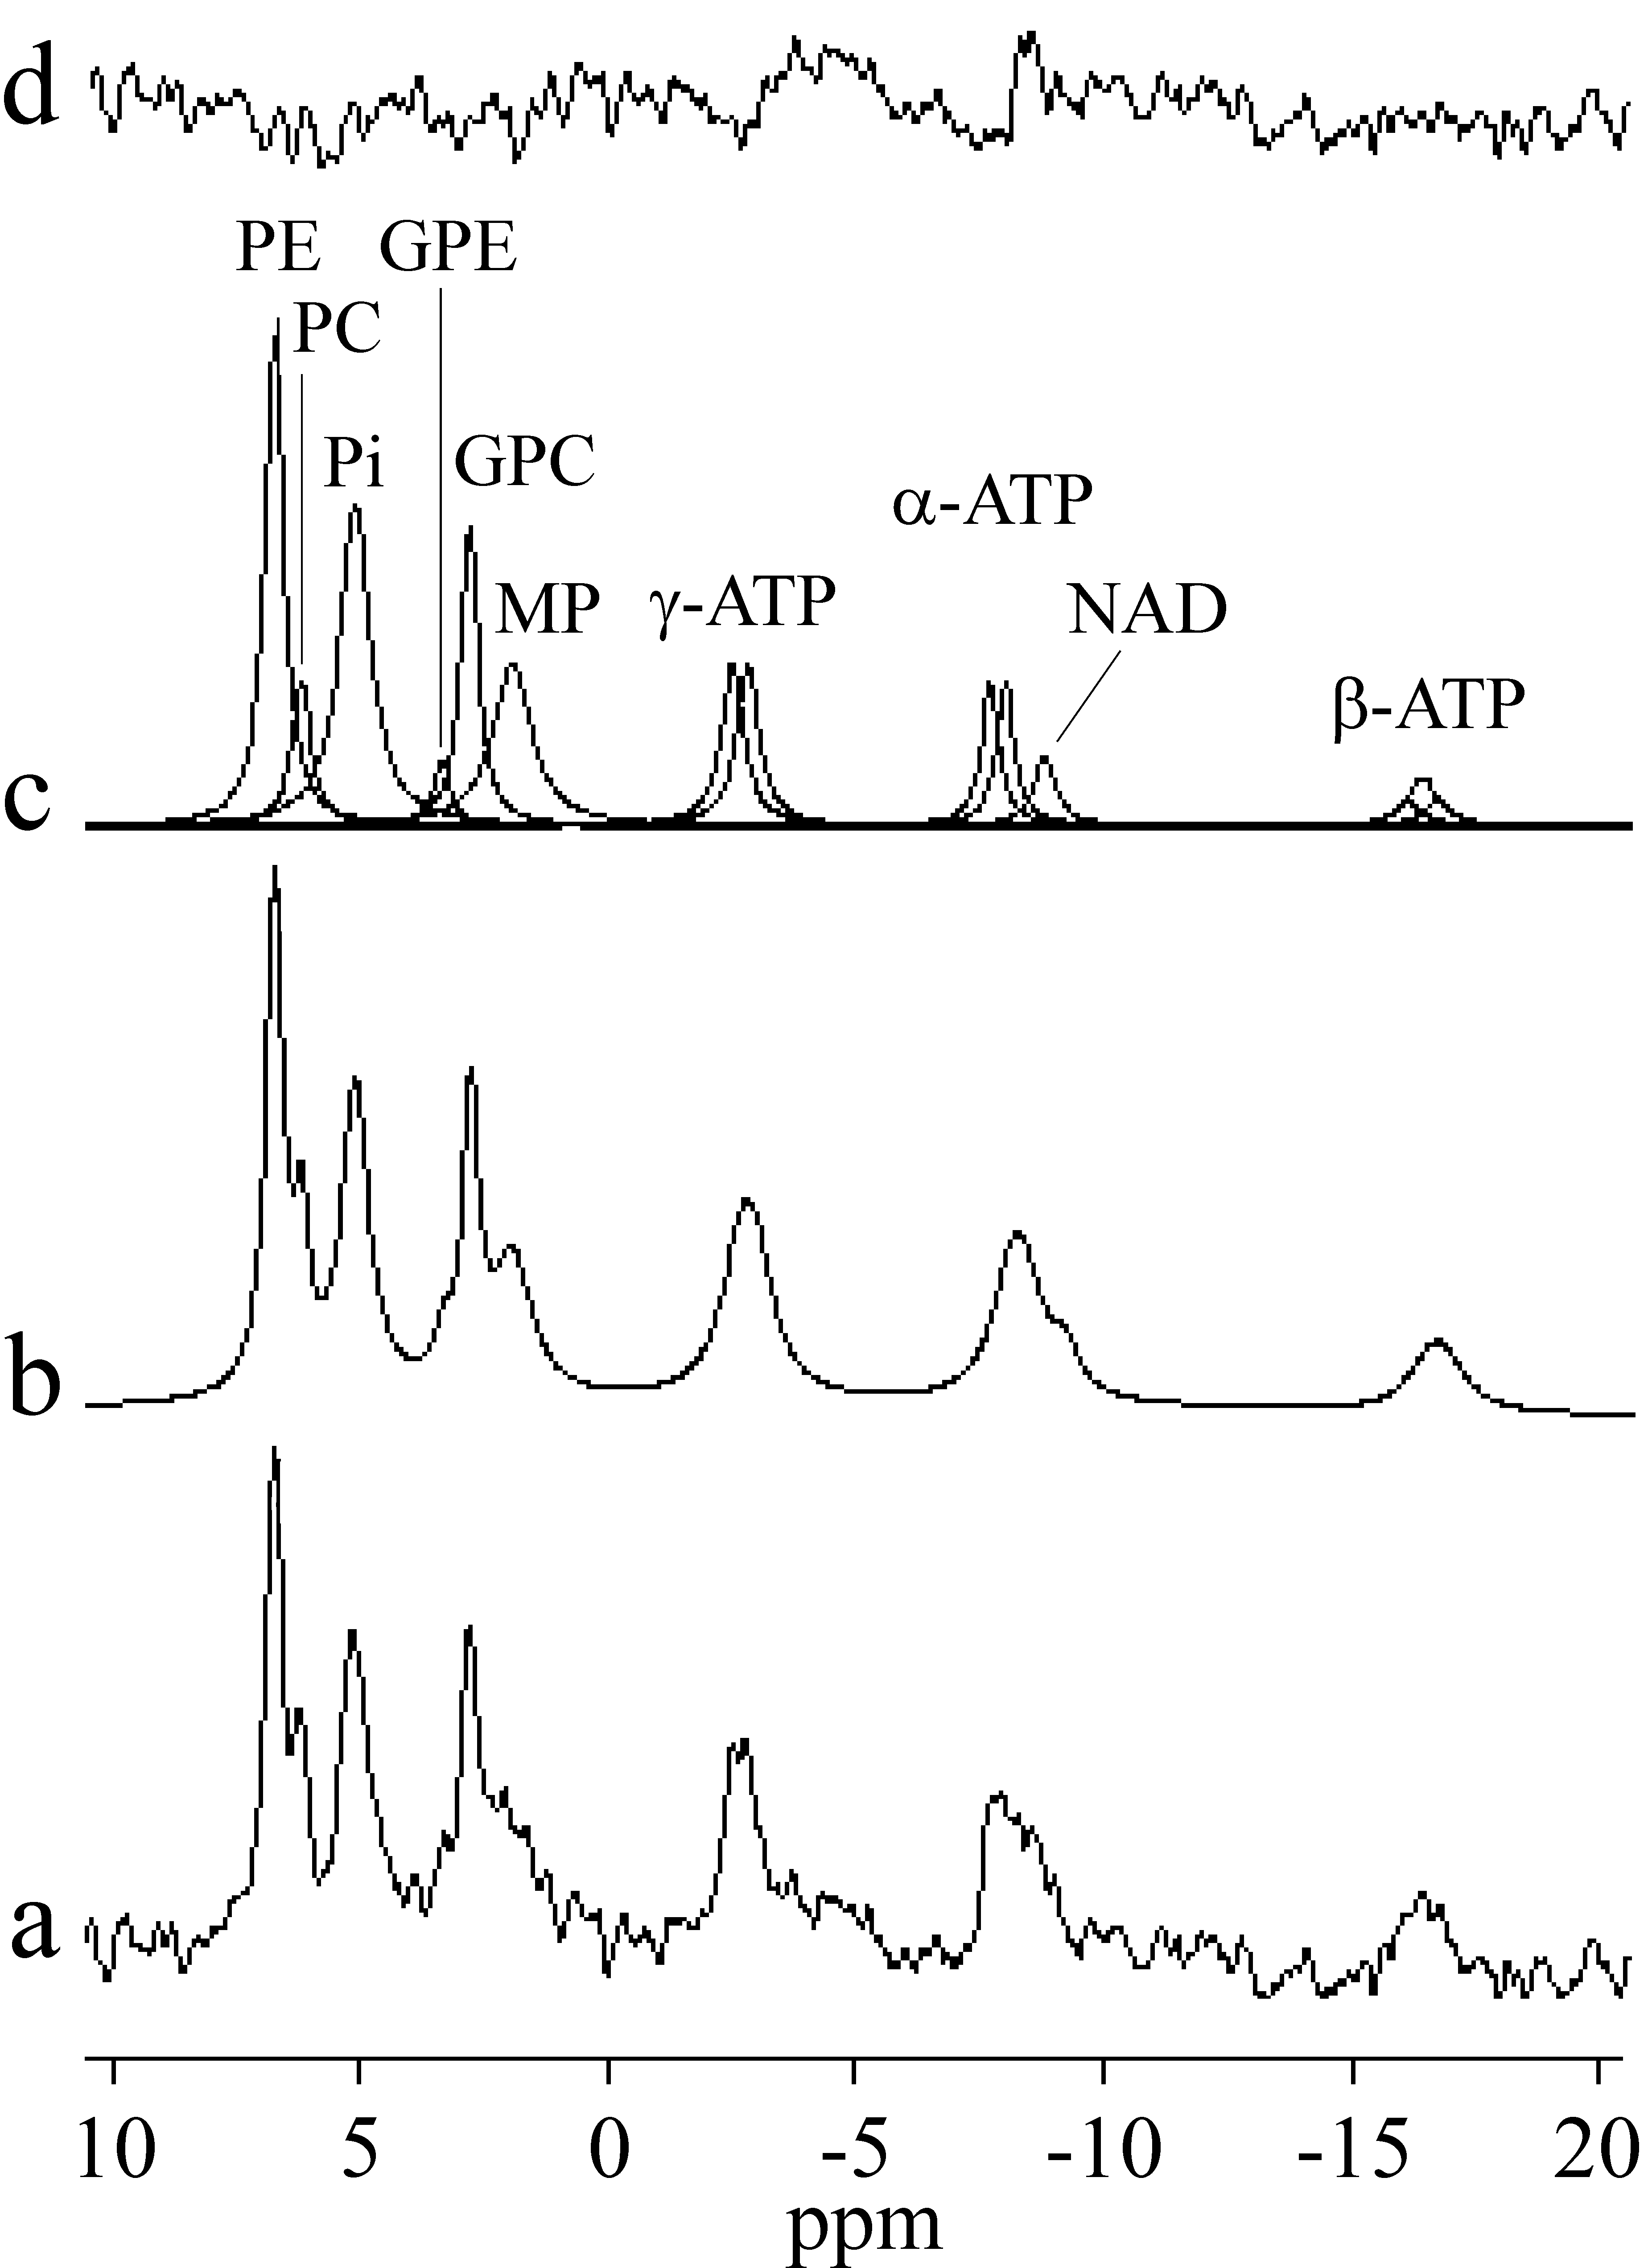
Figure 2: 31P spectrum of the normal human
kidney in situ. (a) The added spectrum of the five healthy volunteers, (b)
fitted spectrum, (c) individual components, and (d) residue.
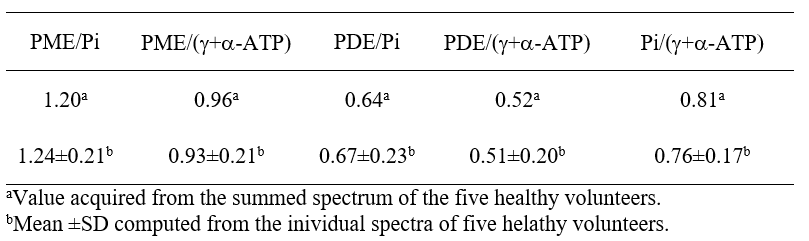
Table 1: Spectral
intensity ratios of normal kidney in situ.